m illi m e t r e w a v e b a n d u si n g
f r a c tio n al f r e q u e n c y r e u s e
Al-F al a hy, N FA a n d Ala ni, OYK
h t t p :// dx. d oi.o r g / 1 0 . 1 1 0 9 /ACC E S S. 2 0 1 7 . 2 7 6 2 3 3 8
T i t l e
N e t w o r k c a p a ci ty o p ti mi s a tio n i n m illi m e t r e w a v e b a n d
u si n g f r a c ti o n al fr e q u e n c y r e u s e
A u t h o r s
Al-F al a hy, N FA a n d Ala ni, OYK
Typ e
Ar ticl e
U RL
T hi s v e r si o n is a v ail a bl e a t :
h t t p :// u sir. s alfo r d . a c . u k /i d/ e p ri n t/ 4 3 9 6 4 /
P u b l i s h e d D a t e
2 0 1 7
U S IR is a d i gi t al c oll e c ti o n of t h e r e s e a r c h o u t p u t of t h e U n iv e r si ty of S alfo r d .
W h e r e c o p y ri g h t p e r m i t s , f ull t e x t m a t e r i al h el d i n t h e r e p o si t o r y is m a d e
f r e ely a v ail a bl e o nli n e a n d c a n b e r e a d , d o w nl o a d e d a n d c o pi e d fo r n o
n-c o m m e r n-ci al p r iv a t e s t u d y o r r e s e a r n-c h p u r p o s e s . Pl e a s e n-c h e n-c k t h e m a n u s n-c ri p t
fo r a n y f u r t h e r c o p y ri g h t r e s t r i c ti o n s .
Network Capacity Optimisation in Millimetre Wave Band
Using Fractional Frequency Reuse
Naser Al-Falahy
(1),(2)and Omar Y. K. Alani
(1)(1)University of Salford, Manchester, United Kingdom, (2)University of Anbar, Iraq
[email protected], [email protected]
This work is fully sponsored by the Ministry of Higher Education and Scientific Research in Iraq (MOHESR) - University of Anbar.
Abstract— Inter Cell Interference (ICI) is a major challenge that degrades the performance of mobile systems, particularly for cell-edge users. This problem arises significantly in the next generation system, as the trend of deployment is with high densification, which yields an ultra-dense network (UDN). One of the challenges in UDN is the dramatic increase of ICI from surrounding cells. A common technique to minimise ICI is interference coordination techniques. In this context, the most efficient ICI coordination is fractional frequency reuse (FFR). This paper investigates the FFR in UDN millimetre wave network at 26GHz band. The focus is on dense network with short inter site distance (ISD), and higher order sectorisation (HOS). The metrics used in frequency reuse is the signal to interference plus noise ratio (SINR) rather than the distance, as the line of sight in millimetre wave can be easily blocked by obstacles even if they are in close proximity to the serving base station. The work shows that FFR can improve the network performance in terms of per user cell-edge data throughput and average cell throughput, and maintain the peak data throughput at a certain threshold. Furthermore, HOS has a potential gain over default sectored cells when the interference is carefully coordinated. The results show optimal values for bandwidth split per each scenario in FFR scheme to give the best trade-off between inner and outer zone users performance.
Index Terms— 5G Network, Fractional Frequency Reuse, Higher Order Sectorisation, Millimetre Wave Band.
I. INTRODUCTION
HE fifth generation (5G) is the next generation of wireless system for mobile networks to achieve very low latency, higher spectral efficiency, high data throughput, and to provide flexibility in design and implementation [1].
Due to the popularity of data hungry devices such as smart phones and tablets, this has increased the demands for faster mobile data traffic. Mobile networks operators face the need to install dense high capacity base stations (BSs) as well as small cells. These base stations should cover not only wide range but also hot-spots with fast, flexible and dynamic supply to cope with the unpredictable future users requirements.
5G networks have more challenges in improving the overall spectral efficiency, and reducing the operational and deployment cost. And since the trend of next generation network is ultra-dense network (UDN), Inter-Cell Interference
(ICI) will be a challenging issue in 5G network.
In a cellular communication system, ICI is one of the main factors that impact the data throughput at the cell-edge zone, which consequently reduce the spectral efficiency of the base station. Mobile systems have two frequency assignment techniques. In the first one, base stations transmit different frequencies, where each sector uses 25 per cent of the bandwidth. Here the reuse factor is 25%, and called Frequency Reuse Factor 3 (FRF3). This scheme can highly minimise the co-channel interference among nearby cells, however, it reduces the spectrum efficiency. This technique has been used in Global System for Mobile Communication (GSM). In 3G/4G networks, all cells have the same carrier frequency and same bandwidth (reuse factor is 100 per cent), and called Frequency Reuse Factor 1 (FRF1), which increases the spectrum efficiency but at the expense of increasing the interference from nearby cells [2].
Another technique can trade-off the aforementioned frequency reuse techniques, where every cell can transmit in the same frequency in the centre area; allocating the major part of the resources to this area, while the cell-edge area will use different resources to reduce interference, this technique known as Fractional Frequency Reuse (FFR) [2][3]. FFR divides the coverage area of the cell into inner and outer zones, where different FRFs are implemented in these regions to minimise the interference and increase the average spectral efficiency.
In [4], FFR was proposed to balance the peak data throughput and the average and cell-edge data throughput in cell area. The authors in [3][5] have proposed FFR with uniform power distribution and introduced the principle of capacity density and bandwidth density in Long Term Evolution (LTE) network, where their results show a noticeable improvement in cell-edge performance. While in [6], FFR was introduced in order to combat inter cell interference (ICI) in LTE network, the authors have evaluated two FFR scenarios, namely, FFR and Soft Frequency Reuse (SFR). The authors have compared them with the frequency reuse scheme in LTE network. A distance dependant frequency reuse scheme has been proposed in [7] with irregular macro base station placements, the author have derived new equations for signal to interference plus
noise ratio (SINR) and uses difference power profile for BS transmission to optimise the network capacity. Nonetheless, SFR has better spectral efficiency but higher interference compared with FFR. This is due to the fact that the spectrum dedicated for the cell edge may also be used in the central zone if it is not being used at the cell edge [8].
Frequency reuse in millimetre wave band (mm-wave) has first proposed by V. Roman in [9], particularly in the local multipoint distributed service (LMDS) band at 28GHz. The author has shown a frequency reuse range of 1 up to 8 per cell, in addition to use polarisation and sectorisation to boost system capacity in this band.
FFR optimisation in this paper is aimed at maximising the cell-edge area data throughput (edge TP) and average user data throughput (avg TP), while maintaining the peak throughput (peak TP) at a certain threshold. The focus is on using higher carrier frequency; particularly in 26GHz band, where there is a precious bandwidth (24.25-27.5)GHz available for ultra-dense very high capacity networks in the UK [10]. This band has a high dependency on line of sight (LOS) due to their weak signal as result of high path loss and atmospheric attenuation. FFR is also important especially in higher order sectorisation (HOS) scenario in millimetre wave band [11] due to the increased interference as we will see in this paper. In HOS, ICI is growing dramatically due to the increased nearby cell interference. And the usage of FRF1will result in severe ICI, particularly at the cell-edge area, which degrade the network performance in terms of coverage and capacity [12]. Therefore, interference coordination is necessary to handle the excess interference and improve the cell performance.
This FFR split scenario take the advantage of both FFR1and FFR3by splitting the cell area into two areas: inner and outer zones. The bandwidth BTis also partitioned into an inner band Binn and outer band Bout. The inner zone is reused by all user equipment’s (UEs); with a reuse factor of 1 (FFR1) and therefore has a Full Reuse (FR) spectrum. On the other hand, the outer zone utilises a higher reuse factor (FRF3) to help combat ICI at the cell-edge zone, and thus, it has Partial Reuse (PR) spectrum [5].
The simulation of millimetre wave band is motivated by the spread of ray tracing tools that can predict the path loss and channel model of millimetre wave band. And also support diffuse scattering prediction model that greatly improves simulation accuracy for millimetre wave systems being developed for 5G. Wireless InSite®[13] and ICS Telecom/Designer by ATDI [14] have the potential to support higher frequency band, and considered as a high-fidelity ray tracing solvers for radio network planning and optimisation.
The rest of the paper is structured as follow: the network model is illustrated in section II, with a brief discussion on millimetre wave band. Section III discusses the problem optimisation and presents its formulation. In section IV, the performance metrics
is clarified, which is the data throughput. The resources assignment in FFR scheme is discussed in section V and our proposed algorithm is presented. After that, the simulation result and discussion is illustrated in section VI. The use of FFR in higher order sectorisation network is discussed in section VII. Finally, the conclusions are drawn in section VIII.
II. NETWORK MODEL
The network model is illustrated in fig.1, it consists of millimetre wave nodes that connect a number of User Equipment (UEs) that either lie in inner zone supporting FRF1 or outer zone which support FRF3. The UE SINR will decide whether this UE fall in either region. In this context, SINR threshold is defined so that any UE will exceed this threshold will be considered in the inner zone with FRF1, while UEs fail to achieve this threshold will be in the area of FRF3(cell-edge area), in this area, FRF3 aim to improve the SINR on the account of reduced resources.
Most FFR/SFR schemes depend on the distance between BS and UE to judge whether UE lies in inner zone or in outer zone. The distance calculation is a complex issue that could dramatically increase the complexity of FFR/SFR algorithm. It also ignore nearby UEs that has low SINR due to bad channel condition.
In millimetre wave band, however, UEs can be in a bad channel condition (low SINR) when the LOS is blocked by obstacles, even if they are in close proximity to their serving base stations. In order to take into account nearby UEs with low SINR, the split between inner/outer zones in this work is decided by UEs SINR. A threshold of SINR is set in the proposed algorithm for resource assignment, which split the region into two parts. UEs with low SINR will be treated as a cell-edge (outer zone), in which the algorithm will assign these UEs a sub-band that do not interfere with inner zone. While UEs having high SINR figures will be considered as inner zone, with full frequency reuse. These two zones will have two different schedulers that are used to simultaneously schedule the UEs of these regions. Details of simulation parameters are listed in table 1.
Fig.1. Network model showing the FFR frequency assignment, the sky-blue is the part of the bandwidth assigned to the inner zone with (FRF1), while the
coloured parts are for partial assignment with (FFR3).
∈ , ( , )≤ , ( , )∈ , ( , )> , ( , )∈
(1)
A. Millimetre wave band
When higher network capacity and connectivity is required, additional amount of spectrum is required as a result. And mobile network operators have improved the network capacity through utilizing additional bandwidth (higher frequency and wider bandwidth). Therefore, it is expected that 5G network will utilise higher bandwidth, such as utilising mm-wave band due to the very wide available bandwidth [16].
The Federal Communications Commission (FCC) has released many bands within mm-wave band to be used as a promising candidate for future 5G mobile system, including the local multipoint distribution service (LMDS) band from 28 to 30 GHz, 14GHz at the license-free band at 60 GHz, as well as 12.9 GHz located at 71–76 GHz, 81–86 GHz, and 92–95 GHz from the E-band [17][18]. The office of communication in the UK (Ofcom) has released the 26GHz band in the UK [10]. And due to their small wavelengths, millimetre wave suffer high path loss (as per eq.2) and high atmospheric attenuation as shown in fig.2, thus has limited coverage [28].
Fig.2. Average atmospheric attenuation of mm-wave [19].
TABLE1 NETWORK MODEL PARAMETERS
Model parameter Value
Multiple access OFDMA
Network size 21 cells /10UEs per cell, with 25 surrounding interfering cells
Tx Power 40 dBm
Tx antenna gain GTx 18 dB
Rx antenna gainGRx 0 dB
Tx pattern As in eq.1
Electrical tilt - 6 degree (down tilt) Rx pattern Omni-directional Carrier frequency 26GHz
Bandwidth 500MHz
Speed of light 299792458 m/s Tx Antenna height 10 m
Rx antenna height 1.5 m Inter site distance 150m
Modulation Adaptive (QPSK, 16QAM, 64QAM)
Region of interest ROI = 600x600 m
Noise Figure 10 dB
Traffic Model Full Buffer
Scheduling Round Robin & Proportional fair
The transmitting nodes have three sectors with directional antennas, the patterns is:
( ) = − 12 , ℎ − 180 ≤ ≤ 180
where θ3dB is the 3dB beamwidth that corresponds to 65 degrees, and Am= 20 dB represents the maximum attenuation.
B. Path loss
The path loss between a base station and connected UE is defined by the channel model [20]:
Gch=32.4 + 20 log10f + 10αlog10R +Xσ (3)
where: Gch is the channel gain between BS and UE in dB, fis the carrier frequency in GHz, Ris the separation between base station and device in metres,αis the path loss exponent, and Xσ
is the shadow fading loss which can be represented by log normal shadowing, that has zero mean and 9dB [21][22] standard deviation. Fig.3 shows the path loss and SNR mapping for path loss map (left) and path loss and shadow fading map (right).
Fig.3. SINR mapping of mm-wave sites, left is the path loss map, and right is the path loss plus shadow fading map.
III. THEPROBLEMOPTIMISATION
The adaptive resource assignment partitions the cell coverage area into two parts: cell centre with full reuse and cell edge with partial reuse. The scheduler of FFR divides the total bandwidth BTbetween these areas. Therefore, in three sectored site, the total bandwidth of a sector is given by:
= + (4)
where Binn is the bandwidth of inner zone and Bout is the bandwidth of outer zone (cell-edge).
To manage the bandwidth partitioning more efficiently, βFRis defined as the normalized FR bandwidth:
= , ℎ 0 ≤ ≤ 1 (5)
Therefore, for a single cell (one sector), the total available bandwidth will be:
= . +13 (1 − ) (6)
where: BFFR is the bandwidth for single cell in FFR network.
Given that ≤ :
For = 0,
= , Similar to FRF3 (7)
and for β = 1,
= , Similar to FRF1 (8)
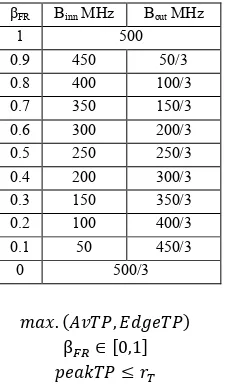
This means that there will be a reduction in the amount of total usable bandwidth. And users in inner zone do not share the bandwidth with outer zone, which minimise the interference for centre UEs and cell-edge UEs. Table 2 shows the
bandwidth split for different values of βFR from a total bandwidth of 500MHz.
The purpose here is to find the best trade-off for βFR to maximize the average cell throughput (Av TP) and the cell-edge throughput (Edge TP), while maintaining the peak data throughput at certain threshold. Therefore, the optimisation problem can be written as:
Table 2, Available bandwidth for FR/PR zones according to βFRsetting
βFR BinnMHz BoutMHz
1 500
0.9 450 50/3
0.8 400 100/3
0.7 350 150/3
0.6 300 200/3
0.5 250 250/3
0.4 200 300/3
0.3 150 350/3
0.2 100 400/3
0.1 50 450/3
0 500/3
. ( , )
β ∈ [0,1] ≤
(9)
where rTis the minimum required peak data throughput.
IV. DATA THROUGHPUT
The data throughput of cellular network has an upper theoretical bound represented by the well-known Shannon formula [26]:
≤ = log (1 + ) (10)
where:
= + (11)
γi is the SINR, B is the allocated bandwidth, S is the signal power of the serving cell, I represents the interference from all surrounding cells, and N denotes the thermal noise power. And due to the frequency reuse scheme which split the UE according to their SINR and split the entire bandwidth into two parts, therefore, we will have two data throughput per cell. for centre zone implementing FRF1and for outer zone (cell-edge) implementing FRF3. And the total cell throughput is the sum of throughput in inner and outer zone:
= ( >( ≤ ),), ∈∈ (12)
where,
= ∗ log (1 + ( )) (13)
=(1 −3 ) log (1 + ( )) (14)
Therefore, the average cell throughput is:
[image:5.595.378.497.64.256.2]V. RESOURCES ASSIGNMENT
The simulation and resource assignment of FFR scheme in cellular network is represented by the pseudo code in algorithm1. The simulation is initialised by defining the Region of Interest (ROI), in which all BSs and UEs are generated inside. The simulation length will last for 50 TTIs. The physical resource blocks PRB is defined according to the allowed bandwidth. And in this stage, two important parameters are defined in this step, namely: SINR threshold (γth) and the normalized bandwidth (βFR). Furthermore, due to the split of bandwidth (resources), two schedulers can be called to schedule the resources of inner zone and outer zone, simultaneously. In this work, round robin (RR) and proportional fair (PF) scheduling algorithms have been used as the scheduler for FR/PF zones. There are no restrictions on using any other scheduling algorithms, and different schedulers can be used for FR/PR zones, simultaneously. The simulation will check the available devices that request resources and check their SINR, compare it with γth, in order to split the FR zone from PR zone. If a UE SINR is equal to, or less than γth, then this UE will be assigned to PR zone where a certain scheduler will be responsible for the resource scheduling, with a total bandwidth of (1-βFR).BT/3. Otherwise, if the UE SINR is larger than γth, this UE will be assigned to the FR zone with a different scheduler that is responsible on resources assignment of similar UEs, with a bandwidth of βFR.BT. Both schedulers will assign their resources until all available PRB is exhausted. When the allowed TTI is reached, the simulation will be concluded and the data throughput for both regions is aggregated.
VI. SIMULATION RESULTS AND DISCUSSION
For worst case consideration in terms of inter cell interference, all cells are transmitting at full power. The SINR calculation (see fig. 4) of the UEs in simulation is determined by calculating the received power of each UE according to Friis formula[27]:
= + + − (16)
Where: pris the received power, pT is the transmitted power by the cell (radiation pattern) according to eq.(2), GT, Gr are the gain of transmitting and receiving antennas, respectively. In this work, GT=18 dBi, while Gr=0. Lpdenotes the signal path loss according to eq.(3).
The transmitting BS are at 10m in height [20][28][29], while UEs are at a height of 1.5m, with inter site distance of 150m. The SINR to throughput mapping in fig. 5 shows the UEs data throughput with respect to UE SINR with normal frequency reuse, FRF1, where only one zone available, implementing round robin scheduling. In this scheme, the peak throughput is 57Mbps, edge throughput= 6.27Mbps, with average cell throughput= 188.53 Mbps. On the other hand, fig.6 depicts the SINR to throughput mapping of FFR scheme network, with γth =0dB and βFR=0.7. In this scenario, the cell coverage has split into inner and outer zone, with FFR1and FFR3, respectively. In this scenario, the cell-edge data throughput has improved to
9.26 Mbps (gain= % 47.47), and the average cell throughput has improved to 226.69 (gain=%20.23).While the peak data throughput is 66.28Mbps with %16.27 gain over full reuse frequency scheme FRF1. Lower values of βFR can further improve cell-edge data throughput, but on the expense of loss in peak data throughput.
Therefore, aggregating the data throughput of both zones has yield fig.7, which demonstrates the potential gain in average and cell-edge per user data throughput in the case of interference coordination, on the account of lower peak data throughput. This figure shows the relation between the peak/average data throughput and cell-edge data throughput as a function of the normalized bandwidth βFR.
Algorithm 1: Pseudo Code of Resource Assignment
1: DefineROI % region of interest
2: SetTTI=1ms
3: Define two scheduler, Round Robin & Proportional fair 3: Set Simulation time=50 TTI
4: Generate cells per ROI 5: Set finite UEs per cell
Set SINR threshold to γth Set βFRas per user setting 6: for each TTI do
7: Check available UEs SINR/available resources NPRB 11: for each Tx Node do
12: Check whether UE SINR below or above γth 13: ifUEiSINR>γth, then
Set b.w = ( βFR)*BT Pick a scheduler (RR/PF)
Schedule these UEs according to FRF1 14: else, ifUEjSINR <=γth, then
15: Set b.w = (( 1-βFR)/3)*BT%three sector cell Pick a scheduler (RR/PF)
16: Schedule these UEs according to FRF3 18: end if
19: Aggregate cell throughput for both zones 20: Calculate average/peak/edge data throughput
21: end for
22: end for
Fig.4. CDF of all UEs SINR in simulation
-5 0 5 10 15 20
0 0.2 0.4 0.6 0.8 1
SINR [dB]
C
D
F
Fig.5. SINR to throughput mapping of FRF1scheme network
Fig.6. SINR to throughput mapping of FFR scheme network, with γth=0dB
and βFR=0.7.
An optimum value for βFR can be chosen according to this figure, so that an improvement in cell-edge data throughput is achieved while keeping the peak throughput at a certain threshold. This will consequently improve the overall all cell data throughput. This figure is the result of using round robin scheduler for both FR/PR zones.
Fig.8 depicts the same scenario but with proportional fair scheduling been used for both FR/PR zones. An improvement in term of data throughput is noticeable here, however, doesn’t change the optimum βFRallocation. For both figures, a βFRof 0.7 can give improvement for cell-edge user while keep the peak data throughput loss at a minimum level. Fig. 9 shows the average cell throughput of both schedulers along with the bandwidth utilization as a function of βFR. Lower values of βFR can further improve cell-edge user performance, however, it can dramatically decrease the bandwidth utilisation, and hence, the overall cell performance.
While in fig. 10, the relation between balancing cell-edge and average UE throughput has been illustrated as a function of
βFR. It demonstrates how the value of βFR can balance the
capacity between split zones, where a ranges of βFR values from RR: round robin scheduling implementing FRF1as βFR=1
to a minimum of βFR= 0.1, a βFR in the range of 0.7 to 0.8 can give the best trade-off between the performance of inner and
outer zones. Low value of βFR, e.g. 0.1 can result in significant
improvement in cell edge zone data throughput; however, it will dramatically decrease the inner zone data throughput. On
the other hand, high figure of βFR, e.g. 0.9 can result in high throughput in inner zone, on the account of low throughput in outer zone UEs.
Fig.7 Average/cell-edge data throughput in three sector site with RR scheduling
Fig.8. Average/cell-edge data throughput in three sector site with PF scheduling
Fig.9. Bandwidth utilisation with average cell throughput as a functionof βFR
0 20 40 60 80 100 120 140
-5 0 5 10 15
UE d at a th ro ug hp ut (M bp s)
UE SINR (dB)
SNIR/Throughput mapping for default FRF1
0 20 40 60 80 100 120 140
-5 0 5 10 15
UE d at a th ro ug hp ut (M bp s)
UE SINR (dB) SINR to throughput mapping
0 2 4 6 8 10 12 0 10 20 30 40 50 60 70 80 90
0 0.1 0.2 0.3 0.4 0.5 0.6 0.7 0.8 0.9 1
Ce ll-ed ge th ro ug hp ut (M bp s) Pe ak /A vg th ro ug hp ut (M bp s) βFR
Data throughput with RR scheduling
Peak TP (RR) Avg TP (RR) Edge TP (RR)
0 2 4 6 8 10 12 14 16 18 20 0 10 20 30 40 50 60 70 80
0 0.1 0.2 0.3 0.4 0.5 0.6 0.7 0.8 0.9 1
Ed ge th ro ug hp ut (M bp s) Pe ak /A vg th ro ug hp ut (M bp s) βFR
Data throughput with PF schedulling
Peak TP (PF) Avg TP (PF) Edge TP (PF)
0 200 400 600 800 1000 1200 1400 0 20 40 60 80 100
0.9 0.8 0.7 0.6 0.5 0.4 0.3 0.2 0.1
Av er ag e Ce ll Th ro ug hp ut (M bp s) % B W u tii lis at io n βFR
Average Throughput vs Bandwidth utilisation
% BW utilisation Av.Cell.TP(PF) Av.Cell.TP(RR) γth
=0
dB
Fig.10. Balance between inner and outer zone with respect to βFR
VII. FREQUENCY REUSE IN HIGHER ORDER
SECTORISATION
As millimetre wave has high directionality and dependency on line of sight, it is anticipated that higher order sectorisation (HOS) is used to further increase the network capacity and boost its performance. In [30], the authors have proposed a six sectored order for the base station, in order to improve the system throughput through the spatial multiplexing and interference coordination. However, higher inference is expected due to the new surrounding sectors transmitting at the same carrier frequency [11] as shown in fig.11, where interference is compared between three and eight sectored cell, in terms of UE SINR. It has been seen that around 5dB loss in UE SINR in eight sector scenario compared with the default three sectored sites. It’s worth mentioning that some contributions claim that an order of eight achieves no gain over six sectorisation due to the excess interference, and therefore, suggested that sectorisation is kept up to six.
In such scenario, FFR scheme has been applied to eight sectored cell, which will split the coverage area into two regions: inner and outer zone. However, the bandwidth will be split into FR band for inner zone plus eight PR sub-bands for outer zone, where:
= . , =18(1 − ). (17)
Fig.12 depicts the 8-secoted base station with FFR scheme. Every colour denotes a sub band that is assigned to the cell-edge users of a single sector. Therefore, the total bandwidth for a single sector can be written as:
= + = . +18 (1 − ) (18)
And therefore, the data throughput for each zone will be: for inner zone:
= ∗ log (1 + ( )) (18)
and for outer zone:
=(1 −8 ) log (1 + ( )) (19)
In HOS, new sectors have been added to take advantage of the directionality of millimetre wave. However, the new sectors have generated a new interference, as recently showed in fig.11. This makes some UEs which lie between these sectors to have low SINR, making them to be assigned to the outer zone consideration, with partial frequency reuse. Fig.13 demonstrates this case, where the SINR mapping is shown for eight sectored base station. Dots denote UEs assigned in the inner zone with full frequency reuse, whereas crosses denote UEs assigned in the cell-edge zone with partial frequency assignment.
Fig.11. Interference in HOS in terms of SINR
Fig.12. Network model showing the FFR frequency assignment for HOS
Fig.13. Eight sectored base station, with FFR scheme; dots represent the UEs with full reuse (FRF1), while the crosses represent UEs with partial reuse
(FRF3).
0 20 40 60 80 100 120
-4 -2 0 2 4 6 8 10 12 14 16 18
Av
g
da
ta
th
ro
ug
hp
ut
(M
bp
s)
Wideband SINR Avg. throughput for differnet βFR
RR β=0.9 β=0.8 β=0.7 β=0.6 β=0.5 β=0.4 β=0.3 β=0.2 β=0.1
0 0.2 0.4 0.6 0.8 1
-6 -4 -2 0 2 4 6 8 10 12 14 16 18
CD
F
UE SINR
Interference in 3/8-sectored base station
Likewise the default three sectored BS, the average cell throughput is decreasing as the value of βFRis decreased. And the cell-edge users will benefit from decreasing βFR.Therefore, an optimal value of βFR can be derived so that to achieve the optimised solution, where the cell-edge throughput is improved on the account keeping the peak throughput at a certain threshold. The average cell throughput is improved as a result. Fig.14 depicts this case, where the peak/average/cell-edge data throughput in Mbps - with round robin scheduling - is shown with respect to different values of βFR. As per this figure, a value of βFR = 0.6 is seen to provide the best trade-off to improve the outer zone data throughput while keep the inner zone user at a certain threshold. Fig.15 shows the same case with proportional fair schedulers . It’s noticed that the optimal value ofβFRhas been shifted by a 0.1 in HOS scheme , which equal to %10 of the total bandwidth, compared with default three sectored base station . This shift is justified by the higher number of sectors and the increased ICI, which make the cell- edge zone demands more bandwidth to cope with ICI and improve their UEs data throughput.
Fig.14. Average/cell-edge data throughput in HOS with RR scheduling
Fig.15. Average/cell-edge data throughput in HOS with PF scheduling
Generally, there are gains as a result of using FFR scheme as well as HOS in millimetre wave band. Therefore, in order to measure the gain, a simulation has been conducted assuming 40 UEs uniformly distributed around the transmitting site. In the first scenario, all sites are considered three sectored sites, without FFR. Then, FFR is implemented to see the gain. The same scenarios have been repeated with eight sectored site. As per fig.16, the gain per three and eight sectored site is shown in terms of both average site throughput (Gbps) and cell-edge data throughput (Mbps ). Interference coordination has increased the overall network performance. And in the case of higher order sectorisation , FFR has reduced the interference , which led into a high gain compared with other sectored sites.
Fig.16. FFR gain in three and eight sectored site
VIII. CONCLUSION
Due to the ultra-dense deployment represented by 5G deployment scenario, ICI will represent a serious challenge in future millimetre wave 5G systems. In this work, FFR interference coordination has been used to suppress interference in dense network at higher carrier frequency, particularly at 26GHz band.
Frequency reuse scheme is important in millimetre wave band to further boost the network capacity and improve its performance. In this context, FFR has been harnessed as interference coordination technique in order to combat ICI as a result of the dense network. The new scheme has shown a significant improvement in network performance in terms of cell-edge user data throughput and average cell data throughput while maintain the peak throughput at certain threshold. Optimum values for the normalised bandwidth βFR has been derived, for both three and eight sectored site, which give the best trade-off between cell-edge and center user performance. And with the right optimisation, eight sectored base stations can give the potential gain over three and six sectored base stations, to boost the network capacity.
0 4 8 12 16 20 0 40 80 120 160 200
0 0.1 0.2 0.3 0.4 0.5 0.6 0.7 0.8 0.9 1
ce ll-ed ge th ro ug hp ut (M bp s) pe ak /a vg th ro ug hp ut (M bp s) βFR
Eight_Sector Scenario with RR Sheduling
Peak TP Avg TP Edge TP 0 4 8 12 16 20 24 0 40 80 120 160 200 240
0 0.1 0.2 0.3 0.4 0.5 0.6 0.7 0.8 0.9 1
ce ll-ed ge th ro ug hp ut (M bp s) pe ak /a vg th ro ug hp ut (M bp s) βFR
Eight_Sector Scenario with PF Sheduling
peak TP Av TP Edge TP 0 5 10 15 20 25 30 35 40 45 0 0.5 1 1.5 2 2.5 Three
sectored siteThree sectorsFFR(0.7) sectored siteEight Eight SectorsFFR(0.6)
Ce ll-ed ge d at a th ro ug hp ut (M bp s) Av er ag e Si te d at a th ro ug hp ut (G bp s) Site topology
Data throughput in three and eight sectored site Avg. site TP (Gbps)
REFERENCES
[1] N. Al-Falahy and O. Alani, “Technologies for 5G Networks: Challenges and Opportunities,” IEEE IT Prof., vol. 19, no. 1, pp. 12–20, 2017.
[2] C. Cox, An Introduction to LTE, LTE-Advanced, SAE And 4G Mobile Communications, First Edit. Sussex: John Wiley & Sons, Ltd., 2012.
[3] J. Ikuno, M. Taranetz, and M. Rupp, “A Fairness-based Performance Evaluation of Fractional Frequency Reuse in LTE,” in
17th International ITG Workshop on Smart Antennas (WSA), Stuttgart, Germany, 2013, pp. 1–6.
[4] M.Assaad, “Optimal fractional frequency reuse (FFR) in multicellular OFDMA system,” in IEEE 68th Vehicular Technology Conference (VTC 2008-Fall), Calgary, Canada, 2008, pp. 1–5. [5] M. Taranetz, J. Colom Ikuno, and M. Rupp, “Capacity density
optimization by fractional frequency partitioning,” in 45th Asilomar Conference on Signals, Systems and Computers, Pacific Grove, CA, USA 2011, no. November, pp. 1398–1402.
[6] H. Elmutasim, O. Mohamed, M. Adil, and M. Abas, “Fractional frequency reuse in LTE networks,” in 2nd World Symposium on Web Applications and Networking (WSWAN), Sousse, Tunisia 2015, pp. 1–6.
[7] A. Adejo, S. Boussakta, and J. Neasham, “Interference Modelling for Soft Frequency Reuse in Irregular Heterogeneous Cellular Networks,” presented at the ninth International Conference on Ubiquitous and Future Networks (ICUFN ), Milan, Italy, July 4-7, 2017.
[8] Y. S. Cho, J. Kim, W. Y. Yang, and C. G. Kang, MIMO-OFDM Wireless Communications with MATLAB. John Wiley & Sons, Ltd., 2010.
[9] V. I. Roman, “Frequency Reuse and System Deployment in local Multipoint Distribution Service,” IEEE Pers. Commun., vol. 6, no. 6, pp. 20–27, 1999.
[10] Ofcom, Update on 5G spectrum in the UK, February. 2017, pp. 1– 19.
[11] N. Al-Falahy and O. Alani, “The Impact of Higher Order Sectorisation on the Performance of Millimetre Wave 5G Network,” in The 10th International Conference on Next Generation Mobile Applications, Security and Technologies (NGMAST2016), Cardiff, UK, 2016, pp. 1–5.
[12] M. Abd-Elnaby, A. S. Mohamed, and S. A. El-Dolil, “Self-organised dynamic resource allocation scheme using enhanced fractional frequency reuse in long term evolution-advanced relay-based networks,” IET Commun., vol. 10, no. 10, pp. 1163–1174, 2016.
[13] Remcom Inc., “Wireless InSite.,” 2014. [Online]. Available: www.remcom.com/wireless-insite. [Accessed: 15-Jan-2016]. [14] ATDI, “ICS Designer by ATDI.” [Online]. Available:
www.atdi.co.uk/software/radio-planning/ics-designer. [Accessed: 04-Apr-2016].
[15] 3GPP Technical Report, “LTE; Evolved Universal Terrestrial Radio Access (E-UTRA); Radio Frequency (RF) system scenarios (3GPP TR 36.942 version 10.3.0 Release 10),” 2011.
[16] Ericsson, “5G : what is it ?,” White Paper, October, pp. 1–10, 2014. [17] F. Boccardi, R. W. H. Jr., A. Lozano, T. L. Marzetta, and P.
Popovski, “Five Disruptive Technology Directions for 5G,” IEEE Commun. Mag., vol. 52, no. 2, pp. 74–80, 2014.
[18] F. Khan and Z. Pi, “An Introduction to Millimeter-Wave Mobile Broadband Systems,” IEEE Commun. Mag., vol. 59, no. 6, pp. 101– 107, 2011.
[19] M. Marcus and B. Pattan, “Millimeter Wave Propagation : Spectrum
Management Implications,” IEEE Microw. Mag., vol. 6, no. 2, 2005.
[20] A. Ghosh et al., “Millimeter-Wave Enhanced Local Area Systems :
A High-Data-Rate Approach for Future Wireless Networks,” IEEE J. Sel. Areas Commun., vol. 32, no. 6, pp. 1152–1163, 2014.
[21] G. R. M. Jr, J. Zhang, S. Nie, and T. S. Rappaport, “Path Loss Models for 5G Millimeter Wave Propagation Channels in Urban Microcells,” in Globecom - Wireless Communications Symposium, 2013, pp. 3948–3953.
[22] A. Heights, T. A. Thomas, and F. W. Vook, “System Level Modeling and Performance of an Outdoor mmWave Local Area Access System,” in IEEE 25th International Symposium on Personal, Indoor and Mobile Radio Communications System, Washington, DC, USA, 2014, pp. 108–112.
[23] C. Sheldon, E. Torkildson, M. Seo, C. P. Yue, M. Rodwell, and U. Madhow, “Spatial multiplexing over a line-of-sight millimeter-wave MIMO link: A two-channel hardware demonstration at 1.2Gbps over 41m range,” in 1st European Conference on Wireless Technology, Amsterdam, Netherlands, 2008, pp. 198–201.
[24] N. Al-falahy and O. Alani, “The Impact of Base Station Antennas Configuration on the Performance of Millimetre Wave 5G Networks,” presented at the ninth International Conference on Ubiquitous and Future Networks (ICUFN ), Milan, Italy, July 4-7, 2017.
[25] D. Gesbert, H. Bolcskei, D. A. Gore, and A. J. Paulraj, “Outdoor MIMO wireless channels: models and performance prediction,”
IEEE Trans. Commun., vol. 50, no. 12, pp. 1926–1934, 2002. [26] N. Bhushan et al., “Network Densification : The Dominant Theme
for Wireless Evolution into 5G,” IEEE Commun. Mag., vol. 52, no. 2, pp. 82–89, 2014.
[27] A. Sayeed, J. Brady, P. Cheng, and U. Tayyab, “Indoor channel measurements using a 28GHz multi-beam MIMO prototype,” in
IEEE Vehicular Technology Conference, Montreal, QC, Canada, 2017, pp. 1–5.
[28] N. Al-falahy and O. Alani, “Design Considerations of Ultra Dense 5G Network in Millimetre Wave Band,” presented atThe Second International Workshop on 5G and 6G Mobile Communications, Milan, Italy, July 4, 2017.
[29] Z. Zhang, J. Ryu, S. Subramanian, and A. Sampath, “Coverage and Channel Characteristics of Millimeter Wave Band Using Ray Tracing,” in IEEE International Conference on Communications (ICC), London, UK, 2015, pp. 2983–2988.
[30] S. Rajagopal, S. Abu-Surra, and F. Khan, “Antenna Array Design for Multi-Gbps mmWave Mobile Broadband Communication,” in