MeV+R: using MeV as a graphical user interface for Bioconductor
applications in microarray analysis
Vu T Chu
*
, Raphael Gottardo
†
, Adrian E Raftery
‡
, Roger E Bumgarner
*
and
Ka Yee Yeung
*
Addresses: *Department of Microbiology, University of Washington, Seattle, WA 98195, USA. †Department of Statistics, University of British Columbia, Vancouver, BC, V6T 1Z2, Canada. ‡Department of Statistics, University of Washington, Seattle, WA 98195, USA.
Correspondence: Ka Yee Yeung. Email: [email protected]
© 2008 Chu et al.; licensee BioMed Central Ltd.
This is an open access article distributed under the terms of the Creative Commons Attribution License (http://creativecommons.org/licenses/by/2.0), which permits unrestricted use, distribution, and reproduction in any medium, provided the original work is properly cited.
MeV+R
<p>MeV+R provides users with point-and-click access to traditionally command-line-driven tools written in R.</p>
Abstract
We present MeV+R, an integration of the JAVA MultiExperiment Viewer program with Bioconductor packages. This integration of MultiExperiment Viewer and R is easily extensible to other R packages and provides users with point and click access to traditionally command line driven tools written in R. We demonstrate the ability to use MultiExperiment Viewer as a graphical user interface for Bioconductor applications in microarray data analysis by incorporating three Bioconductor packages, RAMA, BRIDGE and iterativeBMA.
Rationale
While microarray technology has given biologists unprece-dented access to gene expression data, reliable and effective data analysis remains a difficult problem. There are many freely or commercially available software packages, but biol-ogists are often faced with trading off power and flexibility for usability and accessibility. In addition to the potentially pro-hibitive costs, researchers using commercial software tools may find themselves waiting for state-of-the-art algorithms to be implemented with the packages. The Bioconductor project [1,2] is an open source software project that provides a wide range of statistical tools primarily based on the R program-ming environment and language [3,4]. Taking advantage of R's powerful statistical and graphical capabilities, developers have created and contributed numerous Bioconductor pack-ages to solve a variety of data analysis needs. The use of these packages, however, requires a basic understanding of the R programming/command language and an understanding of the documentation accompanying each package. The primary users of R and the Bioconductor packages have been
compu-tational scientists, statisticians and the more compucompu-tationally oriented biologists. However, in our experience, many biolo-gists find themselves uncomfortable issuing command lines in a terminal. Hence, there is a need for a graphical user inter-face (GUI) for Bioconductor packages that will allow biolo-gists easy access to data analytical tools without learning the command line syntax. The tcltk package in R adds GUI ele-ments to R by allowing programmers to write GUI-driven modules by embedding Tk commands into the R language [5]. There are also GUIs developed for basic statistical analysis in R, such as the R Commander [6] and windows-based SciViews [7]. However, these GUIs are not designed for microarray analysis. There are Bioconductor packages, such as limmaGUI [8], affylmGUI [9] and OLINgui [10] that are built on the R tcltk package to provide GUIs. LimmaGUI and affylmGUI provide GUIs for the analysis of designed experi-ments and the assessment of differential expression for two-color spotted microarrays and single-two-color Affymetrix data, respectively. OLINgui provides a GUI for the visualization, normalization and quality testing of two-channel microarray
Published: 24 July 2008
Genome Biology 2008, 9:R118 (doi:10.1186/gb-2008-9-7-r118)
Received: 10 March 2008 Revised: 1 June 2008 Accepted: 24 July 2008 The electronic version of this article is the complete one and can be
data. However, no such GUIs are available for the majority of Bioconductor packages. In addition, since each Bioconductor package is often written by a different research group, there is generally no uniformity in the look and feel of the GUIs avail-able for the different packages. Hence, the end user may not be able to easily transfer experience gained with one analysis tool to the use of another.
An alternative microarray data analysis tool is the MultiEx-periment Viewer (MeV), a component of the TM4 suite of microarray analysis tools [11]. MeV has a user-friendly GUI designed with the biological community in mind. MeV is an open source Java application with a simple to learn, easy to use GUI. It comes with many popular microarray analytical algorithms for clustering, visualization, classification and biological theme discovery, such as hierarchical clustering [12] and Expression Analysis Systematic Explorer (EASE) [13]. MeV was carefully designed to provide an application programming interface (API), thus allowing straightforward contributions by the community. MeV is hosted at Source-Forge [14] in a concurrent versions system repository. As such, frequent builds of the source code are made possible, greatly reducing the lag time between version releases.
In this paper, we present MeV+R, which is an effort to provide more consistent and well-integrated GUIs for Bioconductor packages by using MeV as a 'wrapper' application for Biocon-ductor methods. Our work brings the best of both worlds together: providing state-of-the-art statistical algorithms from Bioconductor through the open source and easy to use MeV graphical interface to the biomedical community. MeV+R has many advantages, including platform independ-ence, a well-defined modular API, and a point and click GUI that is easy to learn and use. We demonstrate the successful
integration and advantages of three Bioconductor packages (RAMA [15], BRIDGE [16], and iterativeBMA [17]) over exist-ing tools in the MeV environment through case studies. The underlying framework that we used to integrate these Biocon-ductor packages with MeV is easily extensible to other analy-sis tools developed in R. The software, documentation and a tutorial are publicly available from our project home page [18].
Implementation
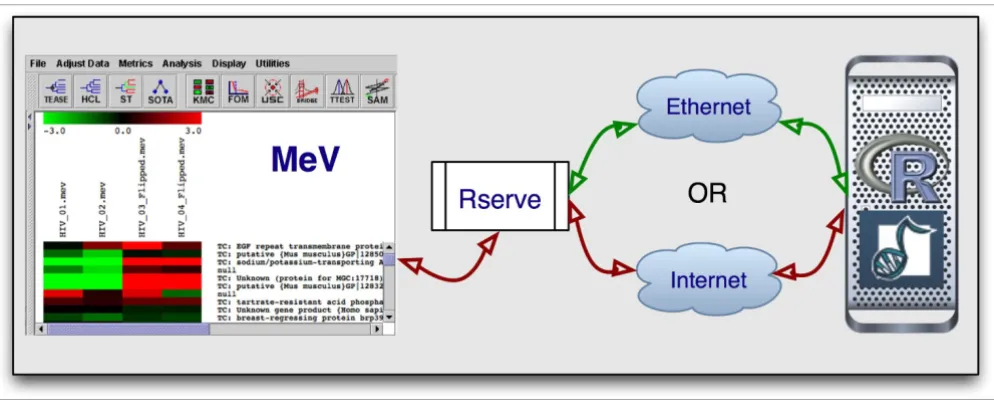
[image:2.612.57.554.498.702.2]Our integration effort is composed of three separate entities (Figure 1). MeV provides the graphical user interface while Rserve serves as the communication layer and R is the lan-guage and environment in which the analysis packages run. Rserve is a TCP/IP server that allows various languages to use the facilities of R without the need to initialize R or link against an R library [19]. In other words, we use R as the back end to run Bioconductor packages through the use of Rserve. Rserve is open source, freely available [20], and licensed under GPL.
As such, Java, Rserve, and R must all be installed on the user's computer, and we provide an automated installer on our project web site. Furthermore, Rserve needs to be running to be used. However, R does not need to be started. Since Rserve works through TCP/IP, it can run on the user's own machine, on an internal network or over the internet. By default, our code assumes Rserve to be running on the local host, but the user can change, add and save additional new hosts using a pull down menu. Once a connection is established, the Java code in MeV converts the user's data from the MeV data structure to the R format and loads it into R. The appropriate
Our integration effort is composed of three separate entities: MeV as the GUI, Rserve as the communication layer, and R as the language and environment in which the analysis packages run
Figure 1
R libraries are loaded followed by the R commands that are necessary to initiate the analysis. Upon completion, the returned data from R are explicitly called back into MeV and presented to the user.
We have incorporated three Bioconductor packages, RAMA [15], BRIDGE [16], and iterativeBMA [17], into MeV to illus-trate the successful MeV+R integration. The Robust Analysis of MicroArray (RAMA) algorithm computes robust estimates of expression intensities from two-color microarray data, which typically consist of a few replicates and potential out-liers [15]. RAMA also takes advantage of dye swap experimen-tal designs. Bayesian Robust Inference for Differential Gene Expression (BRIDGE) is a robust algorithm that selects dif-ferentially expressed genes under different experimental con-ditions on both one- and two-color microarray data [16]. Both RAMA and BRIDGE make use of a computationally intensive technique called Markov Chain Monte Carlo for parameter estimation, and it is non-trivial to re-implement these algo-rithms in Java. Hence, we took advantage of our previous development work by simply using MeV as an interface to the Bioconductor packages. The iterative BMA algorithm is a multivariate gene selection and classification algorithm, which considers multiple genes simultaneously and typically leads to a small number of relevant genes to classify microar-ray data [17]. The iterativeBMA Bioconductor package imple-ments the iterative BMA algorithm as previously described [17] in R, and its implementation is part of our current inte-gration effort. Both RAMA and BRIDGE are included in the latest release of MeV (version 4.1), and iterativeBMA will be included in future releases. The user interfaces, usage and case studies for RAMA, BRIDGE and iterativeBMA are briefly described below. Detailed documentation is included with the software distribution [21] as well as linked in the MeV appli-cation. Help pages are also available as Help Dialogs accessed via buttons on the MeV dialog boxes. Our MeV+R implemen-tation is publicly available and runs on Windows, Mac OS X and Linux.
Integrated Bioconductor packages: description
and user interfaces
RAMA: Robust Analysis of MicroArrays
RAMA uses a Bayesian hierarchical model for the robust esti-mation of cDNA microarray intensities with replicates. This is highly relevant for replicated microarray experiments because even one outlying replicate (such as due to scratches or dust) can have a disastrous effect on the estimated signal intensity. Outliers are modeled explicitly using a t-distribu-tion, which is more robust than the usual Gaussian model. Our model borrows strength from all the genes to decide if a measurement is an outlier, and hence it is better at detecting outliers based on a small number of replicate measurements than other classical robust estimators. Our algorithm uses Markov Chain Monte Carlo for parameter estimation, and addresses classical issues such as design effects,
normaliza-tion, transformanormaliza-tion, and nonconstant variance. Please refer to [15] for a detailed description of the algorithm.
User interface
The user can start RAMA by clicking 'Adjust Data' - 'Replicate Analysis' - 'RAMA' from the MeV main menu. The RAMA dia-log box is then displayed asking the user to label the arrays that were loaded into MeV with their appropriate dye color. At this time, the user is asked to make sure that Rserve is run-ning. On a Win32 system, double clicking Rserve.exe accom-plishes this. On a UNIX or Linux or Mac OS X system, the user issues the command 'R CMD Rserve' at a prompt. By default, RAMA will look on the local machine for an Rserve server. However, since Rserve is a TCP/IP server, the Rserve server can be a remote machine. The user is allowed to adjust a few advanced parameters, though suggested values are given as defaults. If an Rserve connection is successfully made, the location of Rserve is written to the user's MeV con-figuration file and will be available in later sessions. After clicking 'OK', the input data are sent to R. An indeterminate progress bar is displayed while RAMA runs - unfortunately, the architecture of RServe and the R Server do not allow for an accurate indication of the time remaining in an ongoing analysis. Once completed, the user is given a dialog box to save the results. The returned results will then replace the loaded data in a new Multiple Array Viewer (MAV). The old MAV is deleted. The user can then choose to continue using MeV as if the data were loaded through the native loading modules.
BRIDGE: Bayesian Robust Inference for Differential Gene Expression
BRIDGE fits a robust Bayesian hierarchical model to test for differentially expressed genes on microarray data. It can be used with both two-color microarrays and single-channel Affymetrix chips. BRIDGE builds on the previous work of Gottardo et al. [15] by allowing each gene to have a different variance and the detection of differentially expressed genes under multiple (up to three in our current implementation) experimental conditions. Robust inference is accomplished by modeling outliers using a t-distribution, and hence BRIDGE is powerful even with a small number of samples (either biological or technical replicates) under each experi-mental condition. Parameter estimation is carried out using a novel version of Markov Chain Monte Carlo. The current implementation of BRIDGE does not handle missing values. Please refer to [16] for a detailed description of the model.
User interface
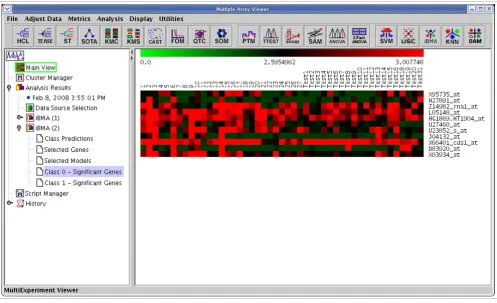
displayed while BRIDGE runs. The results are presented to the user in three formats: heat maps, expression graphs or tables. In each format, the genes for which there is strong evi-dence of differential expression are identified as 'Significant Genes', defined by the posterior probability being above 0.5.
IterativeBMA: Iterative Bayesian Model Averaging The iterativeBMA algorithm is a multivariate technique for gene selection and classification of microarray data. Bayesian Model Averaging (BMA) takes model uncertainty into consid-eration by averaging over the predicted probabilities based on multiple models, weighted by their posterior model probabil-ities [22]. The most commonly used BMA algorithm is limited to data in which the number of variables is greater than the number of responses, and the algorithm is inefficient for datasets containing more than 30 genes (variables). In the case of classifying samples using microarray data, there are typically thousands or tens of thousands of genes (variables) under a few dozen samples (responses). In the iterative BMA algorithm, we start by ranking the genes using the ratio of between-group to within-group sum of squares (BSS/WSS) [23]. In this initial preprocessing step, genes with large BSS/ WSS ratios (that is, genes with relatively large variation between classes and relatively small variation within classes) receive high rankings. We then apply the traditional BMA algorithm to the 30 top ranked genes, and remove genes with low posterior probabilities. Genes from the rank ordered BSS/WSS ratios are then added to the set of genes to replace genes with low probabilities. These steps of gene swaps and iterative applications of BMA are repeated until all genes are subsequently considered. We have previously shown that the iterative BMA algorithm selects small numbers of relevant genes, achieves high prediction accuracy, and produces pos-terior probabilities for the predictions, selected genes and models [17].
The iterativeBMA Bioconductor package implements the iter-ative BMA algorithm described in Yeung et al. [17] (previ-ously implemented in Splus) when there are two classes. It is part of the original work for this publication. The user docu-mentation (vignette) is included in the package.
User interface
We have integrated the iterativeBMA Bioconductor package in MeV. IterativeBMA starts after the user clicks on the 'iBMA' icon on top of the MeV window. The current imple-mentation of the iterativeBMA Bioconductor package is lim-ited to only two classes. After loading the data, the user is asked to label the two classes. The default labels for the two classes are 0 and 1, respectively. In the same dialog box, the user is asked to establish an Rserve connection. The user is also given the option of specifying advanced parameters for the analysis. The next dialog box asks the user to assign labels to each of the samples in the data, either by using a pull-down menu or loading an assignment file. At this point, if Rserve is not already running, the user is reminded to start the
connec-tion. Then, the data and the parameters are sent to R, and a progress bar is shown warning the user that the computation could take a long time. After the iterativeBMA Bioconductor package finishes running, the following analysis results are displayed: the predicted probability and class for each test sample; the posterior probabilities of the selected genes sorted in descending order; the posterior probabilities of the selected models sorted in descending order; and the heat-maps of the selected genes in both classes.
Case studies illustrating the merits of the
integrated Bioconductor packages
In this section, we compare the performance of the integrated Bioconductor packages (RAMA, BRIDGE and iterativeBMA) to existing tools in MeV in order to illustrate the merits of the integrated packages. In addition, we demonstrate that our MeV+R modules can be used together with other MeV mod-ules in the integrated analysis of microarray data, hence, extending the capabilities of MeV.
RAMA: Robust Analysis of MicroArrays
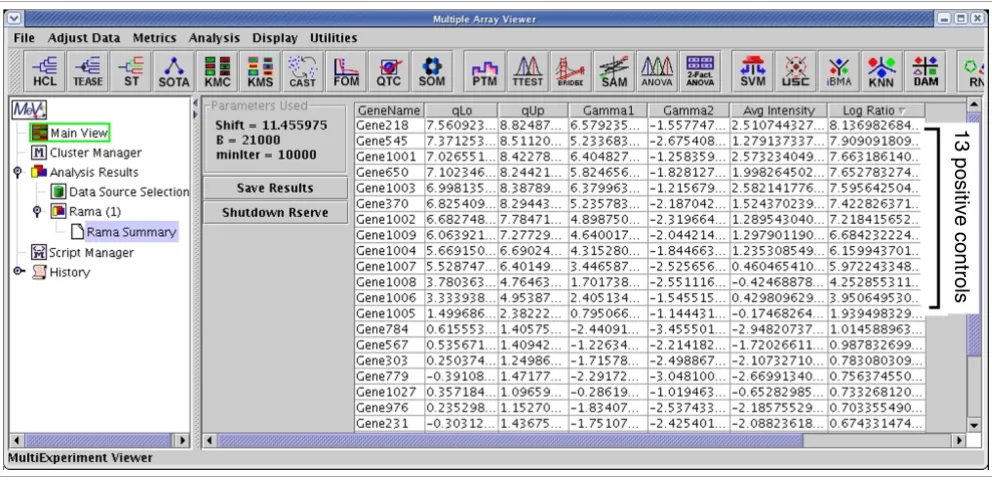
We compared the microarray gene intensities estimated using RAMA to that of the log ratios over intensities averaged over all the replicates on two microarray datasets and the results are summarized in Table 1. The first dataset is a subset of the HIV data [24] consisting of the expression levels of 1,028 transcripts, including 13 positive controls and 24 nega-tive controls, in CD4-T-cell lines at time t = 1 hour after infec-tion with HIV virus type 1 hybridized to two-color cDNA arrays. The experimental design consists of four technical replicates and balanced dye swap in which two of the four rep-licates were hybridized with Cy3 for the control and Cy5 for the treatment and then the dyes were reversed on the other two replicates. The second dataset is a subset of the like and like data [15] consisting of 1,000 genes over four experiments using the same RNA preparation isolated from a HeLa cell line on four different microarray slides. Since the same RNA was used in both channels, no genes from these data should show any differential expression. Both sample datasets are available on our project web site and are included as part of our MeV+R package release.
log ratios greater than one. Please refer to the supplementary material [18] for the details of our case studies. To summa-rize, RAMA produced the desired results on both datasets while the averaged log ratio produced three and six false pos-itives, respectively, on these two datasets.
BRIDGE: Bayesian Robust Inference for Differential Gene Expression
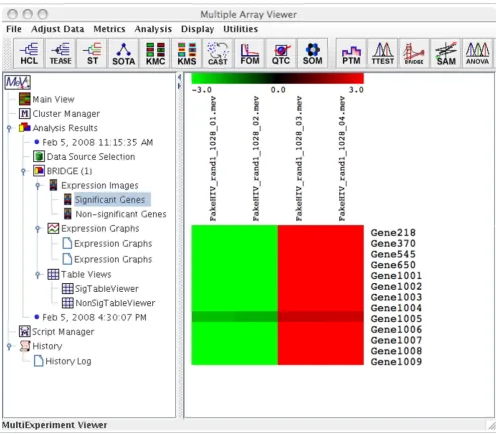
We compared the differentially expressed genes identified using BRIDGE, t-test and SAM (Significance Analysis of Microarrays) [25] as implemented in MeV on two datasets. Applying BRIDGE to the HIV data described in the previous section identified all 13 positive controls as 'significant' genes (Figure 3). On the other hand, applying the one-sample t-test as implemented in MeV to the same HIV data identified a total of 14 significant genes, including all 13 positive controls and one negative control using a p-value cut-off of 0.01
with-out any Bonferroni correction. Using a p-value cut-off of 0.05 and standard Bonferroni correction, the one-sample t-test identified only one significant gene (which is one of the 13 positive controls) and incorrectly assigned the remaining 12 positive controls as 'insignificant'. Similarly, using one-sam-ple SAM as imone-sam-plemented in MeV identified 12 out of 13 posi-tive controls using default parameters.
[image:5.612.52.557.113.210.2]The second dataset we used comprises the Affymetrix U133 spike-in data [26], which consists of three technical replicates of 14 separate hybridizations of 42 spiked transcripts in a complex human background at varying concentrations. Thirty of the spikes are isolated from a human cell line, four spikes are bacterial controls, and eight spikes are artificially engineered sequences believed to be unique in the human genome. The data were preprocessed using GCRMA [27], Table 1
Comparing the results of RAMA to the averaged log ratios on the HIV data and the like and like data
Data Benchmark RAMA Averaged log ratio
HIV data 13 positive controls All 13 positive controls have log ratios >1
All 13 positive controls have log ratios >1
24 negative controls All 24 negative controls have log ratios <1
3 negative controls have log ratios >1
Like and like data No genes expected to be differentially expressed
All log ratios <1 6 genes with log ratios >1
RAMA produced the desired results on both datasets while the averaged log ratio produced three and six false positives, respectively, on these two datasets.
The results of applying RAMA to the HIV data Figure 2
The results of applying RAMA to the HIV data. The log ratios computed from RAMA are sorted in descending order, and the top 13 genes with log ratios greater than one are the positive controls.
[image:5.612.57.553.458.698.2]resulting in a dataset of 22,300 genes across 42 samples. In addition to the original 42 spiked-in genes, we included an additional 20 genes that consistently showed significant dif-ferential expression across the array groups and an additional three genes containing probe sequences exactly matching those for the spiked-in genes [28,29]. As a result, our expanded spiked-in gene list contains 65 entries in total. We used a subset of this spiked-in data consisting of 1,059 genes that include all 65 spiked-in genes across two samples in triplicate. In our comparison, only the 65 spiked-in genes should be identified as differentially expressed.
BRIDGE identified 45 differentially expressed genes on this data subset. All of these 45 genes identified by BRIDGE are spiked-in genes. On the other hand, the t-test with a p-value
cut-off of 0.01 without any correction for multiple compari-son identified a total of 33 significant genes, of which 31 were spiked-in genes. Using a p-value cut-off of 0.05 and the standard Bonferroni correction, the t-test identified only four significant genes (which are among the spiked-in genes). SAM identified eight spiked-in genes as differentially expressed.
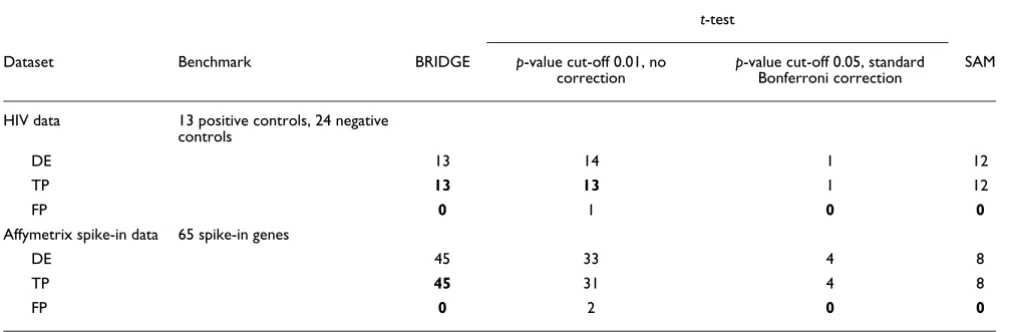
Our comparison results are summarized in Table 2. We have shown that BRIDGE is the only tool that successfully identi-fied all 13 positive controls as 'significant' on the HIV data. In addition, BRIDGE identified the highest number of true pos-itives (spiked-in genes) without any false pospos-itives on the Affymetrix spike-in data.
[image:6.612.56.552.84.518.2]The significant genes identified by applying BRIDGE to the HIV data Figure 3
IterativeBMA: Iterative Bayesian Model Averaging We compared the performance of iterativeBMA (abbreviated as iBMA in our MeV+R implementation) to KNN (k-nearest neighbor) [30] and USC (Uncorrelated Shrunken Centroid) [31] implemented in MeV using the well-studied leukemia data [32]. We used the filtered leukemia dataset, which con-sists of 3,051 genes, 38 samples in the training data and 34 samples in the test set. The data consist of samples from patients with either acute lymphoblastic leukemia (ALL) or acute myeloid leukemia (AML). On the leukemia data, itera-tiveBMA produced 2 classification errors using 11 selected genes over 11 models (Figures 4 and 5). On the other hand, KNN does not have a gene selection procedure and produced 2 classification errors using all 3,051 genes. Similarly, USC produced 2 classification errors using 51 selected genes.
The second dataset we used is the breast cancer prognosis dataset [33], which consists of 4,919 genes with 76 samples in the training set, and 19 samples in the test set [17]. The patient samples are divided into two categories: the good prognosis group (patients who remained disease free for at least five years) and the poor prognosis group (patients who developed distant metastases within five years). The itera-tiveBMA algorithm produced three classification errors using four genes averaged over three models. On the other hand, KNN does not have a gene selection procedure and produced five classification errors using all genes. Similarly, USC pro-duced four classification errors using 662 genes.
Our results are summarized in Table 3. On the breast cancer prognosis data, iterativeBMA produced higher prediction accuracy using much fewer genes. On the leukaemia data, iterativeBMA produced comparable prediction accuracy using much fewer genes.
Using other MeV modules in an integrated data analysis
The previous sub-sections showed that our MeV+R modules achieved superior performance when compared to other existing tools implemented in MeV. Here we demonstrate how the R packages that we incorporated into MeV can be used in combination with other existing tools in MeV. This illustrates the fact that the MeV+R framework has extended the capabilities of MeV, and that using these R packages through the MeV GUI adds value to the integrated analysis of microarray data.
In this case study, we will follow-up on the results from apply-ing the iterativeBMA algorithm to the leukemia data [32]. The iterativeBMA algorithm is a multivariate gene selection method designed to select a small set of predictive genes for the classification of microarray data. In the case of the leuke-mia data, the iterativeBMA algorithm selected 11 genes that produced two classification errors on the 34-sample test set. It would be interesting to identify the biological theme in this 11-gene list. Towards this end, we applied EASE [13] as imple-mented in MeV to determine the over-represented Gene Ontology categories in this gene list relative to all the genes on the microarray. Figure 6 shows the tabular view from the EASE analysis.
[image:7.612.53.560.122.288.2]Since iterativeBMA identifies a small set of predictive genes for classification, other genes that exhibit similar expression patterns to the selected genes are likely of biological interest. For example, we would like to explore the gene with the high-est posterior probability 'X95735_at' from the iterativeBMA analysis on the leukemia data [32]. We applied PTM (Tem-plate Matching) [34] as implemented in MeV to identify genes that are highly correlated with 'X95735_at'. Using a p-value threshold of 0.0001, PTM identified 209 genes that are highly Table 2
Comparing the results of BRIDGE to t-test and SAM on the HIV data and the Affymetrix spike-in data t-test
Dataset Benchmark BRIDGE p-value cut-off 0.01, no
correction
p-value cut-off 0.05, standard Bonferroni correction
SAM
HIV data 13 positive controls, 24 negative controls
DE 13 14 1 12
TP 13 13 1 12
FP 0 1 0 0
Affymetrix spike-in data 65 spike-in genes
DE 45 33 4 8
TP 45 31 4 8
FP 0 2 0 0
correlated with 'X95735_at'. Our next task was to find the biological theme among these 209 genes, so we applied EASE and TEASE (Tree-EASE). TEASE is a combined analytical tool for hierarchical clustering and EASE. TEASE computes the dendrogram using the hierarchical clustering method and displays the significantly enriched Gene Ontology categories for each subtree in the dendrogram. Please refer to the sup-plementary materials [18] for the details of our case studies.
Incorporating additional R packages
We have developed a framework with built-in functions for the integration of Bioconductor packages into MeV. Detailed documentation of these built-in functions is provided on our project web site for software developers. Using this frame-work, we have integrated three Bioconductor packages (RAMA, BRIDGE and iterativeBMA) into MeV as proof of concept. To integrate additional Bioconductor packages into MeV, a software developer can simply call our built-in func-tions except for complex and non-standard data views.
Conclusion
MeV+R is a convenient platform to provide biologists with point and click GUI access to Bioconductor packages. We
have demonstrated the successful integration of Bioconduc-tor and MeV through three BioconducBioconduc-tor packages, RAMA, BRIDGE and iterativeBM, and that the incorporated Biocon-ductor packages produced superior results in the analysis of microarray data compared to existing tools in MeV. Addi-tional Bioconductor packages are straightforward to add: the framework for moving data from MeV to R and back is gener-alized for code re-use, and each new package will merely require the development of a GUI for input and output.
Abbreviations
[image:8.612.57.554.86.389.2]API, application programming interface; BMA, Bayesian Model Averaging; BRIDGE, Bayesian Robust Inference for Differential Gene Expression; BSS/WSS, ratio of between-group to within-between-group sum of squares; EASE, Expression Analysis Systematic Explorer; GUI, graphical user interface; iterativeBMA, iterative Bayesian Model Averaging; KNN, k-nearest neighbor; MAV, Multiple Array Viewer; MeV, Multi-Experiment Viewer; PTM, Template Matching; RAMA, Robust Analysis of MicroArray; SAM, Significance Analysis of Microarrays; USC, Uncorrelated Shrunken Centroid. The results of applying iterativeBMA to the leukemia data
Figure 4
Authors' contributions
VC carried out the software implementation, and drafted part of the initial manuscript. RG and AER designed and wrote the Bioconductor packages RAMA and BRIDGE, and assisted in incorporating these packages into MeV. REB conceived of the study, and designed and coordinated the project. KYY partic-ipated in the design and coordination of the study, wrote the iterativeBMA Bioconductor package, carried out the case studies and prepared the manuscript. All authors read and approved the final manuscript.
Acknowledgements
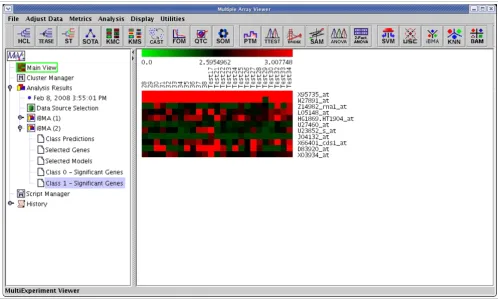
[image:9.612.55.553.86.385.2]We would like to give special thanks to Dr John Quakenbush and his research group for the original development of MeV and for insightful discussions related to this work. We would also like to thank Drs Chris Volinsky and Ian Painter for their help on the development of the itera-tiveBMA Bioconductor package. We would also like to thank Dr Renee Ire-ton for editing the manuscript. VTC is supported by NIH-NCI grant K25CA106988 and 5R01HL072370. RG's research is supported by the Natural Sciences and Engineering Research Council of Canada. AER's research was supported by NICHD grant R01 HD054511, NIH grant 8 R01 The results of applying iterativeBMA to the leukemia data
Figure 5
The results of applying iterativeBMA to the leukemia data. A heatmap showing the selected genes from iterativeBMA under the training samples labeled as class 1 and the test samples assigned to class 1 by the algorithm.
Table 3
Comparing the results of iterativeBMA to KNN and USC on the leukemia data and the breast cancer prognosis data
Data Size of data iterativeBMA KNN USC
Leukemia data [32] 38 training samples 11 genes 3,051 genes 51 genes 34 test samples 2 errors 2 errors 2 errors Breast cancer prognosis data [33] 76 training samples 4 genes 4,919 genes 662 genes
19 test samples 3 errors 5 errors 4 errors
[image:9.612.50.552.619.694.2]EB002137-02, NSF grant ATM 0724721 and ONR grant N00014-01-10745. REB is funded by NIH-NIAID grants 5P01 AI052106-02, 1R21AI052028-01 and 1U54AI057141-01, NIH-NIEHA grant 1U19ES011387-02, NIH-NHLBI grants 5R01HL072370-02 and 1P50HL073996-01. KYY is supported by NIH-NCI grant K25CA106988.
References
1. Gentleman RC, Carey VJ, Bates DM, Bolstad B, Dettling M, Dudoit S, Ellis B, Gautier L, Ge Y, Gentry J, Hornik K, Hothorn T, Huber W, Iacus S, Irizarry R, Leisch F, Li C, Maechler M, Rossini AJ, Sawitzki G, Smith C, Smyth G, Tierney L, Yang JY, Zhang J: Bioconductor: open software development for computational biology and bioinformatics. Genome Biol 2004, 5:R80.
2. The Bioconductor Project [http://www.bioconductor.org] 3. Ihaka R, Gentleman RC: R: a language for data analysis and
graphics. J Computational Graphical Stat 1996, 5:299-314.
4. The R Project for Statistical Computing [http://www.r-project.org]
5. Dalgaard P: The R-Tcl/Tk interface. Proceedings of the Second Inter-national Workshop on Distributed Statistical Computing: 15-17 March 2001; Vienna, Austria. [http://www.ci.tuwien.ac.at/Conferences/DSC-2001/Proceedings/Dalgaard.pdf].
6. Fox J: The R commander: a basic-statistics graphical user interface to R. J Stat Software 2005, 14: [http://www.jstatsoft.org/ v14/i09/paper].
7. Grosjean P: SciViews: an object-oriented abstraction layer to design GUIs on top of various calculation kernels. Proceedings of the Third International Workshop on Distributed Statistical Computing:
20-22 March 2003; Vienna, Austria. [http://www.ci.tuwien.ac.at/Con ferences/DSC-2003/Proceedings/Grosjean.pdf].
8. Wettenhall JM, Smyth GK: limmaGUI: a graphical user interface for linear modeling of microarray data. Bioinformatics 2004, 20:3705-3706.
9. Wettenhall JM, Simpson KM, Satterley K, Smyth GK: affylmGUI: a graphical user interface for linear modeling of single channel microarray data. Bioinformatics 2006, 22:897-899.
10. Futschik ME, Crompton T: OLIN: optimized normalization, vis-ualization and quality testing of two-channel microarray data. Bioinformatics 2005, 21:1724-1726.
11. Saeed AI, Sharov V, White J, Li J, Liang W, Bhagabati N, Braisted J, Klapa M, Currier T, Thiagarajan M, Sturn A, Snuffin M, Rezantsev A, Popov D, Ryltsov A, Kostukovich E, Borisovsky I, Liu Z, Vinsavich A, Trush V, Quackenbush J: TM4: a free, open-source system for microarray data management and analysis. Biotechniques 2003, 34:374-378.
12. Eisen MB, Spellman PT, Brown PO, Botstein D: Cluster analysis and display of genome-wide expression patterns. Proc Natl Acad Sci USA 1998, 95:14863-14868.
13. Hosack DA, Dennis G Jr, Sherman BT, Lane HC, Lempicki RA: Iden-tifying biological themes within lists of genes with EASE. Genome Biol 2003, 4:R70.
14. SourceForge.net [http://www.sourceforge.net/projects/mev-tm4] 15. Gottardo R, Raftery AE, Yeung KY, Bumgarner RE: Quality control and robust estimation for cDNA microarrays with replicates. J Am Stat Assoc 2006, 101:30-40.
[image:10.612.56.554.88.436.2]16. Gottardo R, Raftery AE, Yeung KY, Bumgarner RE: Bayesian robust inference for differential gene expression in cDNA microar-rays with multiple samples. Biometrics 2006, 62:10-18. The results of applying EASE to the 11 genes selected by iterativeBMA on the leukemia data
Figure 6
17. Yeung KY, Bumgarner RE, Raftery AE: Bayesian model averaging: development of an improved multi-class, gene selection and classification tool for microarray data. Bioinformatics 2005, 21:2394-2402.
18. MeV+R Supplementary Web Site [http://expression.washing ton.edu/mevr]
19. Urbanek S: Rserve - a fast way to provide R functionality to applications. Proceedings of the Third International Workshop on Dis-tributed Statistical Computing: 20-22 March 2003; Vienna, Austria. [http:/ /www.ci.tuwien.ac.at/Conferences/DSC-2003/Proceedings/ Urbanek.pdf].
20. Rserve [http://stats.math.uni-augsburg.de/Rserve] 21. MeV Manual [http://www.tm4.org/mev.html]
22. Raftery AE: Bayesian model selection in social research (with discussion). Sociol Methodol 1995, 25:111-196.
23. Dudoit S, Fridlyand J, Speed TP: Comparison of discrimination methods for the classification of tumors using gene expres-sion data. J Am Stat Assoc 2002, 97:77-87.
24. van 't Wout AB, Lehrman GK, Mikheeva SA, O'Keeffe GC, Katze MG, Bumgarner RE, Geiss GK, Mullins JI: Cellular gene expression upon human immunodeficiency virus type 1 infection of CD4(+)-T-cell lines. J Virol 2003, 77:1392-1402.
25. Tusher VG, Tibshirani R, Chu G: Significance analysis of micro-arrays applied to the ionizing radiation response. Proc Natl Acad Sci USA 2001, 98:5116-5121.
26. Affymetrix U133 Spike-in Data [http://www.affymetrix.com/ support/technical/sample_data/datasets.affx]
27. Irizarry RA, Bolstad BM, Collin F, Cope LM, Hobbs B, Speed TP: Summaries of Affymetrix GeneChip probe level data. Nucleic Acids Res 2003, 31:e15.
28. Sheffler W, Upfal E, Sedivy J, Noble WS: A learned comparative expression measure for affymetrix genechip DNA microarrays. Proc IEEE Comput Syst Bioinform Conf 2005:144-154. 29. Lo K, Gottardo R: Flexible empirical Bayes models for
differ-ential gene expression. Bioinformatics 2007, 23:328-335. 30. Theilhaber J, Connolly T, Roman-Roman S, Bushnell S, Jackson A, Call
K, Garcia T, Baron R: Finding genes in the C2C12 osteogenic pathway by k-nearest-neighbor classification of expression data. Genome Res 2002, 12:165-176.
31. Yeung KY, Bumgarner RE: Multiclass classification of microarray data with repeated measurements: application to cancer. Genome Biol 2003, 4:R83.
32. Golub TR, Slonim DK, Tamayo P, Huard C, Gaasenbeek M, Mesirov JP, Coller H, Loh ML, Downing JR, Caligiuri MA, Bloomfield CD, Lander ES: Molecular classification of cancer: class discovery and class prediction by gene expression monitoring. Science 1999, 286:531-537.
33. van 't Veer LJ, Dai H, Vijver MJ van de, He YD, Hart AA, Mao M, Peterse HL, Kooy K van der, Marton MJ, Witteveen AT, Schreiber GJ, Kerkhoven RM, Roberts C, Linsley PS, Bernards R, Friend SH: Gene expression profiling predicts clinical outcome of breast cancer. Nature 2002, 415:530-536.