International Journal of Emerging Technology and Advanced Engineering
Website: www.ijetae.com (ISSN 2250-2459, ISO 9001:2008 Certified Journal, Volume 7, Issue 6, June 2017)
202
Parameters Optimization in the Experimental Wear Study on
ADI at Elevated Temperature
Rajendra M. Galagali
1, Dr. R. G. Tikotkar
21Asst. Professor, Department of Mechanical Engineering, Jain College of Engineering, Belagavi, affiliated to Visvesvaraya
Technological University, Belagavi , Karnataka, India
2Professor, Department of Mechanical Engineering, B.L.D.E.A’s V.P. Dr. P.G. Halakatti College of Engineering & Technology,
Vijaypur, Karnataka, India
Abstract—The progression in today's innovation requires the use of unrivaled material. Austempered Ductile Iron (ADI) is one such promising material offering better combination of strength and ductility. The present study investigates the influence of applied load, sliding speed and temperature on wear rate of ADI austenitised at 870°C for
120 min. and austempered for 180 mins. at 380°C. The dry sliding wear tests were performed with DUCOM pin-on-disc
machine. The experiments were conducted for a constant sliding distance of 2500 m. The chosen parameters impact on the wear rate was examined by Taguchi's technique utilizing Design of Experiments. For the examination of information an
L9 orthogonal array was chosen. S/N ratio and ANOVA
decided positioning and rate impact of parameters on wear rate. Results show that load is the highest influencing parameter followed by temperature and sliding speed. Worn out wear surfaces were analyzed using scanning electron microscope.
Keywords—Austempered Ductile Iron, Load, Elevated temperature, Optimization, Speed, Wear behaviour
I. INTRODUCTION
Currently there is a great deal of interest in the wear of metals and materials throughout the world. Superior wear resistant materials with low friction coefficients are being investigated for a range of applications. Nowadays metals or alloys possessing light weight, good mechanical and tribological properties with lower costs have great demand. This resulted in the development of one of the high strength materials know as Austempred Ductile Iron (ADI). The materials holds superior ductility, fatigue resistance, toughness, hardness and wear resistance properties. It is 10% light in weight with 20% less production cost when contrasted with steel. Worldwide market segments for ADI include: heavy vehicle, light vehicle, construction, agriculture, railroad, mining and miscellaneous industrial applications.
International Journal of Emerging Technology and Advanced Engineering
Website: www.ijetae.com (ISSN 2250-2459, ISO 9001:2008 Certified Journal, Volume 7, Issue 6, June 2017)
203
ADI is a promising material to be utilized under wear conditions and accordingly it is generally utilized as a part of utilizations, for example, gears, pinions, crankshafts, affect plates, jaw crusher segments, hammers, excavator teeth, bores and rolls, horticultural actualizes and vehicle and motor parts large portions of these parts are subjected to rubbing and wear, which makes this iron exceptionally fascinating from the tribological conduct perspective [11-13]. The sliding wear behaviour of ADI, has been studied by several researchers; according to Haseeb et al. [11], the wear resistance under dry sliding conditions of ADI is superior to a quenched and tempered steel with the same hardness level. Uma et al. [12], also under dry sliding conditions by using pin-on-disk machine, have reported that the wear loss is related to the original hardness (before the wear test) but also suggested that the strain hardening of austenite provides significant improvement in wear resistance. In addition, Asiabi et al. [14] have highlighted that the maximum wear resistance in these irons is observed when the retained austenite is maximum and also when the tempering temperature is low.
There have been numerous one of a kind procedures in this day and age to draw out the streamlined outcome on each investigation and examination. One such is the Taguchi's Technique which is broadly utilized as a part of the field of wear investigation to concentrate the wear conduct materials. The tribological conduct of glass epoxy polymer composites with silicon carbide and graphite particles, as auxiliary fillers, was considered utilizing a pin‐on‐disc wear analyzer under dry sliding conditions [15]. The works carried out on simultaneous optimization of multiple quality characteristics by fuzzy logic and Taguchi’s technique have proven to be a successful and easy method [16]. Apte et al. [17] optimized Electrical Discharge Machining process parameters using Taguchi method. Radhika et al. [18] studied the influence of various parameters such as load, sliding speed and temperature on the dry sliding wear behaviour of AlSi10Mg alloy reinforced with 3 wt% graphite and 9 wt% alumina fabricated through liquid metallurgy route.
In light of the above writing, to enhance the dry sliding wear resistance for the applications expressed above and to deliver better contrasting option to different metals particularly for cast press made car segments where light weight and wear resistance was under real thought, ADI was created for wear consider. It was solutionenized at 870°C for 120 minutes and austempered at 380°C for 180 minutes. The dry sliding wear examinations were directed in view of the arrangement produced by Taguchi strategy.
The impact of different parameters on the wear rate was examined utilizing Signal‐to‐Noise (S/N) proportion and Analysis of Variance (ANOVA).
II. TAGUCHI TECHNIQUE
Design of Experiments (DOE) was employed for analyzing the impact of assorted input parameters on a given output. DOE approach makes use of Taguchi technique to find the optimal blend of parameters for a given set of response [19]. It provides an optimized depiction to improve the performance, efficiency and cost. This method was utilized for assessing frameworks in view of orthogonal arrays. The method was largely used because of its ability to examine and interpret data based on the responses. A typical orthogonal array was chosen based on the number of parameters, and the consequence of parameters on the target value. The dissimilarities were identified by means of a signal to‐ noise ratio. This S/N ratio provides the effect of noise on various characteristics. ANOVA was used to establish the percentage of control of various parameters on the response [20]. It was a quantitative measurement to decide the contribution of each parameter on the rejoinder.
III. EXPERIMENTAL DETAILS
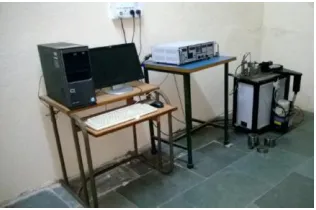
[image:2.612.366.524.563.668.2]The dry sliding wear test was led on a pin‐on‐disc analyzer as appeared in fig. 1. Size of the specimen used for the wear test was of 30 mm in length and 10 mm in diameter. They were machined and polished as per ASTM standards. The experiment was performed by holding the pin against a turning disc (EN32 steel) and by adding weights on the left arm of the machinery. The track diameter of 120mm and sliding distance of 2500m were chosen for study. The experiment was then accomplished by differing the applied load, temperature and sliding speed for three levels as shown in Table 1.
International Journal of Emerging Technology and Advanced Engineering
Website: www.ijetae.com (ISSN 2250-2459, ISO 9001:2008 Certified Journal, Volume 7, Issue 6, June 2017)
[image:3.612.62.276.155.231.2]204 Table 1.
Parameters and their levels
Level Load
[N]
Sliding speed [m/s]
Temperature [°C] 1
2 3
9.81 19.62 29.43
1.75 3.25 5.50
100 150 200
IV. PLAN OF EXPERIMENTS
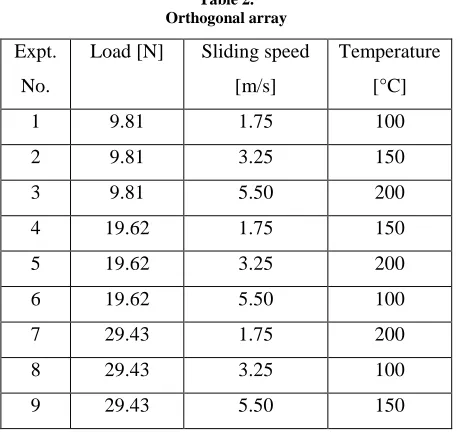
[image:3.612.55.285.317.535.2]Experiments were carried out by considering these three parameters by varying them for three levels. The degree of freedom for an orthogonal array was chosen as 9, based on the tenet that it should be greater than the wear parameters considered (Table 2).
Table 2. Orthogonal array
Expt.
No.
Load [N] Sliding speed
[m/s]
Temperature
[°C]
1 9.81 1.75 100
2 9.81 3.25 150
3 9.81 5.50 200
4 19.62 1.75 150
5 19.62 3.25 200
6 19.62 5.50 100
7 29.43 1.75 200
8 29.43 3.25 100
9 29.43 5.50 150
The grouping for the cluster relies upon the quantity of components drew in, levels and their responses. The primary segment was taken as the load, the second as the sliding speed and third temperature. The S/N ratio combines all multiple data and approximates them based on the characteristics of the data.
The S/N ratio was by and large grouped into three sorts: "smaller the better", larger the better" and "normal the best". ―Smaller the better‖ characteristic of S/N ratio was deemed for minimum wear rate and is given by:
n
η = -1log10{Σyi2}---(1) n i=1
Where y1, y2…yn were the response and n is the number of observations. ANOVA was performed to determine the percentage effect of each parameter.
V. RESULTS AND DISCUSSION
The control parameters were analyzed using Minitab software, especially intended for this purpose. S/N ratio and ANOVA were calculated.
A. Analysis using S/N ratio
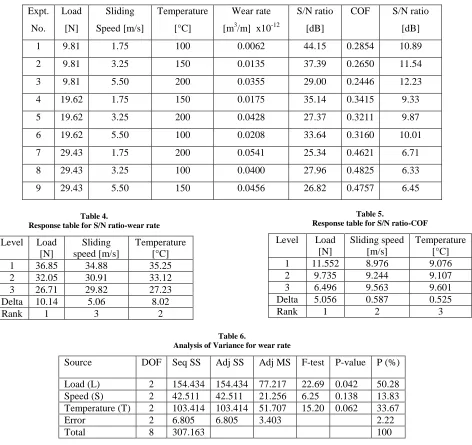
Experiments were performed according to the orthogonal array and the observed values of wear rate are shown in Table 3. The influence of control parameters on wear rate were found using S/N ratio. The parameter with the highest S/N ratio gives minimum wear rate. The response table for S/N ratio is shown in Table 4. The contrast between the greatest and least estimations of S/N ratio gives delta. Positioning of parameter were finished by the delta esteem. The parameter with the largest value of delta has the greatest influence on wear rate [21]. From Table 4, it was found that load has the significant impact on wear rate followed by temperature and sliding speed.
International Journal of Emerging Technology and Advanced Engineering
Website: www.ijetae.com (ISSN 2250-2459, ISO 9001:2008 Certified Journal, Volume 7, Issue 6, June 2017)
205 Table 3.
Orthogonal array of Taguchi for wear rate and experimental results
Expt.
No.
Load
[N]
Sliding
Speed [m/s]
Temperature
[°C]
Wear rate
[m3/m] x10-12
S/N ratio
[dB]
COF S/N ratio
[dB]
1 9.81 1.75 100 0.0062 44.15 0.2854 10.89
2 9.81 3.25 150 0.0135 37.39 0.2650 11.54
3 9.81 5.50 200 0.0355 29.00 0.2446 12.23
4 19.62 1.75 150 0.0175 35.14 0.3415 9.33
5 19.62 3.25 200 0.0428 27.37 0.3211 9.87
6 19.62 5.50 100 0.0208 33.64 0.3160 10.01
7 29.43 1.75 200 0.0541 25.34 0.4621 6.71
8 29.43 3.25 100 0.0400 27.96 0.4825 6.33
9 29.43 5.50 150 0.0456 26.82 0.4757 6.45
Table 4.
Response table for S/N ratio-wear rate
Level Load
[N]
Sliding speed [m/s]
Temperature [°C]
1 36.85 34.88 35.25
2 32.05 30.91 33.12
3 26.71 29.82 27.23
Delta 10.14 5.06 8.02
[image:4.612.74.546.154.599.2]Rank 1 3 2
Table 5.
Response table for S/N ratio-COF
Level Load
[N]
Sliding speed [m/s]
Temperature [°C]
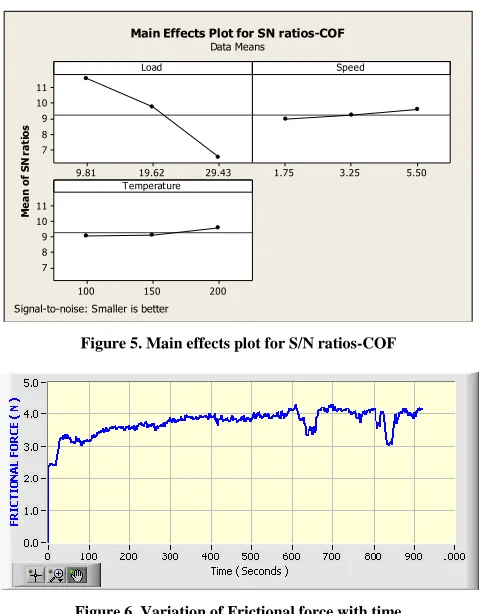
1 11.552 8.976 9.076
2 9.735 9.244 9.107
3 6.496 9.563 9.601
Delta 5.056 0.587 0.525
Rank 1 2 3
Table 6.
Analysis of Variance for wear rate
Source DOF Seq SS Adj SS Adj MS F-test P-value P (%)
Load (L) 2 154.434 154.434 77.217 22.69 0.042 50.28
Speed (S) 2 42.511 42.511 21.256 6.25 0.138 13.83
Temperature (T) 2 103.414 103.414 51.707 15.20 0.062 33.67
Error 2 6.805 6.805 3.403 2.22
Total 8 307.163 100
International Journal of Emerging Technology and Advanced Engineering
Website: www.ijetae.com (ISSN 2250-2459, ISO 9001:2008 Certified Journal, Volume 7, Issue 6, June 2017)
[image:5.612.132.487.157.243.2]206 Table 7.
Analysis of Variance for COF
Source DOF Seq SS Adj SS Adj MS F-test P-value P (%)
Load (L) 2 39.3568 39.3568 19.6784 213.24 0.005 96.98
Speed (S) 2 0.5186 0.5186 0.2593 2.81 0.262 1.28
Temperature (T) 2 0.5212 0.5212 0.2606 2.82 0.262 1.27
Error 2 0.1846 0.1846 0.0923 0.45
Total 8 40.5812 100
(Notes: DF, Degrees of freedom; Seq SS, Sequential sum of squares; Adj SS, Adjusted sum of squares; Adj MS, Adjusted mean squares; P, Percentage of contribution.) R-Sq = 96.10% R-Sq(adj) = 84.40%.
Wear rate (m3/m)=(-0.0373+0.00144*L+0.00204*S+0.000218*T)10-12--(2) COF = 0.191+0.0106*L-0.00469*S-0.000187*T ---(3)
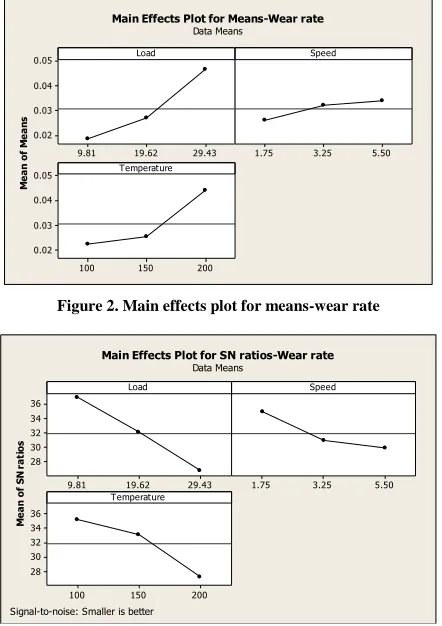
The main effects plot for S/N ratio was shown in Fig. 3. The input process parameter value which has the highest S/N ratio gives the optimum wear rate. From the Figure, it was found that L=9.81 N, S=1.75 m/s and T=100 °C gives the optimum condition. Figure 6 depicts the variation of frictional force with time.
29.43 19.62 9.81 0.05 0.04 0.03 0.02 5.50 3.25 1.75 200 150 100 0.05 0.04 0.03 0.02 Load M e a n o f M e a n s Speed Temperature
[image:5.612.59.280.379.692.2]Main Effects Plot for Means-Wear rate Data Means
Figure 2. Main effects plot for means-wear rate
29.43 19.62 9.81 36 34 32 30 28 5.50 3.25 1.75 200 150 100 36 34 32 30 28 Load M e a n o f S N r a ti o s Speed Temperature
Main Effects Plot for SN ratios-Wear rate Data Means
Signal-to-noise: Smaller is better
Figure 3. Main effects plot for S/N ratios-wear rate
B. Analysis of Variance
ANOVA was exercised to analyze the influence of control parameters like applied load, sliding speed and temperature on wear rate. The investigation was performed for a level of significance, α=0.05. The ANOVA for wear rate is shown in Table 6. The last column in the table indicates the percentage involvement of each input process parameter on the wear rate. It shows that load (50.28 %) has the greatest contribution on wear rate followed by temperature (33.67 %) and sliding speed (13.83 %).
29.43 19.62 9.81 0.50 0.45 0.40 0.35 0.30 5.50 3.25 1.75 200 150 100 0.50 0.45 0.40 0.35 0.30 Load M e a n o f M e a n s Speed Temperature
[image:5.612.328.561.426.581.2]Main Effects Plot for Means-COF Data Means
International Journal of Emerging Technology and Advanced Engineering
Website: www.ijetae.com (ISSN 2250-2459, ISO 9001:2008 Certified Journal, Volume 7, Issue 6, June 2017)
207 29.43
19.62 9.81
11 10 9 8 7
5.50 3.25 1.75
200 150 100 11 10 9 8 7
Load
M
e
a
n
o
f
S
N
r
a
ti
o
s
Speed
Temperature
Main Effects Plot for SN ratios-COF Data Means
[image:6.612.319.567.128.339.2]Signal-to-noise: Smaller is better
[image:6.612.49.289.129.436.2]Figure 5. Main effects plot for S/N ratios-COF
Figure 6. Variation of Frictional force with time
C. Regression Analysis and Confirmation Test
A linear regression model was developed based on the experimental results. It establishes a correlation between the important parameters. The regression equation developed for wear rate is given by equation 2.
From the relation, it is observed that the coefficient associated with load, speed and temperature is positive. This clearly reveals that as load, speed and temperature increase, wear rate of ADI also increase. To approve the conclusions acquired from the investigation, affirmation analysis was led and correlation was made between the experimental and computed values created from regression model. Table 8 shows the parameters of confirmation test and 9 show the confirmation test results.
It is noticed that the error between experimental and computed values is minimal and hence this regression model can be used successfully to predict the wear rate of ADI with good accuracy.
Table 8.
Parameters for confirmation experiment
Expt. No.
Load [N]
Sliding speed [ms-1]
Temperature [°C]
1 14.715 1.5 80
2 24.525 3.0 120
3 34.335 4.5 170
Table 9.
Results of confirmation experiment
Expt. No.
Experimental wear rate [m3/m] x 10-12
Regression model wear rate [m3/m] x 10-12
Error [%]
1 0.0045 0.0044 2.22
2 0.0315 0.0303 3.81
3 0.0603 0.0562 6.80
D.Scanning Electron Microscopy Analysis
The SEM micrographs of worn‐out surfaces for various conditions are shown in figures 7, 8 and 9.
[image:6.612.355.562.479.589.2]International Journal of Emerging Technology and Advanced Engineering
Website: www.ijetae.com (ISSN 2250-2459, ISO 9001:2008 Certified Journal, Volume 7, Issue 6, June 2017)
208
Also at high load and temperature, the material undergoes severe plastic deformation forming hot spots. These burnt locations were subjected to high stresses and got peeled off from the surface resulting in severe wear. The temperature and load together reduce the work hardening capabilities of the material making it prone for wear. This indicates the non-suitability of the material for elevated temperature applications.
VI. CONCLUSIONS
The experiments were conducted as per the run order generated by Taguchi technique and the conclusions can be summarized as follows.
Optimal setting for minimum wear rate were obtained using S/N ratio analysis and ANOVA. The analysis shows that wear rate increases with increase in applied load, temperature and speed. From the main effects plot for means and S/N ratio, it was found that L=9.81 N, S=1.75 m/s and T=100 °C gave minimum wear rate. The ANOVA shows the percentage involvement of each
control parameter on wear rate. From the S/N ratio and ANOVA analysis, it was noticed that applied load has the highest implication on wear rate followed by temperature and sliding speed. The regression model generated was efficiently used to predict the wear rate.
Scanning Electron Microscopy analysis of the worn‐out surfaces have shown burnt spots of high plastic deformation regions making the location soft. The material got removed from them by adhesion to the disc resulting in shallow grooves.
The material is subjected to severe wear at higher temperatures when compared to room temperature for the given load and speed rendering the material non-suitable for elevated temperature applications.
REFERENCES
[1] S. Gowri, Understanding Austempered Ductile Iron Process,
Production, Properties and Applications – Part II, Indian Foundry Journal, Vol. 59 No. 2, February 2013.
[2] S. Gowri and K. Hayrynen, Understanding Austempered Ductile
Iron Process, Production, Properties and Applications – Part III, Indian Foundry Journal Vol. 59, No. 3, March 2013.
[3] Kathy L. Hayrynen, The Production of Austempered Ductile Iron
(ADI), 2002 World Conference on ADI.
[4] A.A. Zavaras, H.D. Broady, US Government Research
Announcement Index, PB-126647/xab, National Center for Manufacturing Science, 1990.
[5] M.A. Islam, A.S.M.A. Haseeb, A.S.W. Kurny, Wear 188 (1995) 61–
65.
[6] J.M. Velez, D.K. Tanaka, A. Sinatora, and A.P. Tschiptschin,
Evaluation of Abrasive Wear of Ductile Cast Iron in a Single Pass Pendulum Device, Wear, 2001, 251, p 1315–1319.
[7] S. Mohan, V. Parkash, and J.P. Pathak, Wear Characteristics of
HSLA Steel, Wear, 2002, 252, p 16–25.
[8] M.N. Ahmadabadi, H.M. Ghasemi, and M. Osia, Effects of
Successive Austempering on Tribological Behavior of Ductile Cast Iron, Wear, 1999, 231, p 293–300.
[9] S. Daber, K.S. Ravishankar, and P.P. Rao, Influence of Austenitising
Temperature on the Formation of Strain Induced Martensite in Austempered Ductile Iron, J. Mater. Sci., 2008, 43(14), p 4929– 4937.
[10] S. Daber and P.P. Rao, Formation of Strain-Induced Martensite in Austempered Ductile Iron, J. Mater. Sci., 2008, 43(1), p 357–367.
[11] A.S.M.A. Haseeb, M. A. Islam, M. M. A. Bepari, Tribological
behavior of quenched and tempered,and austempered ductile iron at the same hardness level, Wear 244(1–2) (2000) 15–19.
[12] Uma Batra, Nimish Batra, J. D. Sharma, Wear performance of Cu-alloyed austem- pered ductile iron, J. Mater. Eng. Perform. (2013) 1136–114222 (2013) 1136–1142.
[13] J. Zimba, M. Samandi, D. Yu, T. Chandra, E. Navara, D. J. Simbi, Un-lubricated sliding wear performance of unalloyed austempered ductile iron under high contact stresses, Mater.Des.25 (5) (2004) 431–438.
[14] HaMi D Pour Asiabiand H. Pour Asiabi, Microstructure and
tribological wear behavior of ausferritic Mn, Ni, Cu, Mo, alloyed ductile iron, in:Proceedings of the International Iron &Steel Symposium: Karabük,Türkiye, 2012, pp.616–625.
[15] S. Basavarajappa, K.V. Arun, J. Paulo Davim, Effect of filler
materials on dry sliding wear behaviour of polymer matrix
composite‐Taguchi approach, Journal of Minerals & Materials
International Journal of Emerging Technology and Advanced Engineering
Website: www.ijetae.com (ISSN 2250-2459, ISO 9001:2008 Certified Journal, Volume 7, Issue 6, June 2017)
209
[16] Y.N. Puri, N.V. Deshpandae, Simultaneous optimisation of multiple
quality characteristicsusing fuzzy logic and taguchi technique, in:Proceedings of the fifth asia pacific Industrial Engineering and Management Conference, 2004.
[17] P.R. Apte, Optimisation of EDM using taguchi technique, Methods
workshop using UNIMAP, 2012.
[18] N. Radhika, A Vaishnavi, G. K. Chandran, Optimisation of Dry
Sliding Wear Process Parameters for Aluminium Hybrid Metal Matrix Composites
[19] A. Dolata‐Grosz, J. Wieczorek, Tribological properties of composite
working under drytechnically friction condition, Journal of Achievements in Material Manufacturing Engineering, Vol. 18, No. 1‐2, pp. 83‐86, 2006.
[20] N.M. Rajneesh, S. Kanakuppi, Dry sliding wearbehaviour of Sic
particles reinforced Zn‐Aluminium (ZA43) alloy metal matrix
composite, Journal of Minerals & Material characterisation &
Engineering, Vol. 10, No. 5, pp. 419‐425, 2011.
[21] Nofal Al‐Araji, Hussein Sarhan, Effect of temperature on sliding wear mechanism underlubricated conditions, International Journal of Engineering, Vol. 5, 2011.
[22] S. Venkat Prasat, R. Subramanian, N. Radhika, B. Anandavel, L.
Arun, N. Praveen, Influence of parameters on the dry sliding wear behaviour of aluminium/fly ash/graphite hybrid metal matrix composite, European Journal of Scientific Research, Vol. 53, No. 2, pp. 280‐290, 2011.
[23] K. Hokkirigawa, K. Kato, An experimental and theoretical