International Journal of Emerging Technology and Advanced Engineering
Website: www.ijetae.com (ISSN 2250-2459,ISO 9001:2008 Certified Journal, Volume 4, Issue 6, June 2014)
76
Analysis and Optimization of EDM Process Parameters for
AISI D2 Steel
Prasad A Jadhav
1, Prof. Bhaskar B Borkar
21ME Production(CAD/CAM) Scholar, 2Associate Prof., Amrutvahini College of Engineering, Sangamner, Maharashtra, India.
Abstract— Taguchi design of Experiments Method is used to analyze the effect of three variables discharge current, spark on and spark off time on material removal rate, surface roughness and tool wear.AISI D2 steel with copper electrode is used. Taguchi Design of Experiments followed by taguchi analysis with the help of MINITAB is used. It is found that discharge current and pulse duration are significant factors. Taguchi L16 array is used.
Keywords—Taguchi Method, Orthogonal Array, SN Ratio, DOE.
I. INTRODUCTION
EDM is a extensively used non conventional material removal process for difficult to cut materials. The influence of input parameters on performance measures is analyzed in MINITAB for the material AISI D2 steel. It is high carbon high chromium and hard Steel which is very difficult to machine by conventional methods. Therefore to machine this hard material EDM is employed. It is very difficult task to optimize the parameters of EDM due to its complicated spark energy mechanism. Taguchi Method gives guideline regarding the region of optimization in which one can focus the attention to arrive at final conclusion. Taguchi method is complicated for manual calculations therefore MINITAB is used which is a statistical analysis software widely used for DOE and other statistical analysis.
Experimental investigation requires a number of experimental runs that may be an expensive and time consuming affair. Design of experiments (DOE) techniques like Taguchi’s method, Response surface methodology etc. are used to reduce the experimental runs in a scientific manner. DOE, a statistical technique, is used to study the effects of various input parameters on performance measures simultaneously. Orthogonal array allows to assess the effect of each factor independently of the effects of other factors.
II. DESIGN OF EXPERIMENTS
Experimentation is an important part of any engineering research. The word ‘design’ in the expression design of experiments, is used in a general sense to give information about planning of experiments to fulfill intended objectives. To design the experiment is to develop a scheme or layout of the different conditions to be studied. The word ‘design’, in engineering, may be product design or the process design. In practice, ‘design’ refers to some form of engineering communication, such as a set of specifications, drawings or physical models that describe the concept. In general experimentation consists of an output variable (MRR, SR, TWR), which depends on several input variables (Discharge current, Ton, Toff) called factors. Each factor has at least two settings, called levels. A combination of the levels of all the factors involved in the experiment is called a treatment combination.
Dr G. Taguchi constructed a special set of general designs for factorial experiments that overcomes the draw backs of partial factorial experiment. The method is popularly known as Taguchi’s method. The special set of designs consists of Orthogonal Arrays (OA). The OA is a method of setting up experiments that only requires a fraction of full factorial combinations. The treatment combinations are chosen to provide sufficient information to determine the factor effects using the analysis of means. Orthogonal refers to the balance of the various combinations of factors so that no one factor is given more or less weight in the experiment than the other factors. Orthogonal also refers to the fact that effect of each factor can be mathematically assessed independent of the effect of the other factors.
International Journal of Emerging Technology and Advanced Engineering
Website: www.ijetae.com (ISSN 2250-2459,ISO 9001:2008 Certified Journal, Volume 4, Issue 6, June 2014)
[image:2.612.41.291.119.453.2]77
TABLE 1
Selection of parameters and levels
Level 1 Level 2 Level 3 Level 4
Discharge Current(A)
6 8 12 14
Ton(micro sec)
16 15 18 20
Toff(micro sec)
14 13 16 18
III. EXPERIMENTAL WORK
[image:2.612.49.577.130.689.2]3.1 Experimental Setup-
Fig. 1 Chmer1055z Machine Used for experimentation
3.2 Selection of work piece
[image:2.612.319.580.210.696.2]The material AISI D2 (American Iron and Steel Institute D2) is high carbon high chromium non shrinking water hardening die material. The selected material is 15 mm thick x107 mm length has chemical composition as follows
TABLE 2
Table showing chemical composition of AISI D2 Steel
Element Composition(%)
C 1.48
Mn 0.57
Si 0.41
S 0.015
P 0.017
Cr 11.37
Mo 0.98
V 0.81
Co 0.011
3.3 Selection of Electrode-
A cylindrical shape pure copper of dia. 08mm is used for machining design.
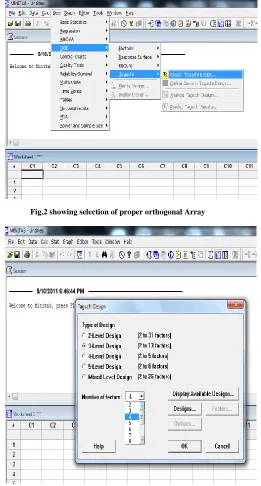
[image:2.612.50.283.281.437.2]IV. MINITAB ANALYSIS
Fig.2 showing selection of proper orthogonal Array
[image:2.612.43.296.546.686.2]International Journal of Emerging Technology and Advanced Engineering
Website: www.ijetae.com (ISSN 2250-2459,ISO 9001:2008 Certified Journal, Volume 4, Issue 6, June 2014)
78 After entering the factors following combination is given by Taguchi and corresponding readings for MRR, SR and TWR were taken experimentally and validated.
TABLE 3
1 2 3 4 5 6 7 8 9 Dis . Cu rre nt( A) T on T of F H ol e no .
D V MR
R
Ra TW
6 16 14 1 2.20 172.7 2.878 3.02 0.008
8
6 15 13 2 2.56 200.96 3.349 4.86 0.008
1
6 18 16 3 0.80 62.8 1.047 1.59 0.009
1
6 20 18 4 0.38 29.83 0.497 0.94 0.009
9
8 16 13 5 3.94 309.29 5.155 3.22 0.007
2
8 15 14 6 3.80 298.3 4.972 2.59 0.007
5
8 18 18 7 1.68 131.88 2.198 2.38 0.006
9
8 20 16 8 0.62 48.67 0.811 1.04 0.009
4
12 16 16 9 5.50 431.75 7.196 3.33 0.010
5
12 15 18 10 3.14 246.49 4.108 5.66 0.010
6
12 18 14 11 7.60 596.6 9.943 6.02 0.008
2
12 20 13 12 2.00 157 2.617 1.98 0.009
5
14 16 18 13 4.22 331.27 5.521 3.33 0.008
1 14 15 16 14 6.00 471 7.850 4.35 0.009
14 18 13 15 7.66 601.31 10.02
2 5.55 0.009
7
14 20 14 16 3.64 285.74 4.762 4.99 0.009
5
Where,
1- Discharge current(Amp)
2- T on(micro sec)
3- T off(micro sec)
4- Hole number
5- Hole Depth(mm)
6- Volume(mm3)
7- MRR(mm3/min)
8- Surface Roughness(Rs)
9- Tool Wear(Height-mm)
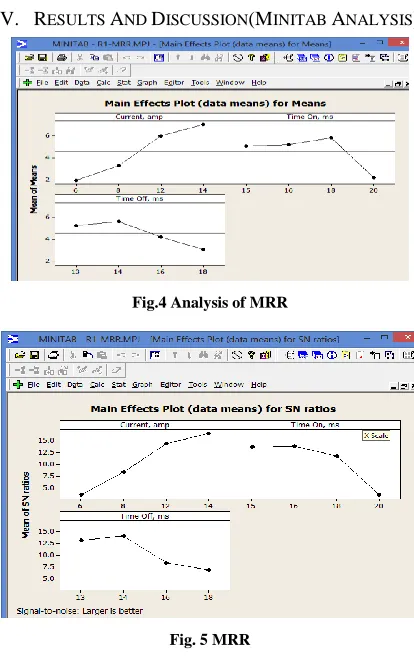
[image:3.612.339.546.131.460.2]V. RESULTS AND DISCUSSION(MINITAB ANALYSIS)
Fig.4 Analysis of MRR
Fig. 5 MRR
[image:3.612.332.554.489.618.2]The SN ratios graph depicts the steep slope in Current when compared to Time Off and Time On.
International Journal of Emerging Technology and Advanced Engineering
Website: www.ijetae.com (ISSN 2250-2459,ISO 9001:2008 Certified Journal, Volume 4, Issue 6, June 2014)
[image:4.612.67.273.130.293.2]79
Fig.7 Analysis of Surface Roughness
[image:4.612.69.266.335.668.2]Among the 3 graphs, Current is showing very steep slope when compared to other. So, this reveals that current plays an imp role in surface roughness.
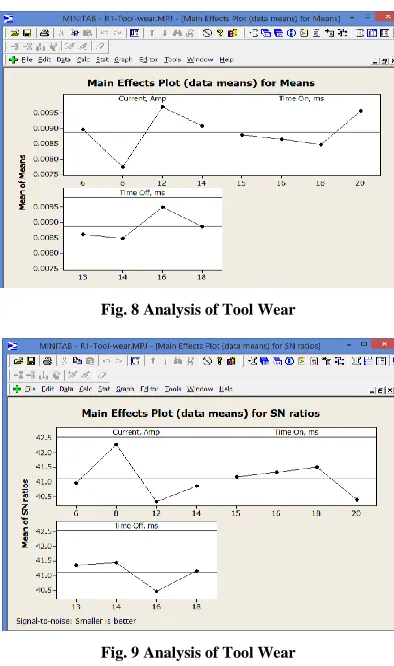
Fig. 8 Analysis of Tool Wear
Fig. 9Analysis of Tool Wear
The Current graph is showing a very steep slope from 6 amps to 8 amps and till 12 amps. After this value the slope is reduced.
When comparing the slope of Current, the other 2 graphs do not show such a steep slope. This also validates that Current is playing an imp role in tool wear.
VI. CONCLUSIONS
1) The Taguchi method is a structured approach for determining the best combination of inputs to produce a product or service.
2) A statistical engineering methodology that reduces the performance variation of a system.
3) Discharge current and pulse-on-time are identified as common influencing factors for MRR, SR and TWR 4) Optimal factor/level combination of process parameters for MRR, SR and TWR are obtained by employing Taguchi’s method as single objective optimization technique.
5) By analyzing Table 3 and graphs we can conclude that MRR is directly proportional to discharge current but it is not the case for Ton. MRR increases with Ton from 16 to 18 but then suddenly decreases. Therefore for MRR Optimum values (SN ratio Larger is better) are as follows
Discharge Current
Ton Toff MRR
14 18 13 10.022
6) For Surface roughness (RA) SN ratio is smaller is better and optimum combination is as follows
Discharge Current
Ton Toff RA
6 20 18 0.94
7) For tool wear (TW) SN ratio is smaller is better and optimum combination is as follows
Discharge Current
Ton Toff TW
8 18 18 0.0069
REFERENCES
[1] Wang, Kesheng, Gelgele, H. L., Wang, Yi, Yuan, Q., & Fang, M. (2003). A hybrid intelligent method for modeling the EDM process. The International Journal of Machine Tools & Manufacture, 43, 995-999.
[2] Mohd Amri Lajis, H.C.D. Mohd Radzi, A.K.M. Nurul Amin (2009)
International Journal of Emerging Technology and Advanced Engineering
Website: www.ijetae.com (ISSN 2250-2459,ISO 9001:2008 Certified Journal, Volume 4, Issue 6, June 2014)
80
[3] Yusoff, A.R. Ghazalli, Z, & Hussain, H. C. (2009). Determining optimum EDM parameters in drilling a small hole by Taguchi method. International Journal of Machining and Machinability of Materials, 17(4), pp. 345-352
[4] Warbutton, P. (1967). Problems of Machining Nickel based alloys.
Iron and Steel Institute Special Report, 94, pp. 151-160
[5] Pandey, P.C.; Shan, H.S (2003): Modern Machining Process, Tata