International Journal of Emerging Technology and Advanced Engineering
Website: www.ijetae.com (ISSN 2250-2459,ISO 9001:2008 Certified Journal, Volume 3, Issue 11, November 2013)
130
Building OLAP Application to Exploit Database of Rice Pests
Phan Quoc Nghia
Faculty of Engineering and Technology, Tra Vinh University, Viet Nam
Abstract - On-line Analytical Processing (OLAP) is widely used in many business applications to analyze data and to help answer queries in multidimensional data to support the manager in making reasonable decision [23]. This paper describes and builds an OLAP application on database of rice pests by using data warehouse architecture, On-line Analytical Processing and web components. This application supports efficient exploitation of rice pest data warehouses in Horticulture and Plant Protection branch of Tra Vinh province in Viet Nam which is accumulated over the years. To achieve this goal, several tools are used to build successful applications such as SQL Server 2005 to build data warehouse, Analysis Services 2005 to build OLAP multidimensional databases and Microsoft Office Web Components to build the web-based reporting of data. With the results obtained, the application allows users a flexible on-line analysis of data on rice pests live on site. This suggests that the use of OLAP technology is not only effectively applied to support business applications, but also needed to be strongly applied in informatics systems to support the agricultural sector.
Keywords - Data Warehouse, On-line Analytical Processing (OLAP), OLAP multidimensional databases, Multidimensional Online Analytical Processing (MOLAP), Relational Online Analytical Processing (ROLAP).
I. INTRODUCTION
Agriculture is an important economic sector for every country especially at this time, where food security problems are at the forefront.
Since Viet Nam is an agricultural country, agriculture has a big and important role in the economic growth and development of the country. This fact has been very evident during the food price crisis in 2008. The crisis greatly affects other economic sectors and most especially, the lives of millions of people.
Mekong River Delta (MRD) is the largest granary in Viet Nam. Recently, with the intensive cultivation and application of scientific and technical advances in the field of agriculture, rice production has been so enhanced, resulting in an observable increase in terms of yield. Over the past ten years, the Mekong Delta has been considered as the key economic region of the country where foods are produced for export and thereby, ensuring national food security [29].
However, the intensification of rice production in years, has created risk for outbreaks of pests. The Brown Plant Hopper (BPH) epidemic, strucked in all the provinces within the Mekong Delta in 2006 [22].
Countering the problem, scientists have made intensive research in order to put up more effective measures such as, breeding new varieties that are resistant to pests, performing extensive methods, re-scheduling appropriate time for planting rice to avoid pest, spraying chemicals to prevent and/or treat damage caused by these pests, and many other methods [5].
At the office of the Department of Horticulture and Plant Protection of Tra Vinh province in Viet Nam, analysis based on huge amounts of data to support information on rice pest for farmers, agricultural managers, researchers were necessarily conducted purposely. The results of which have important implications in the prevention and treatment of pests. To achieve this goal, the development of online applications found online statistical analysis techniques to be of great help.
Obtaining reports based on multiple criteria, usually takes a lot of time to gather all salient information. Data integration, performance of some calculation formulas, setting new report template designs, the modification of the structure of the database, and change in the source code of the software needs ample time in the preparation thereof. These complex steps have caused to slow down the process of providing information so as to conceive scientific pest prevention measures. Hence, replacing this process with a new approach is needed.
One quick solution to such problem is building OLAP (On-line Analytical Processing) on web-based applications to service an on-line analysis of data on rice pest probed to be practical. This application is designed so as to provide accurate information, to meet the requirements of data analysis on a variety of criteria, and to meet the requirements for the user to analyze the data.
The main purpose of this paper is to design the OLAP application for exploiting the database of rice pests based on combination of data warehousing, online analytical OLAP and web components. A result, this system can directly support people's requirements in the Internet, when they need to analyze data on rice pests. To demonstrate the effectiveness of our system, the real data about agriculture of Tra Vinh province in Vietnam is used as data input.
International Journal of Emerging Technology and Advanced Engineering
Website: www.ijetae.com (ISSN 2250-2459,ISO 9001:2008 Certified Journal, Volume 3, Issue 11, November 2013)
131
II. OLAP TECHNOLOGY
A. What is OLAP?
The term OLAP, is from an article entitled "Providing On-Line Analytical Processing to User Analysts" by E. F. Codd (1993). It is known as a data analysis technique used to show the multidimensional data called cube. OLAP provides the ability to create cubes of data and perform sophisticated queries on the user application [23]. Contained in the article above mentioned, are the 12 rules that the OLAP system must follow, which will be described below.
12 rules of an OLAP system by E. F. Codd [18]:
1. Multidimensional Conceptual View: Data should be presented to the user in a multidimensional pattern.
2. Transparency: Users should not need to know that they are using an OLAP database.
3. Accessibility: Tools should choose the best source of data to support a query.
4. Consistent Reporting Performance: Performance should be the same regardless of the number of dimensions in use.
5. Client-Server Architecture: Tools should be deployed in client server architecture.
6. Generic Dimensionality: Dimensions are all equal; there should be no bias towards any one dimension.
7. Dynamic Sparse Matrix Handling: Null values should be stored in an efficient way.
8. Multi-User Support: Tools should support more than one user.
9. Unrestricted Cross-Dimensional Operations: Aggregation rules should be applied consistently across all dimensions.
10. Intuitive Data Manipulation: The user views of data should contain everything required without resorting to using menus or multiple trips across the user interface.
11. Flexible Reporting: Users should be able to present data in any way they like.
12. Unlimited Dimensions and Aggregation Levels: There should be no limit to thenumber of dimensions and levels in a model.
B. Multidimensional Data Model
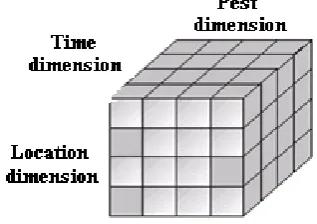
[image:2.595.346.505.148.260.2]For a fact, people tend to think in a "multidimensional" way. For example, an agricultural manager estimates pest happening he describes as follows: "Most probably, the Brown plant hopper (BPH) epidemic will flare up again in the province of Tra Vinh, Vinh Long, and An Giang around May in 2009". This prediction is the data cube design described as follows:
Figure 1: Simulation of dimensional cube of rice pests
Cube: The cube is the main OLAP structure which is used to view data. It is something similar to a table in the relational database system. The term cube refers to three dimensions in common, but here Analysis Services cube can have 128 dimensions.
A cube is a multidimensional structure that is defined by a set of dimensions and measures. Dimensions define the structure of the cube, while measures define the numerical values of interest to the user.
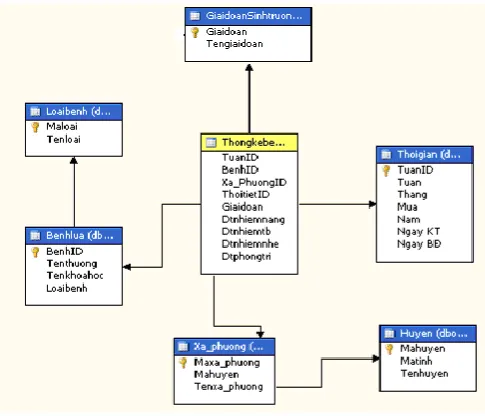
[image:2.595.316.545.464.628.2]Each and every cube has a schema which is defined by a set of joined tables in the data warehouse from which the cube gets its source data. The middle table in the schema is the fact table, which is the source of the cube's measures. The other tables are dimension tables, which are the sources of the cube's dimensions [18].
Figure 2: Schema of DICHHAI cube structure
International Journal of Emerging Technology and Advanced Engineering
Website: www.ijetae.com (ISSN 2250-2459,ISO 9001:2008 Certified Journal, Volume 3, Issue 11, November 2013)
132
[image:3.595.316.559.141.349.2]Hierarchy: Hierarchy is the spine of the synthetic data. Otherwise, It is based on the hierarchy we can synthesize the data. Most of dimensionals have multi-level structure or hierarchy [1].
Figure 3: Hierarchy of location dimension
Measures: In a cube, a measure is a set of values that are based on a column in the cube's fact table and are usually numeric. Measures are the central values of a cube. That is, measures are the numeric data of main interest to users browsing a cube. The measures we select depend on the types of information users requests. The measures are created when the cube is created. A cube's measures are not shared with other cubes. A cube can have up to 1,024 measures [1]. For example, in Figure 2 contains four measures namely: Dtnhiemnang, Dtnhiemtb, Dtnhiemnhe, Dtphongtri.
C. Three Types Schemas for Multidimensional
Databases
[image:3.595.51.278.188.300.2]Star schema: Star schema consists of a fact table located in the center, and a number of dimension tables connected surrounding the fact table to form stars [18].
Figure 4: Stars schema
Snowflake schema: Snowflake schema is a variation of the star schema, in which some dimensions are standardized, which can be further divided into other table data. Snowflake schema has shape like a snowflake [18].
Figure 5: Snowflake schema
Fact constellation schema: The complex OLAP
[image:3.595.318.554.445.618.2]application may require multiple fact tables share dimension tables. This type of scheme can be considered as a collection of star schema. Therefore, it is called fact constellation schema [1].
Figure 6: Fact constellation schema
D. The Common OLAP Model
[image:3.595.51.277.520.661.2]International Journal of Emerging Technology and Advanced Engineering
Website: www.ijetae.com (ISSN 2250-2459,ISO 9001:2008 Certified Journal, Volume 3, Issue 11, November 2013)
133
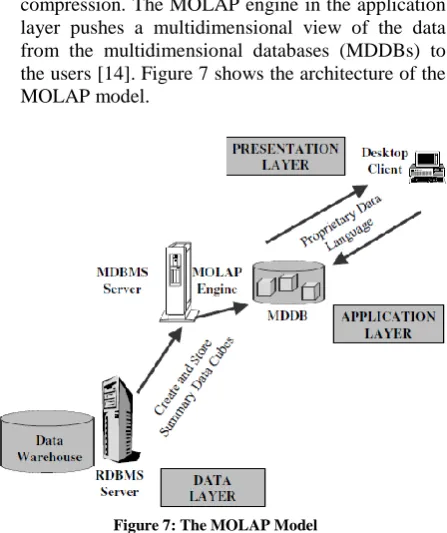
[image:4.595.56.280.200.467.2]E. 1) The MOLAP Model: In this MOLAP model, The underlying data for a cube is stored along with aggregation data in a high-performance multidimensional structure. MOLAP storage provides excellent performance and data compression. The MOLAP engine in the application layer pushes a multidimensional view of the data from the multidimensional databases (MDDBs) to the users [14]. Figure 7 shows the architecture of the MOLAP model.
Figure 7: The MOLAP Model
The advantages of MOLAP model:
- Executes the query faster, thanks to the optimized storage, multidimensional indexing and cache memories mechanism.
- Good application for systems which required complex calculations and faster access time because all the data necessary in the calculations were made while creating the data cube.
- Does not use lock mechanism because the data is read-only.
- Data can be easily copied to the user for offline analysis.
The Disadvantages of MOLAP model:
- Costs more time to process the data (load data). - MOLAP store redundant data in order to meet fast
access time.
- Restricted by the data storage system because all the information are computed in the cube. Tending the data cube to aggregate rather than detail. - Increased costs due to multi-technology unavailable
in the system, investment costs should be for both technology and human training to defray additional costs and expenses.
[image:4.595.333.543.234.455.2]F. 2) The ROLAP Model: Here, the data is stored in tables and in a relational database format. In order to hide the storage structure to the user and present data multidimensionally, a semantic layer of metadata shall be created. The metadata layer supports the mapping of dimensions to the relational tables. It also supports summarizations and aggregations. It is very possible to store the metadata in relational databases [14].
Figure 8: The ROLAP Model
The Advantages of ROLAP Model:
- Can be applied to large systems since ROLAP can cater large amount of data using relational database. - Save storage space since storing data in relational
databases rarely overlap.
- ROLAP is an effective technique for relational database management systems because it maintains its traditional functions and implements the functionality of OLAP systems.
- The data in relational databases is standardized so they can be accessed by any SQL tool.
The Disadvantages of ROLAP Model:
- In using queries, ROLAP is slower than MOLAP because it utilizes the primitive method for queries in relational databases.
- In ROLAP model, all calculations are based on SQL functions, so it is not suitable when the system needs more computing such as budgeting systems, financial reporting systems.
G. OLAP Functionality
International Journal of Emerging Technology and Advanced Engineering
Website: www.ijetae.com (ISSN 2250-2459,ISO 9001:2008 Certified Journal, Volume 3, Issue 11, November 2013)
134
- Roll up: This operation goes towards higher in the hierarchy, to aggregate data at a higher level. - Drill-down: This operation opposes to Roll-up, in
the direction of the lower level in the hierarchy, in order to present the data in more detail.
- Slice and Dice: Slice is the act of picking a rectangular subset of a cube by choosing a single value for one of its dimensions, creating a new cube with one fewer dimension. Dice is an operation that produces a subcube by allowing the analyst to pick specific values of multiple dimensions.
[image:5.595.43.281.131.684.2]-
Pivot (or rotate): allows an analyst to rotate the cube in space to see its various faces. [image:5.595.320.545.146.306.2]Figure 9: Roll up, Drill down operation
Figure 10: Pivot operation
Figure 11: Slice and Dice operation
III. BUILDING OLAP APPLICATIONS
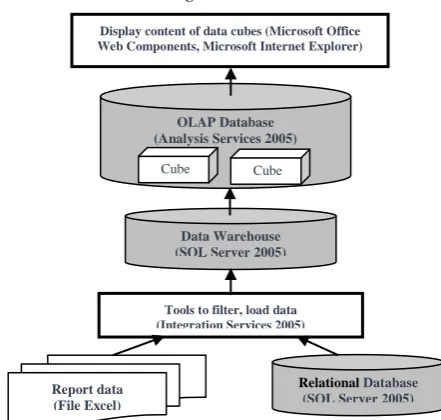
Microsoft supports the application and offers various tools in designing and building OLAP applications in a Web environment quickly and easily. These tools are integrated in a unified environment and the connections between them are very easy to carry through the graphical interface. These tools can be divided into three groups: group for data warehouse, group for multidimensional database and group for display data cube.
A. Connection Tools Diagram
Figure 12: Diagram of connections between specific groups
Roll up Drill-down
Pivot (hay rotate)
Relational Database (SQL Server 2005) Report data
(File Excel)
Data Warehouse (SQL Server 2005)
OLAP Database (Analysis Services 2005)
Cube Cube
[image:5.595.322.543.470.680.2]International Journal of Emerging Technology and Advanced Engineering
Website: www.ijetae.com (ISSN 2250-2459,ISO 9001:2008 Certified Journal, Volume 3, Issue 11, November 2013)
135
H. B. Structure of the OLAP Application System
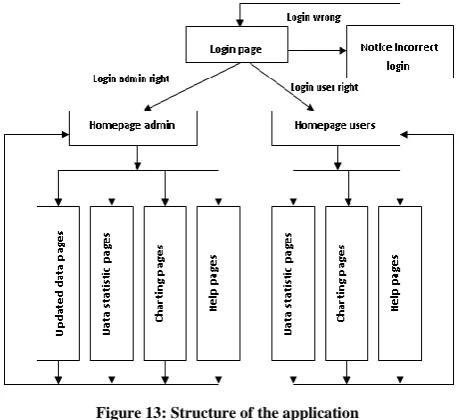
[image:6.595.314.550.135.320.2]The application is built on a web-based system that provides the user interface to the users including the system administrators. The website also provides information such as statistics on rice pests and user guide.
Figure 13: Structure of the application
I. C. The Login Page of the Application
To use the application, users are required to log into the system through their individual accounts created by the administrators, using their unique usernames and passwords.
Figure 14: Log on windows of application
J. D. The Interface of the Web Application
[image:6.595.50.280.219.429.2]When a user logs into the system, the main page will be displayed. This interface provides menus and options for the user to choose to perform the desired operations and applications.
Figure 15: The main interface of the website
K. E. Online Statistic Pest Data Page
On the statistic pest data interface, users create a report according to requirements by dragging and dropping the required columns in the window. And users can choose the statistics functions (sum, max, min, average) to calculate the required data.
Example:
To synthesize an area that is heavily affected by pests like Pyricularia oryzae Carava, Rice Ragged Stunt Virus, Aleurodicus dispersus, Brown plant hopper and Cnaphalocrosis medinalis Gueneein Tra Vinh province in 2008, according to the distribution in season we manipulate as follows:
- Drag the Tenthuong column (pest name) from the PivotTable Field into Row area, filter by criteria that need integrated pests.
- Drag the Mua column (season) into the Column Field area.
- Drag the Dtnhiemnang column (area heavy affected by pests) into the Totals or Detail fields area.
- Drag the Tentinh column (province name) into the Filter Fields area, filter by criteria "Tra Vinh"
[image:6.595.50.276.509.642.2]International Journal of Emerging Technology and Advanced Engineering
Website: www.ijetae.com (ISSN 2250-2459,ISO 9001:2008 Certified Journal, Volume 3, Issue 11, November 2013)
[image:7.595.53.274.140.301.2]136
Figure 16: Illustration statistical data on seasonL. Charting Statistic Interface
On the statistic metrics of pests interface, a user can create a chart according to requirements by dragging and dropping the required columns into the chart areas in the presentation window.
Example:
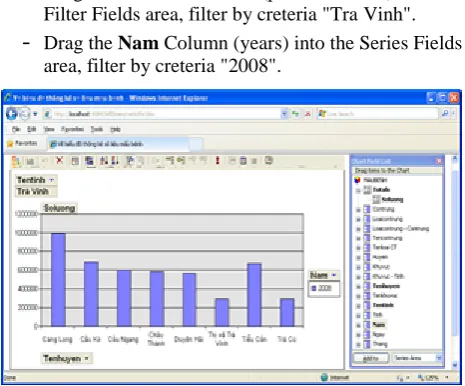
To chart the number of brown plant hopper in light traps within the districts of Tra Vinh province in 2008, we manipulate as follows:
- Drag the Tenhuyen column (district name) into the Category Fields area.
- Drag the Soluong column (quantity) into the Categories area.
- Drag the Tentinh column (province name) into the Filter Fields area, filter by creteria "Tra Vinh".
-
Drag the Nam Column (years) into the Series Fieldsarea, filter by creteria "2008".
Figure 17: Chart showing the number of brown plant hopper light trap
IV. BENEFITS OF SYSTEM
Over two months trial run at the office of the Department of Horticulture and Plant Protection of Tra Vinh province we found that the system provides some benefits as follows:
- The speed data access of the system is faster than its traditional websites.
- Reducing time and cost of pest management in rice for local government.
- Making the new “channel” to provide information and to synthesize data based on the Internet instead of the use the Document in the paper.
V. CONCLUSION
This study has successfully developed applications on rice pest data in Tra Vinh through OLAP techniques. The results showed the applicability of OLAP techniques for systems providing information in the field of agriculture. However, if we want to apply this technique in the field, there is a need to develop more of the following: (i) building the cubes of data based on the opinions of agricultural experts, (ii) deploying this application on open source tools.
REFERENCES
[1] Huynh Tuan Anh , 2008, Datawarehouse and data mining, Nha Trang University.
[2] Nguyen Van Trieu Dang, 2006, Application of data warehouse technology to analyze online at Ben Tre Post Office in Viet Nam, University of Information Technology.
[3] Nguyen Ngoc Đe, 2009, Rice Textbooks, National University of Ho Chi Minh City.
[4] Vo Thanh Hoang, 2008, Curriculum specialist plant diseases, Can Tho University.
[5] Pham Van Kim, 2009, Syllabus Principles of plant diseases, Can Tho University.
[6] Alvin B, 2007, The Microsoft Office Web Components, Microsoft Corporation.
[7] Dave Stearns, 1999, Introducing the Office Web Components, Microsoft Corporation.
[8] Erik Thomsen, 2002, OLAP Solutions Building Multidimensional Information Systems, Wiley.
[9] Eric, 2005, Implementing Office Web Component Pivot Tables with ASP.NET, Microsoft Corporation.
[10] Jeffrey Hasan and Kenneth Tu, 2003, Build an OLAP Reporting App in ASP.NET Using SQL Server 2000 Analysis Services and Office XP, Microsoft Corporation.
[11] Kevin McDowell, 2001, Microsoft Office 2000 Web Components Basics, Microsoft Corporation.
[12] Murugan Anandarajan, Asokan Anandarajan, Cadambi A. Srinivasan, 2004, Business Intelligence Techniques: A Perspective from Accounting and Finance, Springer.
[image:7.595.48.281.494.687.2]International Journal of Emerging Technology and Advanced Engineering
Website: www.ijetae.com (ISSN 2250-2459,ISO 9001:2008 Certified Journal, Volume 3, Issue 11, November 2013)
137
[14] Paulraj Ponniah, 2001, Data Warehousing Fundamentals: A Comprehensive Guide for IT Professionals, Wiley.
[15] Robert Wrembel, Christian Koncilia, 2007, Data Warehouses and OLAP: Concepts, Architectures and Solutions, IRM Press. [16] Stanisław Kozielski, Robert Wrembel, 2009, New Trends in Data
Warehousing and Data Analysis, Springer.
[17] Sivakumar Harinath and Stephen R. Quinn, 2006, Professional SQL Server Analysis Services 2005 with MDX, Wiley.
[18] Swathi R. Kasireddy, 2007, Olap Reporting Application Using Office Web Components, The University of Akron.
[19] Vincent Rainardi, 2008, Building a Data Warehouse With Examples in SQL Server, Apress.
[20] W. H. Inmon, 2005, Building the Data Warehouse, Fourth Edition, Wiley.
[21] Zhao Hui Tang and Jamie Mac Lennan, 2005, Data Mining with SQL Server 2005, Wiley.
[22] http://www.agu.edu.vn/cms/NLC/quanlydichhaitonghoptrenlua.ht m.
[23] http://www.olap.com/w/index.php
[24] http://www.microsoft.com/downloads/details.aspx [25] http://msdn.microsoft.com/en-us/library [26] http://www.dbazine.com/sql/sql-articles/charran3 [27] http://msdn.microsoft.com/en-us/library/ms130214.aspx [28] http://dsvn.vn/khcn/tinnhanh/index.asp