International Journal of Emerging Technology and Advanced Engineering
Website: www.ijetae.com (ISSN 2250-2459, ISO 9001:2008 Certified Journal, Volume 3, Issue 8, August 2013)
116
Predictive and Preventive Maintenance of Two and Three
Wheeler Tube Defects in Splicing Process
Paramesha M
1, Dr G Mallesh
2 1M.Tech scholar, 2Associate Professor, Department of Mechanical Engineering, Sri Jayachamarajendra college of Engineering, Mysore, Karnataka, India
Abstract— Objective of any industry is to reduce the production and maintenance cost to enhance the quality of product for consumer needs. The production loss due to machine breakdown has made a critical factor in modern industries. Today, with the developments of special purpose and sophisticated machines and equipments will cost more and there downtime is more expensive. Therefore there is a necessity to reduce the cost of production without affecting the quality of the product. Predictive maintenance is a more condition-based maintenance approach which is based on measuring of the equipment condition in order to assess the equipment failure during production. Preventive maintenance is a planned maintenance schedule aimed to prevent breakdowns and failures. The primary goal of preventive maintenance is to prevent the failure of equipment before actually it occurs. Splicing is an important process in tube production. It is the process of joining the tube open ends to form a closed loop. Splicing must be performed as efficiently as possible, since splice open faults contributes major rejections of tube. Hence it required to prevent such tube defects to increase the production of quality tubes. The main objective of this to study breakdown details of splicing processes, equipment reliability, availability, failure rate were calculated based on root causes for the breakdowns using brainstorming technique.
Keywords—Availability, Brainstorming, Breakdown, Failure Rate, Maintainability, Predictive and Preventive maintenance, Root Cause analysis, Reliability, Quality.
I. INTRODUCTION
The manufacturing industries have gone through significant changes in the last decade. New firms in markets have increased competition dramatically. Most of them focus on product quality, reliability, production loss and cost of product. Because of these companies should introduce quality system to improve and increase both quality and productivity continuously [1]. As a major part of the expenditure which is generally on the men, machine and the material in industries.
Every machine will require repairs even if it was designed well, hence the repair must be done when it has less disruption i.e., machine may be repaired when it is not being used or its use may be postponed, without affecting the production of the whole concern[2]. Machine maintenance is importance in industry, because of the need to increase reliability and to decrease the possibility of production losses due to the machine breakdowns. Scheduled maintenance reduces the regular breakdowns and increases the availability of machines. To be a successful and profitable industry, the machineries should work continuously with its full capacity towards best production rates. For this to happen firm has to reduce the unwanted stoppages of production so as to maintain the steady production level and to meet the demands in the market. Detection of faults like unbalance, rotor rub, shaft misalignment, gear failure and bearing defects etc, is possible. Root cause analyses and brainstorming techniques are used to identify the faults and recurrence of the faults simply by addressing their symptoms [3]
II. PROBLEM DEFINITION
Splicing is the fundamentally an important process in tube manufacturing which is to be performed as effectively as possible, since splice opening faults causes rejection of tubes. The main objective this paper is to the minimize the tube defects particularly in 2 & 3 wheelers during manufacturing to enhance the productivity without affect the quality of tubes.
III. ROOT CAUSE ANALYSIS
International Journal of Emerging Technology and Advanced Engineering
Website: www.ijetae.com (ISSN 2250-2459, ISO 9001:2008 Certified Journal, Volume 3, Issue 8, August 2013)
117
Data collection Problem identification by brainstorm technique Failure Analysis and Reliability assessment
A. Data Collection
1. A study of splicing process in 2 & 3 Wheeler tube defects in tube manufacturing industries.
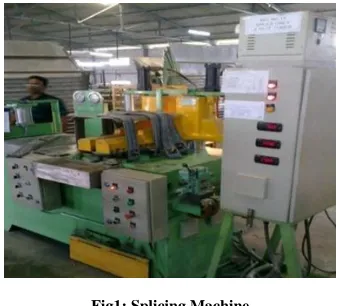
Splicing is the operation of joining the tube open ends to form a closed loop. The type of joint is butt joint, splicing is fundamentally an important step in tube manufacturing and must be performed effectively, since splice opening leads to rejections. Butyl tubes are spliced by automated butt splicing machines, the ends of the inner tubes to be joined are cut to length by a hot knife and the fresh tacky surfaces are butted together to form a tube. Butt splicing machines are operated hydraulic or pneumatic type as shown in figure 1.
Fig1: Splicing Machine
To identify the splice opening faults several studies has been conducted and specific problem can be identified by breakdown analyses. Break down data of 2 & 3 wheeler tube defects in tube manufacturing industries from April 2012 to December 2012 was taken for the study.
[image:2.612.83.253.338.491.2]Pie chart shows the different defects during tube manufacturing phase and identified that 36 % of the tube defects is in splice opening. Hence it is required to study the splicing process to minimize the tube defects.
Fig 2: Break down data of 2 & 3 wheeler different tube defects in tube manufacturing industries
B. Problem Identified During Brainstorming Session
Brainstorming is a technique for generating a large number of ideas on a topic from the members of a team or group. Brainstorming technique can be used at planning stage of the project. It encourages co-operative and collaborative behavior in developing the group work skills among the team members. Following problems were identified during brainstorming session conducted for the employees working in splicing process.
1. Entry and exit splice open Slow speed incorrect Low heat too much
Damage in clamping jaws at the edges 2. Smooth folding at the splice is not achieved
Gap between rubber jaws and bobbing blocks Too much high clamp pressure
Tube width adjustment is less
3. Splice strength not achieved at the body of the tube Overhang very low
Inadequate butting pressure Too much of overhang 4. Too much of flash noticed
Hence, it is noticed that failure is due to improper maintenance of a splicing machine. If preventive maintenance schedule is implemented number of tube rejections can be reduced.
36%
14% 22%
5%
2% 4%
1% 3% 13%
Splice Open
Thin Gauge Length Pucker Valve pucker
forign Matter Bulg
Brist unde/over cure
International Journal of Emerging Technology and Advanced Engineering
Website: www.ijetae.com (ISSN 2250-2459, ISO 9001:2008 Certified Journal, Volume 3, Issue 8, August 2013)
118
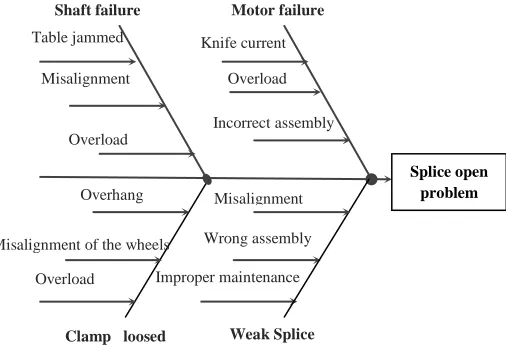
C. Cause and effect diagram [image:3.612.43.296.279.452.2]Cause-and-effect diagrams or Ishikawa diagram (Fish bone diagram) is one of the seven basic tools of root cause analysis to identify major breakdowns during splicing process in this paper. Splice opening problem may be due to the following reasons, motor failure, shaft failure; clamp loosed weak splice, improper checking methods, improper maintenance and unskilled operations, knife current variation, damage in clamping jaws, variation in overhang, clamp pressure etc., These failures can be minimized by proper maintenance techniques.
Fig 3: Cause and effect diagram of splice open problem.
IV. FAILURE ANALYSES AND RELIABILITY ASSESSMENT
Failure analysis is the process of collecting and analyzing data to determine the cause of a failure and how to prevent it from recurring. It is an important discipline in many branches of manufacturing industry, where it is used in the development of new products and for the improvement of existing products. Failure occurs in a random pattern and in general cannot be predicted. Whenever failure occurs, it will have a consequence and the consequence depends upon the criticality of the machine. More the failures, the availability of the machine goes on reducing. Therefore, failure rate is an important parameter in determining maintenance planning activities.
A. Types of failure analysis
There are two types of failure analysis Technical failure analysis. Statistical failure analysis.
1. Technical failure analysis
It determines the causes and extent of failure. It is usually carried out by corrosion engineering, equipment inspection, plant engineering, maintenance technicians and customer service. This type of failure analysis needs sophisticated and costly instruments to carry out the analysis. Technical failure analysis is usually conducted by NDT testing to diagnose the ongoing deterioration and hence it is possible to take up appropriate maintenance action much before the failure occurs.
2. Statistical failure analysis
It determines the time dependence of the failure mechanism of its cause. This, instead of sophisticated instruments, needs historical data for the failure analysis. Statistical failure analysis is a very important tool in the breakdown of equipments and to plan maintenance. Combined with experience, it does a great help in achieving high availability of the machine and long life.
B. Reliability Assessment
Reliability is defined as the probability of an item performing its intended function over a given period of time under the operating conditions encountered.
Failure:An item said to be failed when: It becomes completely inoperable.
When it is still operable, but no longer able to perform its intended function satisfactorily.
When serious deterioration has made it unreliable or unsafe for continued use, thus necessitating its immediate removal from service for repair or replacement.
Failure Rate
The failure rate is expressed in terms of failures per unit time, such as failure per hour etc. It is given by the formula
Downtime
It is expressed as total downtime in hours per unit of time or some fixed hours.
It is given by the formula:
Wrong assembly
Overhang
Splice open problem Motor failure
Shaft failure
Weak Splice Clamp loosed
Knife current
variation
Overload
Incorrect assembly
Misalignment
Improper maintenance
Table jammed
Misalignment
Overload
Misalignment of the wheels
International Journal of Emerging Technology and Advanced Engineering
Website: www.ijetae.com (ISSN 2250-2459, ISO 9001:2008 Certified Journal, Volume 3, Issue 8, August 2013)
119
Mean Time between Failures (MTBF)It is the time between the two failures. When failure rate is constant, the mean time between failures is the reciprocal of the constant failure rate or the ratio of the test/available time to the number of failures.
Mean Time to Repair (MTTR)
MTTR is the time on an average per repair and is obtained by
Maintenance Action Rate (µ)
µ =
Maintainability Rate (M)
The maintainability rate is probability of completing the
maintenance action in time‗t‘. It is obtained
Equipment Availability (Ae)
Availability of a system is the probability that system is operating satisfactory at any point in time when used the system is operating satisfactorily at any point in time when
used stated condition.
Reliability (R)
The distribution of time between failures indicates the chance of failure free operation for the specified period time. the chance of obtaining failure free operation for a specified time period changing the time between failure distribution showing number of intervals equal to specified time length
Reliability Assessment calculation for splicing machine in year Apr-13 to Dec-13
Total available time = 4800 hours Total number of breakdown = 120 Total machine downtime = 123 hours
Total repair time = 111hrs 30 minutes or 111.5 hours
Failure Rate (λ)
λ =
= 120/4800 = 0.025 Breakdowns per hrs.
Downtime =
= 123/4800 =
0.02562=2.56%
Mean Time between Failure (MTBF)
MTBF = =
= 1/0.025 = 40 hrs
Mean Time to Repair (MTTR)
MTTR =
= 111.5/120 = 0.9279 Hours = 56 minutes
Maintenance Action Rate (µ)
µ = = 120/111.5 = 1.07 actions/ Hours
Equipment Availability (Ae)=
= 0.9775 = 97.75%
Maintainability Rate (M)
After 1 hour, M = [1-e-(1.07x1)] = 65.56% 2 hour, M = [1-e-(1.07x2)] = 88.23% 3 hour, M = [1-e-(1.07x3)] = 95.96% 4 hour, M = [1-e-(1.07x4)] = 98.96% 5 hour, M = [1-e-(1.07x5)] = 99.52% Reliability (R)
After, 1 hour, R= (e-(0.025×1)=97.53
2 hour, R = e-(0.025x2) = 95.12% 25 hour, R = e-(0.025x25) = 53.52%
50 hour, R = e-(0.025x50) = 28.65% 100 hour, R = e-(0.025x100) = 8.20%
150 hour, R = e-(0.024x150) = 2.35%
200 hour, R = e-(0.024x200) = 0.67% 250 hour, R = e-(0.024x250) = 0.19% 300 hour, R = e-(0.024x300) = 0.055%
International Journal of Emerging Technology and Advanced Engineering
Website: www.ijetae.com (ISSN 2250-2459, ISO 9001:2008 Certified Journal, Volume 3, Issue 8, August 2013)
120
V. PREDICTIVE MAINTENANCE PLANS FOR SPLICINGPROCESS
The improvement in maintenance technology was the advent of predictive maintenance, which is based on the determination of a machine's condition while in operation. The technique is dependent on the fact that most machine components will give some type of warning before they fail. To sense the symptoms by which the machine is warning us requires several types of non-destructive testing such as oil analysis, wear particle analysis, vibration analysis and temperature measurements. In a plant using predictive maintenance, the overall machinery condition at any time is known and much more accurate planning is possible. Predictive maintenance utilizes many different disciplines, by far the most important of which is periodic vibration analysis. It has been shown many times over that, of all the non-destructive testing that can be done on a machine. The vibration signature provides the most information about its inner workings. Oil analysis and wear particle analysis are important parts of modem predictive programs. The major benefit of predictive maintenance of the mechanical equipment is increased availability due to its greater reliability. Predictive maintenance techniques can be used to assure proper alignment and overall integrity of the installed machine. Predictive maintenance reduces the failure and improvement in worker safety. There have been many cases of physical injury and even death due to sudden machine failures.
B. Procedure for Predictive Maintenance
Initially identify the key manufacturing equipment and select parameter (Noise, Alignment, Fluid analysis and Temperature) for predictive maintenance.
Identify resources (audio phone, slip gauges and try square, visco -stick, pyrometer etc) required for predictive maintenance.
Determine frequency of predictive maintenance and prepare the predictive maintenance schedule.
Carry out predictive maintenance as per work instructions for the given parameter and record the observations in predictive maintenance checklist. Analyze the data and identify symptoms of
deterioration. If any symptom is not present in that data, continue the predictive maintenance as per predictive maintenance schedule.
If any symptoms present in that data, plan preventive maintenance & carry out preventive maintenance work as per work instructions & finally record it.
C .Work Instructions for Predictive Maintenance
For the critical machines, different parameters are chosen for predictive maintenance. For these parameters, certain work instructions are to be followed to find the condition of the machine by using predictive maintenance techniques.
Some of the parameters chosen are as follows: Noise
Alignment Fluid analysis Temperature
1. Work Instructions for Noise Level Checking
Purpose: To check the condition of the bearings of the machinery and to prevent the breakdown.
Responsibility: Assign Mechanical
Engineer/Fitter.
Instrument used: Audio phone or Engineering Stethoscope.
Checking place: Near the machine. Checking interval: Monthly. Method of checking:
Place the sound-observing earplug of the audio phone into the ear.
Place the probe of the audio phone on the machine bearing to be checked.
Observe the sound. If observed sound is found to be even, then the condition of the bearing is 'OK'. If the observed sound is uneven and irritable,
bearing checked is 'NOT OK'.
Conclusion:
If the observed sound is found 'NOT OK', initiate for greasing. After greasing, if there is no improvement in sound, then plan for PM work and do necessary corrective work.
Update the predictive maintenance record.
2. Work Instructions for Alignment Checking
Purpose: To check the machinery drive to driven coupling is in line or not.
Responsibility: Assign Mechanical Engineer/Fitter. Instrument used: Slip gauge and try square. Checking place: Near the machine.
Checking interval: Monthly. Method of checking:
International Journal of Emerging Technology and Advanced Engineering
Website: www.ijetae.com (ISSN 2250-2459, ISO 9001:2008 Certified Journal, Volume 3, Issue 8, August 2013)
121
o Check both drive side and non-drive side couplingsare OK and check coupling pad is OK. If the couplings and pad are NOT OK, replace them. o Check whether top surface of both the couplings
are inline or not, rotate the couplings and check for the same by using a try square. If couplings are not inline, provide packing and align them inline. Check the gap between two couplings, circularly equal or not, by using a slip gauge. If gap is NOT OK, provide shim wherever necessary and make the gap equal.
Conclusion:
After aligning, make observation for any abnormal sound while the machine is in operation, at least once in eight hours for 48 hours. If sound is found to be abnormal, plan for preventive maintenance and do the necessary corrective work.
Update the predictive maintenance record.
3. Work Instructions for Temperature Checking
Purpose: To check the machinery moving parts are in condition or not and to prevent breakdown. Responsibility: Assign Mechanical
Engineer/Fitter.
Instrument used: Non-contact type pyrometer. Checking place: Near the machine.
Checking interval: Monthly. Method of checking:
Clean the place where temperature is to be measured.
Focus non-contact type pyrometer at the place of temperature measurement.
Observe the temperature. If the temperature ranges from 55°C to 65°C, then the part is OK. If the temperature is more than 65°C, the part checked is NOT OK.
Conclusion:
If the temperature is more than the desired value, greasing/oiling has to be done. If there is no improvement after greasing or oiling, plan for preventive maintenance and do the necessary corrective work.
Update the predictive maintenance record.
4. Work Instructions for Fluid Checking
Purpose:To check the condition of the gear box oil. Responsibility: Assign Mechanical Engineer/Fitter. Instrument used: Viscous-stick.
Checking place: Near the machine.
Checking interval: Monthly. Method of checking:
o Collect the oil sample to be tested and also collect the fresh oil sample of the same grade.
o Pour both samples in the space provided in the Visco-stick head.
o Hold the head by one hand and press tail, allow the oil samples to flow towards the tail end and compare the level of both the samples. Fresh oil stops near the marking, for used oil marking is provided in two places - one below the marking of fresh oil and one above of it in the opposite side. If used oil level is more than the fresh oil level and within the lower marking, oil is found to be OK. If it is below the marking, oil is more viscous and not acceptable. If the oil level is more than the upper marking, oil is less viscous and not acceptable.
Conclusion:
If the oil is found to be more viscous or less viscous, replace it.
Update the predictive maintenance record.
VI. PREVENTIVE MAINTENANCE OF SPLICING PROCESS
The primary goal of Preventive maintenance is to prevent the failure of equipment before it actually occurs. Preventive maintenance is a schedule of planned maintenance actions aimed at the prevention of breakdowns and failures. It is designed to preserve and enhance equipment reliability by replacing worn components before they actually fail. PM activities include equipment checks, partial or complete overhauls at specified periods, oil changes, lubrication and so on. In addition, workers can record equipment deterioration so they know to replace or repair worn parts before they cause system failure. Recent technological advances in tools for inspection and diagnosis have enabled even more accurate and effective equipment maintenance. In order to develop an effective preventive maintenance program for a system following steps are considered:
First identify the operating condition:
Does the system operate 24 hours a day, 7 days a week? Does the system operate at maximum flow & pressure? Is system located in a dirty or hot environment?
International Journal of Emerging Technology and Advanced Engineering
Website: www.ijetae.com (ISSN 2250-2459, ISO 9001:2008 Certified Journal, Volume 3, Issue 8, August 2013)
122
What requirements & operating parameters does thecomponent manufacturer state concerning the particulate?
Past experience on the machine history to follow the procedure. What equipment history is available to verify the above procedures for the equipment?
A. Preventive Maintenance Program
1. Daily Visual Checks
Make a visual inspection of the machine and its area. Make sure that the machine and its area are clear from
tools, spare parts, scrap etc. which interfere with the safe operation.
Ensure that no components have been removed for maintenance during the previous shift.
Check for missing safety signs.
Check for oil level in the hydraulic unit- to be more than half in the oil level gauge
Blow out excess chalk and cutting at the end of every shift of operation.
Check tightness of screws on heat cable fastening the knife assembly.
Check cleanliness of guide shafts of table and knife movement and clean if necessary.
2. Weekly Checks
Clean wearing surfaces of tooling blocks and guides. Dismantle, clean and assemble bobbing blocks. Clear radiation fans of chalk powder.
Check condition of rubber facing on the jaws for damages and replace if necessary.
Observe the operation of the lubrication system. Check the delivery of grease to all points by observing movements of the indicators on injector's blocks. Visually check for actual delivery of grease to bearings
& gear teeth.
Lubrication levels of all the bearings.
Check the knife current valves and potentiometer functioning.
Check the gear box, motor, brake, bolts, etc. Tighten sufficiently if gone loose.
3. Monthly Inspection
Check location and operation of speed and current change over limit switches/ proximity switches
Check knife retract solenoid operation and modify if necessary.
Check tightness of all screws, nuts and bolts.
Check connection of knives with heat cable and clearances and rectify if necessary.
Check the pumps for lubrication.
Release the brake, inspect the linings and adjust the same.
Those for limit switch by nose pliers and ensure tightness of all connections.
4. Annual Inspection
Check the foundation bolts and their tightening. Oil change in the main gear drive unit. Visually inspect
the seals & replace as required. Take out the lubrication line accessories & clean them.
Inspect all hoses for abrasion, cracks & general conditions.
Examine all electrical components for proper contact & security of wiring connections.
Chemical cleaning of all the rolls.
Check insulation resistance of windings of motor and brake solenoids.
VII. RESULT AND DISCUSSION
Before implementation of predictive and preventive maintenance of splicing process the mean time between failure, equipment availability, and reliability was not meeting the requirements. And also downtime hours was quite high.
After implementation of predictive and preventive maintenance of splicing process the calculated values for mean time between failure, downtime, failure rate, equipment availability, reliability, maintainability rate is as follows
Reliability Assessment calculation for splicing machine in year march-13 to may-13
Total available time = 1953 hours Total number of breakdown = 27
Total machine downtime = 35 hours50 mins or 35.83 hours Total repair time = 21hrs 50 mins or 21.83 hours
Total number of maintenance actions = 27
Failure Rate (λ)
λ =
= 27/1953 = 0.0138
International Journal of Emerging Technology and Advanced Engineering
Website: www.ijetae.com (ISSN 2250-2459, ISO 9001:2008 Certified Journal, Volume 3, Issue 8, August 2013)
123
DowntimeDowntime =
= 35.83/1953 =
0.0183=1.83% Mean Time between Failure (MTBF)
MTBF = =
= 1/0.0138 =
72.46 hours Mean Time to Repair (MTTR)
MTTR =
= 21.83/27 = 0.8085
Hours = 49 mins
Maintenance Action Rate(µ)
µ = = 27/21.83 = 1.23 actions
per hour
Equipment Availability (Ae)
(Ae)=
= 0.9890 = 98.90%
Maintainability Rate (M)
After 1 hour, M = [1-e-(1.23x1)] = 70.70%
2 hour, M = [1-e-(1.23x2)] = 91.40%
3 hour, M = [1-e-(1.23x3)] = 97.52%
4 hour, M = [1-e-(1.23x4)] = 99.27%
Reliability (R)
R = e-( t)
After,
1 hour, R = e-(0.0138x1) = 98.62%
2 hour, R = e-(0.0138x2) = 97.27%
25 hour, R = e-(0.0138x25) = 70.82. %
50 hour, R = e-(0.0138x50) = 50.15%
100 hour, R = e-(0.0138x100) = 25.15%
150 hour, R = e-(0.0138x150) = 12.61%
200 hour, R = e-(0.0138x200) = 6.32%
250 hour, R = e-(0.0138x250) = 3.17%
[image:8.612.326.569.218.343.2]300 hour, R = e-(0.0138x300) = 1.59%
TABLE I
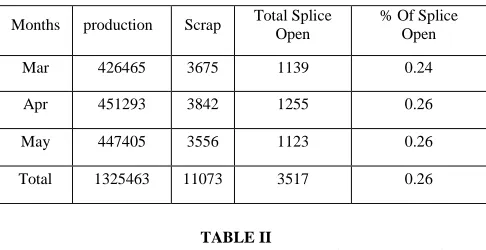
Splice Open Analysis in Machine Wise for theYear-Mar-May13
TABLE II
MTBF, Availability, Reliability, Downtime and Scrap Due To Splice open Factors Details of before and after Implementation
Factors
Before After
April-Dec, 2012 Mar- May,
2013
MTBF 40Hrs 72.46 Hrs
MTTR 56mins 49mins
Availability 97.7% 98.9%
Reliability 97.53% 98.62%
Downtime 2.55% 1.83%
Scrap due to splice open 0.36% 0.26%
VIII. CONCLUSION
This project work is intended to develop predictive and preventive maintenance program for tube splicing process, failure analysis and reliability assessment were carried out towards the minimization of the tube defects. Breakdown data of splicing machine has been analyzed and the repetitive problems are identified and the causes for these failures are determined by brainstorming technique. Root cause and action plan analysis charts were displayed at a prominent place near the splicing machine so that operator can operate the machine without any fault. Maintenance actions rates were determined effectively in a proper manner.
Months production Scrap Total Splice Open
% Of Splice Open
Mar 426465 3675 1139 0.24
Apr 451293 3842 1255 0.26
May 447405 3556 1123 0.26
[image:8.612.321.568.360.567.2]International Journal of Emerging Technology and Advanced Engineering
Website: www.ijetae.com (ISSN 2250-2459, ISO 9001:2008 Certified Journal, Volume 3, Issue 8, August 2013)
124
The reliability assessment of the machine was found to be 3.17% after 250 hours, and maintainability rate was around 99.27% after 4 hours, which means that maintenance was carried out more effectively. Also the MTBF was increased to 72.46 hrs, MTTR was reduced to 49 minutes and downtime of a machine was found to be 1.83% further enhancing the machine availability, which is around 98.90%.Before implementation the scrap due to splice open was around 0.33%, after implementation of predictive and preventive maintenance of splicing process scrap due to splice open is reduced to 0.26%.it indicating that rejection of tube defects were minimized. Study of failure data analysis and reliability assessment were made by calculating cost of repair, cost of inspection etc., and an optimal inspection frequency analysis was developed for the critical parts of machine to carry out predictive maintenance inspection to reduce the breakdown below the target level.REFERENCES
[1] Li Miaoqum ―Scheduling problems with preventive maintenance on two parallel production line‖ management service 2010
[2] Markov ―optimal predictive maintenance policy for multi-state deteriorating system under periodic inspection‖,2010
[3] M. Zamanzadeh, E. Larkin and D. Gibbon, ―A Re-Examination of Failure Analysis and Root Cause Determination‖, Matco Associates, 2004.
[4] Kijima‘s ―A Generic Model of Equipment Availability under Imperfect Maintenance‖ vol. 54, no. 4, December 2005