IJPSR (2017), Volume 8, Issue 8 (Research Article)
Received on 27 January, 2017; received in revised form, 17 May, 2017; accepted, 27 May, 2017; published 01 August, 2017
DEVELOPMENT OF A NEW STABILITY INDICATING RP-HPLC METHOD FOR
SIMULTANEOUS ESTIMATION OF METFORMIN HYDROCHLORIDE AND
CANAGLIFLOZIN AND ITS VALIDATION AS PER ICH GUIDELINES
V. Kommineni 1, K. P. R. Chowdary* 2 and S. V. U. M. Prasad 1
Sri Venkateswara College of Pharmacy 1, JNTUK, Kakinada - 533003, Andhra Pradesh, India.
Vikas Institute of Pharmaceutical Sciences 2, Near Airport, Rajahmundry - 533102, Andhra Pradesh, India. ABSTRACT: A new stability indicating RP HPLC method has been developed and validated for simultaneous estimation of Metformin Hydrochloride and Canagliflozin in bulk and dosage forms. The method involves separation on Kromasil C18 column (250mm x 4.6mm x5µm particle size). The optimized mobile phase consists of 0.1% OPA (pH 2.8) and Acetonitrile (45:55v/v) with a flow rate of 1ml/min and UV detection at 254mn. Retention time was 2.112 min (Metformin Hydrochloride), 2.671 min (Canagliflozin). Linearity range was 25-150ug/ml (Metformin Hydrochloride), 2.5-15ug/ml (Canagliflozin). Accuracy was in the range of 98.22-101.54% for both drugs. Precision was 0.63% and 0.65% for Metformin Hydrochloride and Canagliflozin. LOD and LOQ are 0.17ug/ml and 2.20ug/ml for Metformin Hydrochloride, 0.01ug/ml and 0.50ug/ml for Canagliflozin. The method developed is more sensitive, accurate and precise than the methods reported earlier. Retention time and run time were also less and hence the method is economical. When applied for tablet assay, drug content was within 98.55-101.4% of labelled content. Forced degradation studies indicated the suitability of the method for stability studies.
INTRODUCTION: Metformin Hydrochloride is an orally administered biguanide derivative used to lower blood glucose concentration in patients with noninsulin dependent diabetes mellitus 1. Metformin Hydrochloride improves insulin sensitivity and decreases insulin resistance by inhibiting Complex1 of the mitochondrial respiratory chain and inducing AMP activated protein kinase-dependent signalling.
QUICK RESPONSE CODE
DOI:
10.13040/IJPSR.0975-8232.8(8).3427-35
Article can be accessed online on:
www.ijpsr.com
DOI link: http://dx.doi.org/10.13040/IJPSR.0975-8232.8 (8).3427-35
Metformin Hydrochloride is chemically known as 1, 1Dimethylbiguanide mono-hydrochloride. Cana-gliflozin is an anti diabetic drug used to improve glycemic control in patients with type 2 diabetes. Canagliflozin is an inhibitor of subtype 2 sodium glucose transport protein (SGLT2), which is responsible for at least 90% of the glucose reabsorption in the kidney (SGLT1 being responsible for the remaining 10%) 2.
Canagliflozin is chemically known as (2S, 3R, 4R, 5S, 6R)- 2-{3- [5- [4- Fluoro- phenyl) -thiophen- 2- ylmethyl]- 4- methyl-phenyl-6-hydroxymethyl-tetra hydro-pyran-3,4,5-triol. Though several methods are reported in literature for the estimation of Metformin Hydrochloride 3 - 6 and Canagliflozin 7 - 10
individually, there are only few HPLC methods
Keywords:
Metformin Hydrochloride, Canagliflozin, RP-HPLC Method, Simultaneous estimation, Validation
as per ICH guidelines, Forced degradation studies
Correspondence to Author: Prof. K. P. R. Chowdary
Research Director,
Vikas Institute of Pharmaceutical Sciences, Near Airport, Rajahmundry - 533 102, Andhra Pradesh, India.
reported for the simultaneous estimation of Metformin Hydrochloride and Canagliflozin combination 11 - 14. The objective of the present study was to develop a novel, simple, accurate, precise, economic method for the simultaneous estimation of Metformin Hydrochloride and Canagliflozin and validate the method with forced degradation studies according to ICH guidelines 15. Experimental:
MATERIALS AND REAGENTS: HPLC grade acetonitrile (LichrosolR, Merck Lifesciences Pvt. Ltd., Mumbai, India), HPLC water (LichrosolvR Merck Life sciences Pvt. Ltd., Mumbai, India) Ortho phosphoric acid (Thermo Fischer Scientific Pvt Ltd., Mumbai, India), and sodium hydroxide (SD Fine - Chem. Ltd., Mumbai, India) were used in the study. The working standards of Metformin and Canagliflozin were generous gift obtained from Hetero Pharma Ltd., Hyderabad, India. Invokamet tablet containing Metformin Hydrochloride 500 mg and Canagliflozin 50mg was kindly supplied by Janssen pharmaceuticals, Inc.
Instrumentation: Chromatography was performed on a Waters 2695 HPLC column (waters corporation, Mildord, USA) with an auto-sampler and equipped with a 2996 series of PDA detector with a spectral bandpass of 1.2nm. Components were detected using UV and that processing was achieved by Empower 2 software. A hot air oven was used for thermal degradation of the samples and a UV cross inker, with series of 23400 model UV chamber, equipped with a UV fluorescence lamp with the wavelength range between 200 and 300nm was selected for photolytic degradation. Ultrasonic bath (Toshcon by Toshniwal), digital pH meter (Systronics model 802) were used in the study.
Chromatography Conditions: The chromatographic condition was performed on Kromosil C18 column (250 X 4.6mm, 5µm particle size) at an ambient column temperature. The samples were eluted using 0.1% Ortho phosphoric acid (pH adjusted to 2.8 with NaoH): Acetonitrile (45:55v/v) as the mobile phase at a flow rate of 1 ml/min the mobile phase and samples were degassed by ultra sonication for 20 min and filtered through 0.45µm Nylon (N66) 47mm membrane filter. The measurements were carried out with an injection
volume of 10μL, flow rate was set to 1.0 mL/min, and UV detection was carried out at 254 nm. All determinations were done at ambient column temperature (27 °C). The chromatograms of the prepared standard stock solutions of Metformin and Canagliflozin were recorded under optimized chromatographic conditions (Fig. 1).
Diluent: Water and Acetonitrile in 50:50 v/v ratio. Preparation of Standard Solutions:
Stock Solution of Metformin: Standard stock solution of Metformin Hydrochloride was prepared by dissolving 25mg of Metformin Hydrochloride in 25 ml of diluent (Water: Acetonitrile, 50:50 v/v) in a 25 ml clean dry volumetric flask and the standard solutions was filtered through 0.45 μm nylon membrane filter and degassed by sonicator to get the concentration of 1000 µg/ml of Metformin Hydrochloride. The above standard stock solution suitably diluted with diluents to obtain various concentrations of Metformin Hydrochloride.
Stock Solution of Canagliflozin: Standard stock solution of Canagliflozin was prepared by dissolving 2.5mg of Canagliflozin in 25ml of diluent (Water: Acetonitrile, 50:50 v/v) in a 25ml clean dry volumetric flask and the standard solutions was filtered through 0.45μm nylon membrane filter and degassed by sonicator to get the concentration of 100µg/ml of Canagliflozin. The above standard stock solution suitably diluted with diluents to obtain various concentrations of Canagliflozin.
Working Standard Solution: Working standard solution of Metformin Hydrochloride and Canagliflozin was prepared by taking 1ml of stock solutions of Metformin and Canagliflozin in to clean dry 10ml volumetric flask and make up volume with diluent to get a concentration of 100µg/ml of Metformin and 10µg/ml of Canagliflozin.
sample solution suitably diluted to get a concentration of 100µg/ml of Metformin Hydrochloride and 10µg/ml of Canagliflozin.
RESULTS AND DISCUSSION:
Optimization of Chromatographic Conditions: Proper selection of the method depends upon the nature of the sample (ionic or ionisable or neutral molecule), its molecular weight, and solubility. Metformin Hydrochloride and Canagliflozin were dissolved in polar solvent, so the developed method of estimation was carried out on reverse phase high performance liquid chromatography. To develop a rugged and suitable HPLC method for the quantitative determination of Metformin and Canagliflozin, the analytical conditions were selected after the consideration of different parameters such as diluents, buffer, buffer concentration, organic solvent for mobile phase and mobile phase composition, and other chromatographic conditions.
Preliminary trials were taken with different composition of buffer and organic phase of mobile phases with pH range of 2.5–5. The column selection has been done by backpressure, resolution, peak shape, theoretical plates, and day-to-day reproducibility of the retention time and resolution between Metformin and Canagliflozin peak. After evaluating all these factors, a Kromosil C18 column was found to be giving satisfactory results. The selection of acetonitrile and buffer were based on chemical structure of both the drugs. The acidic pH range was found suitable for solubility, resolution, stability, theoretical plates, and peak shape of both components. Best results were obtained with 0.1% O-phosphoric acid pH adjusted to 2.8 with sodium hydroxide solution that improved the peak shapes of Metformin Hydrochloride and Canagliflozin.
For the selection of organic constituent of mobile phase, acetonitrile was chosen to reduce the longer retention time and to attain good peak shape. Therefore, final mobile phase composition consisting of a mixture of buffer - pH 2.8 (0.1% ortho phosphoric acid): Acetonitrile (60:40 v/v). Flow rates between 0.5 to 1.2ml/min were tried. Flow rate of 1ml/min was observed to be enough to get both the drugs eluted within less than 10 min.
The column temperature was set at 30 °C. Optimized method was providing good resolution and peak shape for Metformin Hydrochloride and Canagliflozin. Under above described experimental conditions, all the peaks were well defined and free from tailing.
The concern of small deliberate changes in the mobile phase composition, flow rates, and column temperature on results were evaluated as a part of testing for methods robustness.
Validation of Method Developed: The proposed method was validated according to the ICH guidelines 15 for system suitability, specificity, recovery, precision, linearity, robustness, limit of detection (LOD) and limit of quantification (LOQ). Under the validation study, the following parameters were studied.
System Suitability: The Retention time of Metformin Hydrochloride and Canagliflozin using optimum conditions was 2.13 min and 2.66 min respectively. For two of them, the peak symmetries were < 1.5 and the theoretical plate’s numbers were > 2000 and % RSD of areas of six standard injections of Metformin Hydrochloride and Canagliflozin was less than 2. These values are within the acceptable range of United States pharmacopoeia definition and the chromatographic conditions. The results obtained are shown in Table 1.
TABLE 1: SYSTEM SUITABILITY RESULTS OF
METFORMIN HYDROCHLORIDE AND CANAGLIFLOZIN
Parameter Metformin
Hydrochloride
Canagliflozin
Peak area 924091 (0.61%)* 187002 (0.72%)* Theoretical plates 2599.3±0.861 7491.83±0.641
Retention time 2.13±0.031 2.66±0.057 Tailing factor 1.22±0.04 1.28±0.06 *RSD (%)
FIG. 1: OPTIMIZED CHROMATOGRAM OF METFORMIN HYDROCHLORIDE AND CANAGLIFLOZIN
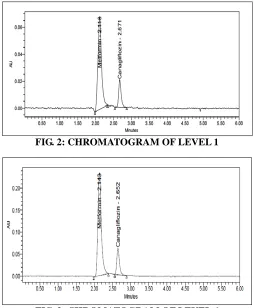
[image:4.612.312.566.53.361.2]Linearity and Range: Linearity was assessed for the two oral anti diabetic drugs at concentration ranges 25-150μg/ml for Metformin Hydrochloride and 2.5-15μg/ml for Canagliflozin. The Chromatograms of level 1 and level 6 are shown in Fig. 2 and Fig. 3. A linear relationship was established at these ranges between Area under the peak (AUP) and concentration. Good linearity was proved by high values of coefficient of determinations(Fig. 4 and Fig. 5).The results were tabulated in Table 2.
FIG. 2: CHROMATOGRAM OF LEVEL 1
FIG. 3: CHROMATOGRAM OF LEVEL 6
TABLE 2: LINEARITY DATA OF METFORMIN HYDROCHLORIDE AND CANAGLIFLOZIN Level Concentration of Metformin
Hydrochloride (µg/ml)
Peak area Concentration of Canagliflozin (µg/ml)
Peak area
1 25 265031 2.5 54588
2 50 490445 5 98368
3 75 724680 7.5 143504
4 100 938891 10 189612
5 125 1162631 12.5 238251
6 150 1382624 15 284210
FIG. 4: LINEARITY GRAPH OF METFORMIN HYDROCHLORIDE
Limit of Detection (LOD) / Limit of Quantitation (LOQ): The LOD was determined on the basis of signal to noise ratios and was determined using analytical response of three times the background noise. LOQ was determined as the lowest amount of analyte that was reproducibly
quantified above the baseline noise following triplicate injections. Both LOQ and LOD were calculated on the peak area using the following equations:
[image:4.612.46.300.56.182.2]LOQ= 10 x N/ B LOD= 3 x N/ B
[image:4.612.53.479.382.668.2] [image:4.612.318.566.565.730.2]The limit of detection and limit of quantification were evaluated by serial dilutions of Metformin Hydrochloride and Canagliflozin stock solution in order to obtain signal to noise ratio of 3:1 for LOD and 10:1 for LOQ. The LOD value for Metformin Hydrochloride and Canagliflozin was found to be 0.17μg/mL and 0.01μg/mL, respectively, and the LOQ value 2.20μg/mL and 0.50μg/mL, respectively.
Precision:
[image:5.612.48.567.176.327.2]System Precision: System Precision was carried to ensure analytical system is working properly. One dilution of both the drugs in six replicates was injected into HPLC system and was analyzed and the results were found within the acceptance limits (RSD < 2) as shown in the Table 3 below.
TABLE 3: SYSTEM PRECISION DATA FOR METFORMIN HYDROCHLORIDE AND CANAGLIFLOZIN
Metformin Hydrochloride Canagliflozin
S. No
Concentration (µg/ml)
Retention time (min)
Peak Area Concentration
(µg/ml)
Retention time (min)
Peak Area
1 100 2.104 918397 10 2.665 185725
2 100 2.114 926677 10 2.668 188192
3 100 2.103 928636 10 2.664 187958
4 100 2.108 919625 10 2.672 186091
5 100 2.116 933152 10 2.674 185409
6 100 2.111 921164 10 2.675 187565
Average 924609 Average 186823
SD 5810 SD 1221
% RSD 0.6 % RSD 0.7
Method Precision (Repeatability): Precision is expressed as the closeness of agreement between a series of measurements obtaining from multiple sampling of the same homogeneous sample. Six replicate injections of a known concentration of sample preparation of Metformin (100μg/mL) and
Canagliflozin (10μg/mL) have been analyzed by injecting them into a HPLC column on the same day and on consecutive days. From the results obtained, % RSD was calculated and was found to be within the limits (< 2). The results of precision are given in Table 4.
TABLE 4: METHOD PRECISION DATA FOR METFORMIN HYDROCHLORIDE AND CANAGLIFLOZIN
Metformin Hydrochloride Canagliflozin
S. No
Concentration (µg/ml)
Peak Area % Assay Concentration
(µg/ml)
Peak Area % Assay
1 100 911508 99.3 10 189490 99.22
2 100 939016 100.2 10 187952 100.54
3 100 908096 100.4 10 181626 100.41
4 100 940019 99.4 10 186148 99.41
5 100 924217 100.9 10 187708 99.05
6 100 921693 99.6 10 189087 100.2
Average 924092 99.96 Average 187002 99.8
SD 13390 0.63 SD 2883 0.65
% RSD 1.45 0.63 % RSD 1.5 0.651
TABLE 5: RUGGEDNESS DATA FOR METFORMIN HYDROCHLORIDE
Laboratory-1 (% Assay)-HPLC-1 Laboratory-2 (% Assay)-HPLC-2
Analyst-1 Analyst-2 Analyst-1 Analyst-2
Concentration (μg/ml) Day-1 Day-2 Day-1 Day-2 Day-1 Day-2 Day-1 Day-2
100 99.28 99.68 99.67 99.45 99.43 99.64 100.02 99.86
100 99.46 100.21 99.41 99.42 99.54 99.43 99.42 100.02
100 99.54 99.62 99.46 99.34 99.28 99.01 99.27 99.52
100 99.89 99.46 100.14 99.86 99.45 99.45 99.48 99.54
100 100.29 99.84 100.07 100.23 100.23 100.08 99.59 100.05
100 100.03 100.14 99.21 100.14 100.03 100.12 99.76 99.92
Average 99.75 99.83 99.66 99.74 99.66 99.62 99.59 99.82
SD 0.38 0.30 0.38 0.39 0.38 0.42 0.27 0.23
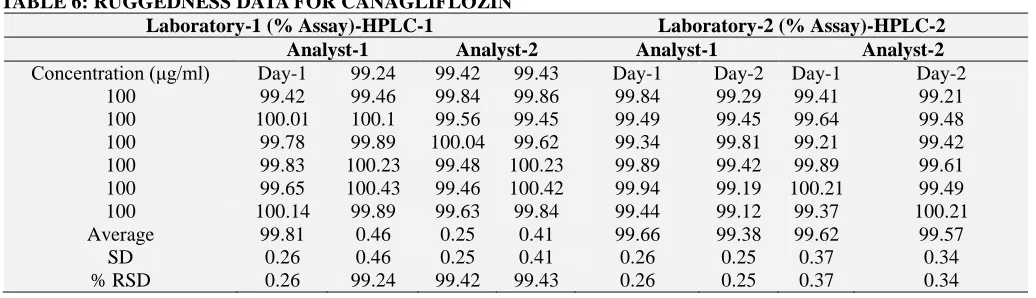
[image:5.612.53.568.433.744.2]Ruggedness: Intermediate precision was accessed injecting sample preparation of Metformin (100 μg/mL) and Canagliflozin (10μg/mL) in six replicates in to HPLC column on the same day and
[image:6.612.48.566.125.274.2]on consecutive days and in different laboratories by different analysts. Results were found within the acceptance limits (RSD < 2) as shown in the Tables 5 and 6 below.
TABLE 6: RUGGEDNESS DATA FOR CANAGLIFLOZIN
Laboratory-1 (% Assay)-HPLC-1 Laboratory-2 (% Assay)-HPLC-2
Analyst-1 Analyst-2 Analyst-1 Analyst-2
Concentration (μg/ml) Day-1 99.24 99.42 99.43 Day-1 Day-2 Day-1 Day-2
100 99.42 99.46 99.84 99.86 99.84 99.29 99.41 99.21
100 100.01 100.1 99.56 99.45 99.49 99.45 99.64 99.48
100 99.78 99.89 100.04 99.62 99.34 99.81 99.21 99.42
100 99.83 100.23 99.48 100.23 99.89 99.42 99.89 99.61
100 99.65 100.43 99.46 100.42 99.94 99.19 100.21 99.49
100 100.14 99.89 99.63 99.84 99.44 99.12 99.37 100.21
Average 99.81 0.46 0.25 0.41 99.66 99.38 99.62 99.57
SD 0.26 0.46 0.25 0.41 0.26 0.25 0.37 0.34
% RSD 0.26 99.24 99.42 99.43 0.26 0.25 0.37 0.34
Accuracy: The percentage recovery was calculated by preparing standard drug concentrations of Metformin hydrochloride and Canagliflozin with concentration levels of 50%, 100% and 150%. A known amount of the standard drug was added to the blank sample at each level. Good recovery of
the spiked drugs was obtained at each added concentration, and the mean percentage recovery of Metformin hydrochloride and Canagliflozin was achieved between 99.42–100.81 ± 0.753% and 99.53-100.16 ± 0.327. The results are given in Tables 7 and 8.
TABLE 7: RECOVERY DATA OF METFORMIN HYDROCHLORIDE
Sample name Amount added (µg/ml) Amount found (µg/ml) % Recovery Statistical Analysis
S1:50% 50 49.71 99.42 Mean=99.42% (n=3)
S2:50% 50 50.3 100.62 S.D=1.20
S3:50% 50 49.1 98.22 % RSD=1.2
S4:100% 100 100.69 100.69 Mean=100.62%(n=3)
S5:100% 100 101.65 101.66 S.D=1.08
S6:100% 100 99.49 99.5 % RSD=1.1
S7:150% 150 151.93 101.29 Mean=100.81%(n=3)
S8:150% 150 150.69 100.46 S.D=0.43
S9 :150% 150 151.01 100.68 % RSD=0.4
TABLE 8: RECOVERY DATA OF CANAGLIFLOZIN
Sample name Amount added (µg/ml) Amount found (µg/ml) % Recovery Statistical Analysis
S1:50% 5 4.98 99.63 Mean=100.16%(n=3)
S2:50% 5 4.96 99.30 S.D=1.21
S3:50% 5 5.07 101.54 % RSD=1.2
S4:100% 10 9.95 99.56 Mean=99.53%(n=3)
S5:100% 10 10.09 100.09 S.D=0.57
S6:100% 10 9.89 98.95 % RSD=0.6
S7:150% 15 15.03 100.24 Mean=100%(n=3)
S8:150% 15 14.80 98.69 S.D=1.20
S9 :150% 15 15.15 101.06 % RSD=1.20
Robustness: Robustness of the proposed analytical method is a measure of its capacity to remain unaffected, and it reflects the reliability of the analysis with respect to deliberate changes in the parameters such as flow rate (1.0 ± 0.2mL), column temperature (30 ± 5 °C), mobile phase ratio of the
TABLE 9:ROBUSTNESS (CHANGE IN FLOW RATE) FOR METFORMIN HYDROCHLORIDE AND CANAGLIFLOZIN
Drug
Change in Flow rate (ml/min)
Change in flow Rate (0.8ml/min to 1.2 ml/min)
%Assay SD % RSD
Metformin Hydrochloride
0.8 99.5 1.6 1.6
1 100.62 1.08 1.1
1.2 99.4 1.5 1.5
Canagliflozin 0.8 99.4 1.4 1.4
1 99.53 0.57 0.6
1.2 100.23 1.3 1.29
TABLE 10: ROBUSTNESS (CHANGE IN MOBILE PHASE COMPOSITION) FOR METFORMIN HYDROCHLORIDE AND CANAGLIFLOZIN
Drug
Change in mobile phase
Change in Mobile phase (0.8ml/min to 1.2 ml/min)
%Assay SD % RSD
Metformin Hydrochloride
10% less organic phase 99.3 1.4 1.4
Actual 100.62 1.08 1.1
10% more organic phase 99.6 1.5 1.5
Canagliflozin 10% less organic phase 99.8 1.3 1.3
Actual 99.53 0.57 0.6
10%more organic phase 100.13 1.2 1.1
TABLE 11: ROBUSTNESS (CHANGE IN COLUMN TEMPARATURE) FOR METFORMIN HYDROCHLORIDE AND CANAGLIFLOZIN
Drug
Change in column temperature
Change in Column temperature
%Assay SD % RSD
Metformin Hydrochloride
25°C 99.42 1.20 1.2
30°C 100.28 1.06 1.06
35°C 100.62 1.08 1.1
Canagliflozin 25°C 100.16 1.21 1.2
30°C 99.53 0.57 0.6
35°C 100.81 0.43 0.4
Forced Degradation Studies: The assay method was used to test the drug stability by conducting forced degradation studies for the drug substances under various stress conditions. Stress degradation studies were carried out for acid hydrolysis (1M HCl heated for 30 min at 60 °C), alkali hydrolysis (2N NaOH heated for 30 min at 60 °C), oxidative
[image:7.612.49.567.317.410.2]degradation (20% H2O2 heated at 60 °C for 30 min) and thermal degradation (samples placed in an oven at 105 °C for 6 hr). For photolytic stress studies, samples were exposed to UV light by keeping them in a UV chamber for 7 days. Results are shown in Tables 12 and 13.
TABLE 12: FORCED DEGRADATION STUDIES OF METFORMIN HYDROCHLORIDE
Sample Name Degradation (%) Purity Angle Purity Threshold
Unstressed Sample --- 0.345 0.452
Thermal Stress Sample 0.9 0.290 0.477
Photolytic Stress Sample 0.4 0.360 0.459
Water Stress Sample 0.2 0.355 0.456
Acid Degradation 2.5 2.045 3.090
Alkali Degradation 1.6 7.315 7.502
Peroxide Degradation 1.3 1.21 1.402
TABLE 13: DEGRADATION STUDIES OF CANAGLIFLOZIN
Sample Name Degradation (%) Purity Angle Purity Threshold
Unstressed Sample --- 1.112 1.571
Thermal Stress Sample 0.95 1.488 1.509
Photolytic Stress Sample 0.21 1.224 1.365
Water Stress Sample 0.11 1.122 1.572
Acid Degradation 3.39 1.424 1.556
Alkali Degradation 2.71 1.338 1.711
[image:7.612.48.563.537.751.2]The retention time of Metformin Hydrochloride and Canagliflozin was found to be 2.112 min and 2.611 min respectively with resolution of 3.24. Linearity was established for Metformin Hydrochloride and Canagliflozin in the range of 25-150µg/ml for Metformin Hydrochloride and 2.5-15µg/ml for Canagliflozin with correlation coefficients (r2= 0.999) and the percentage recoveries were between 98.22 % to 100.69% and 98.69% to 101.54% for Metformin Hydrochloride and Canagliflozin respectively, which indicate accuracy of the proposed method. The % RSD values of accuracy for Metformin Hydrochloride and Canagliflozin were found to be < 2 %. The % RSD values of method precision are 0.63% and 0.65% for Metformin Hydrochloride and Canagliflozin respectively and % RSD values of system precision are 0.6% and 0.7% for Metformin Hydrochloride and Canagliflozin. The % RSD values of reproducibility are 0.41% and 0.34% for Metformin Hydrochloride and Canagliflozin respectively, reveal that the proposed method is precise. LOD values for Metformin Hydrochloride and Canagliflozin were found to be 0.17µg/ml and 0.01µg/ml respectively and LOQ values for Metformin Hydrochloride and Canagliflozin were found to be 2.20µg/ml and 0.50µg/ml respectively was shown in The % RSD values of robustness studies were found to be < 2% reveal that the method is robust enough was shown in (Table 10, 11 and 12). These data show that the proposed method is specific and sensitive for the determination of Metformin Hydrochloride and Canagliflozin.
CONCLUSION: RP-HPLC method for the
simultaneous estimation of Metformin Hydrochloride and Canagliflozin in their combine dosage form was established and validated as per the ICH guidelines. Linearity was achieved for Metformin Hydrochloride and Canagliflozin in the range of 25-150µg/ml for Metformin Hydrochloride and 2.5-15µg/ml for Canagliflozin with correlation coefficients (r2=0.999). The percentage recoveries of Metformin Hydrochloride and Canagliflozin were achieved in the range of 98.2-101.4% which was within the acceptance criteria. The percentage RSD was NMT 2% which proved the precision of the developed
sensitive, rapid, linear, precise, rugged, accurate, specific, and robust.
ACKNOWLEDGEMENT: I express my sincere thanks to Dr. M. Bhagavan Raju, Principal for his support and encouragement throughout my research work. I am also thankful to Sri Venkateshwara College of Pharmacy for providing the chemicals and instruments and Hetero Pharma Pvt. Ltd., Hyderabad, India for providing the drug samples for research.
DISCLOSURE STATEMENT: The authors report no conflicts of interest. The authors alone are responsible for content and writing of this article.
REFERENCES:
1. Bailey CJ, Path MRC and Turner RC: Drug Therapy: Metformin. New England Journal of Medicine 1996; 334: 574-579.
2. Chao EC: Canagliflozin. Drugs of the Future 2011; 36(5): 351-357.
3. Nilam P, Pinkal P and Khushbu S: Development and validation of analytical method for simultaneous estimation of Miglitol and Metformin hydrochloride in tablet dosage form. International Journal of Pharmaceutical Sciences and Research 2014; 24: 4820-4824.
4. Kumar AP, Aruna G, Rajasekar K and Reddy PJ: Analytical method development and validation of Alogliptin and Metformin hydrochloride tablet dosage form by RP-HPLC method. International Bulletin of Drug Research 2013; 3(5): 58-68.
5. Gadipally S: Method Development of Metformin Hydrochloride RP-HPLC. World Journal of Pharmacy and Pharmaceutical Sciences 2014; 3(3): 1149-1159. 6. Chhetri HP, Thapa P and Schepdael AV: Simple
HPLC-UV method for the quantification of metformin in human plasma with one step protein precipitation. Saudi Pharmaceutical Journal 2014; 22(5): 483–487. 7. Kaur I, Wakode S and Singh HP: Development and
Validation of UV Spectroscopic Method for Determination of Canagliflozin in Bulk and Pharmaceutical Dosage Form. Pharm Methods 2015; 6(2): 82-6.
8. Muzaffar INY, Khalil AM, Alanazi Khalid A and Rashood A: A simple and sensitive high performance liquid chromatography assay with a fluorescence detector for determination of canagliflozin in human plasma. Analytical Methods 2015; 7: 3028-3035. 9. Kaur I, Wakode S and Singh HP: Development and
Validation of a Stability-Indicating High Performance Thin Layer Chromatography (HPTLC) Method for estimation of Canagliflozin in bulk and Pharmaceutical Dosage Form. Journal of Applied Pharmaceutical Science 2016; 6(5): 051-057.
11. Panigrahy UP and Reddy ASK: A novel validated RP HPLC DAD method for the simultaneous estimation of Metformin Hydrochloride and Canagliflozin in bulk and pharmaceutical tablet dosage form with forced degradation studies. Oriental Journal of Chemistry 2015; 31(3): 2231-5039.
12. Gaware D, Patil RN and Harole M: A Validated Stability Indicating Rp-Hplc Method for simultanious determination of metformin and canagliflozin in pharmaceutical formulation. World Journal of Pharmacy and Pharmaceutical Sciences 2015; 4(12): 631-640.
13. D-Douza S, Krishna M, Sushmitha GS and Vasantharaju SG: Stability Indicating Assay Method
Development and Validation to Simultaneously Estimate Metformin Hydrochloride and Canagliflozin by RP-HPLC. Current Trends in Biotechnology and Pharmacy 2016; 10(4): 334-342.
14. Reddy NP and Naga Thirumalesh C: RP-HPLC Method development and validation for the
Simultaneous Estimation of Metformin and Canagliflozin
in Tablet Dosage Form. International Journal of Pharma Sciences 2015; 5(4): 1155-1159.
15. Validation of Analytical Proceudures, ICH Harmonised Tripatite Guidelines, Q2 B 1997.
All © 2013 are reserved by International Journal of Pharmaceutical Sciences and Research. This Journal licensed under a Creative Commons Attribution-NonCommercial-ShareAlike 3.0 Unported License.
This article can be downloaded to ANDROID OS based mobile. Scan QR Code using Code/Bar Scanner from your mobile. (Scanners are available on Google Playstore)
How to cite this article: