6127
TRACKING COMMUNITY EVOLUTION IN SOCIAL
NETWORKS
1LOUBNA BOUJLALEB, 2ALI IDARROU, 3DRISS MAMMASS
1,2,3Laboratory IRF-SIC, Faculty of sciences, University Ibn Zohr, Agadir, Morocco
E-mail: 1[email protected],{2ali.idarrou, 3driss.mammass}@uiz.ac.ma
ABSTRACT
Recently, social network analysis is gaining on importance and bringing several challenges in the computer science discipline. Most social networks are dynamic and evolve gradually and the communities in these dynamic networks usually have changing members and could grow and shrink over time. The analysis of communities and their evolution is a relevant research domain that attracts researchers from a variety of fields; having suitable information and methods for dynamic analysis, one may challenge to forecast the future of the communities, and then conduct it appropriately in order to attain or modify this predicted future according to precise requirements. This capability would be a strong mechanism used by marketing, human resource managers, personnel recruitment, etc. In this paper, we are analyzing the changes in the dynamic network through tracking and examining the dynamic evolution of communities within a sequence of snapshots. We start by describing some basic dynamic features of social networks. Then, we propose a new technique called CED (Community Evolution Detection) which was developed in order to detect community evolution in the social network. The central elements of this technique are that it greatly depends on key nodes and QuantityInsertion metric. It also focuses on both efficiency and parameter free. We demonstrate the abilities and potential of our approach by testing it in real datasets and compare it with well-known algorithm with regard to complexity, accuracy and flexibility.
Keywords: Community Evolution, Dynamic Network Analysis, Dynamic Social Network, Evolutionary Analysis, Community Dynamics
1. INTRODUCTION
A social network is a social structure generally modeled as a graph where the nodes represent the social entities (e.g., people) and links describe social interactions (e.g., friendship, collaboration). Social network analysis has been an interesting subject in the field of data mining and has attracted many researchers from different communities such as sociology [1], epidemiology [2], recommendation systems [3], email communication [4], criminology [5] etc. One of the most important problems in network analysis is the identification of community structure, the division of network nodes into subgroups, within which nodes are densely connected while between which they are sparsely connected [6]. The analysis of communities may help find out the structural features of the networks and simplify applications as targeted marketing and advertising [7], and discovering influential individuals [8].
Early studies in analyzing social networks rely on the static properties by modeling the dynamic network as a static graph and discarding the temporal information. This static picture misses the opportunity to detect the evolutionary behavior of the network and the communities. The most existing real-life networks tend to change dynamically and evolve over time. New links may appear all the time due to the network growth or his change over time. So it is interesting to focus the analysis of social networks to the dynamics of these relations in order to better understand the evolution of the interactions between people. This analysis is done through tracking the progress of communities over time in a dynamic scenario.
6128 tool to face many real-world difficulties that arise in marketing, personal recruitment, politics, public security domains, etc. For instance, in marketing, it can be associated with the analysis of possible effect during the announcement of a new product or services, e.g., why some inducements decrease user connections in web-based customer support services. In politics, it can encircle an observation of impacts of given political programs or individual politicians on some social communities and the analysis of influence evolution in time. Principally, it can be used to guide collective reactions to the course of election campaign or to the introduction of changes in the law. In public security affairs, the observation of the community evolution can ease the recognition of users or communities who spread or support unsafe or criminal ideas and comportment, e.g., terrorism.
The evolution of communities in dynamic social networks can be tracked by identifying critical events that characterize the changes in a community over time. In this paper, we present a simple but effective model for efficiently tracking and assessing the evolution and structure of communities over several time frames in a dynamic network, where the life-cycle of each community is characterized by a series of critical states. Based on the community states by matching communities found at consecutive time frames, we identify evolution chains that contain community states in the previous snapshots and its historical transitions. Different from other approaches, the method may combine information from either non-overlapping or overlapping communities and it is free from the selection of the underlying community detection algorithm.
In order to evaluate our approach, we have considered two mobile social network datasets Gowalla and Brightkite by performing experiments into several time frames. The experiment indicates that our method performs well on this data where it identifies events that are omitted by other methods. This gap of results may represent a potential predictor of future behavior.
This paper is organized as follows: In the next section, we provide a brief overview of some related and previous research in the area of dynamic community evolution. Section 3 defines the basic concepts used by our method .The problem formulation is presented in Section 4. The experimental study and results are given in Section 5. Section 6 presents a summary and future work.
2. RELATED WORK
There are many studies about community detection [9][6]. The traditional and much known graph clustering method consists on finding for a given graph, an optimal partitioning of a predefined number n of homogeneous communities. [11] [12]. The graph partitioning has important limitations that have conducted researchers to community detection problem.
Community detection methods are generally categorized into two main classes: static methods and dynamic methods. In both classes, there are methods that consider overlapping communities while others consider non-overlapping methods. The static methods may be categorizes into two main classes: optimization based algorithms and heuristic based algorithm. The dynamic methods can be classified into four main categories: Successive static detections, simultaneous study of all stages of evolution, informed successive static detection and methods working on temporal networks. Lately, the temporal evolution of social networks has concerned many scientists. Optimization based algorithms resolves a community detection issue by converting it into an optimization problem and essaying to find an excellent solution with respect to an objective function already defined (The maximization of some quality index), such as various cut criteria implemented by spectral methods [13][14][15], the evaluation function introduced by the Kernighan-Lin algorithm [16], the network modularity used in numerous algorithms [17][18][19][20] and others [21]. On the other hand, heuristic algorithms do not clearly deal with optimization purposes, and they solve a community detection problem founded on assured natural assumptions or heuristic directions. For instance, the heuristic rule used in the maximum flow community (MFC) algorithm [22] is based on the assumption that “flows” through intercommunity links should be larger than those of intra-community links. Similarly, the heuristic rule employed by the GN algorithm [17] is that the “edge betweenness” of inter-community links should be larger than that of intra-community links. Others such as the Wu-Huberman algorithm [23], the HITS algorithm [24], the CPM [25], and the FEC [26] have adopted different assumptions.
6129 evolve deeply and observe a fast growth in terms of size and space over time , it is useful to consider the fact that connections may be transitory and some network characteristics may change at many time periods. Hence, it is significant to study network evolution and consider a set of snapshots in order to evaluate how the network evolves over time and accordingly discover changes in links between nodes.
Many researches have started working on detecting critical events that track the evolution of communities in dynamic social networks. MONIC framework [27] proposed a generalized evolution study approach to [28]. First, the communities are extracted at each snapshot by using any classical static community detection algorithm. Then, to study the evolution of communities at each snapshot, a many to many matching is applied in order to map communities of the snapshot Ci to communities Ci-1 based on their maximum overlap and an overlap threshold. Also, the authors define numerous rules to handle other cases such as merging, splitting, birth and death of communities. [30] proposed a method that finds events by using Clique Percolation Method (CPM) community detection [29] on a graph made by the communities extracted at two successive time frames. Then, events related to the communities are specified according to the output of the community detection algorithm. [31] state critical events between extracted communities at two successive time frames which are implemented in the structure of bit operations. However, these events do not consider all of the states that can happen for a specific community. [32] defines a weighted bipartite matching to map communities and then described each community by a sequence of events. [33] proposed an event-based framework to consider all the moves from one state to another between communities at two successive time frames. In a later work [34], the event definition formula is enhanced to monitor the transitions of communities over the complete observation time, not only between two successive time frames.
After analyzing the methods presented in the above, we notice that they are three criteria that differentiate between them. The first criterion is the number of other time frames that is used to discover the events relating communities at a given timeframe; there are two possibilities: either using all previous time frames or consecutive time frames. The second criterion is the number of event categories which are continuing, shrinking,
growing, splitting, merging, death and birth. The last criterion is the way of matching communities which could be either one-to-one matching, many-to-many matching or other community detection method such as clique percolation method. Moreover, we note that the most challenge about tracking these dynamic networks is to provide a method that freely scales to networks containing millions of nodes and tens of thousands of communities and fit with overlapping and non-overlapping communities.
From the above considerations, our community evolution tracking method should include matching communities from consecutive snapshots during the identification of events; the matching should be one-to-one and include all categories of events. Moreover, our approach should not require any thresholds or parameters.
3. BASIC CONCEPTS
3.1 Dynamic Social Network
A social network is often represented by a graph, G=(V, E), where V is the set of nodes and E is the set of edges in the network. A dynamic network is a network in which V or E changes over time and demonstrated as a series of graphs {G1,G2, …,Gn }, where Gi=(Vi,Ei) represents the graph at snapshot i, which comprises Vi vertices and Ei interactions. The ni communities detected at the ith snapshot are then denoted by Ci = {C , C ,…, C }, where community C ∈ C is also a graph denoted by (V , E ).
6130
Figure 1:An example of dynamic social network
containing four snapshots
3.2 Community operations (Community evolution)
When network evolves over time, different community operations may appear. The two main operations are growth and contraction, corresponding to the addition and removal of nodes from an existing community. Then, we observe the birth and death of communities: as the network evolves, new communities may emerge, and old communities may disappear. Finally, we can identify two operations that are a little more complex: fusion and division. During time, two communities may become similar. They are then merged into one. In a complementary way, a community can be divided into two new communities, smaller than the community from which they originated.
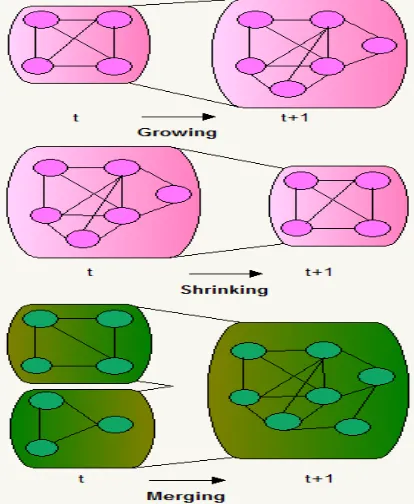
Community evolution is a succession of events following each other in the sequential snapshots within the social network. [30] and [31] have suggested some kinds of events but their lists were inadequate. Consequently, in this article, the possible list of events in social community evolution was prolonged. Seven independent classes of events have been recognized altering the state of a community or communities between two subsequent time frames (see Figure 2):
Figure 2:Seven community evolution events
Continuing
A community continues its presence, when two communities in the successive snapshots are the same or when two communities vary only by few nodes but their size keeps the same.
Shrinking
A community shrinks when some nodes have quiet the community, making its size reduced than in the preceding snapshot. A community may shrink slightly, i.e. by some nodes or significantly mislaying a greatest part of its participants.
Growing
(opposite to shrinking): A community becomes larger when some new members have become a part of the community, making its size greater than in the preceding snapshot. A community may evolve slightly as well as significantly, doubling or even tripling its size.
Splitting
[image:4.612.92.299.445.697.2]6131 unequal split when one of the final communities has much greater involvement in the splitting community, which in turn for this greater community could be like to shrinking.
Merging
(Opposite of splitting) A community is formed by merging some other communities when one community from snapshot Ti-1 consists of two or more communities from the preceding snapshot Ti. We notice two types of merge (1) equal, when the involvement of all source snapshots in the merged, target community is almost the same, or (2) unequal, if one of the communities has much greater influence into the merged community.
Death (dissolving)
Dissolving occurs when a community stops its life and does not happen in the next snapshot at all, i.e. its participants have disappeared or stopped communicating with each other and are dispersed among the rest of the communities.
Birth (forming)
Creation of the new community (opposite to death) happens when a community, which was not present in the preceding snapshot Ti, appears in next snapshot Ti+1. When a community stays passive over numerous snapshots, such situation is considered as death of the first community and birth again of the second, new one.
4. PROBLEM STATEMENT
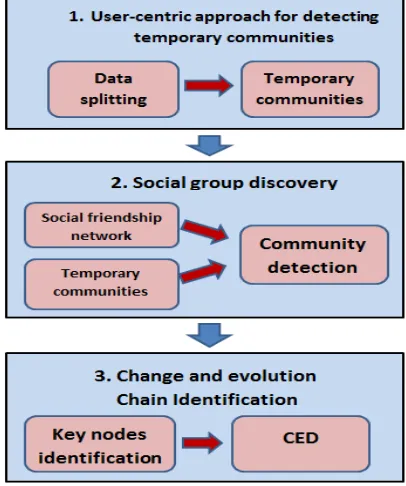
To study community evolution, one must first detect the communities by means of any clustering method in different particular periods. In this paper, we are using the community detection method used in our previous work [35] [41] in order to produce set of communities in each snapshot. Our community detection approach is divided into step 1 and step 2 as illustrated in Figure 3 which describes the three main steps required for the study of social community evolution. The first step consists on proposing an approach of clustering semantic information based on spatio-temporal data [41]. First, we divide the mobile social network into different time period snapshots. During each snapshot, we have used a density-based clustering algorithm (ST-DBSCAN) in order to identify groups according to spatiotemporal data which we interpret as equivalent to social perspective communities. However, ST-DBSCAN algorithm is not enough to characterize community structures since links
between actors are not taken into account by the clustering algorithm. Henceforth, we have applied well known random graph models in order to add links that interconnect individuals within a perspective community for finally representing the community structure. Those perspective communities are constructed based on temporary links created between a set of actors during a time window. Principally, we assume that individuals can have temporary ties that might disappear later.
[image:5.612.318.521.419.662.2]The second step consists on proposing a community detection algorithm [35] by integrating the perspective communities from the step 1. It is about injecting the perspective communities from a mobile social network into an initial friendship network within a sequence of snapshots. In other words, during each snapshot, we built an augmented friendship social network using the semantic information extracted from perspective communities. This semantic information is integrated by changing the weight of friendship network links according to the perspective communities. Then, after the augmented friendship social network is built, a detection community algorithm is applied which results on communities that may be part of several networks in a given time period.
Figure 3:The three main steps for the study of social community evolution
6132 and T+1. Particularly, there exists a community in snapshot T and what about its state in the following time frame T + 1. Does it divide into a minor ones or fuse into a bigger one with another community? It is about detecting events such as growing, merging, death and so on. A new technique called CED (Community Evolution Detection) was developed in order to detect community evolution in the social network. The central elements of this technique are: it greatly depends on key nodes and QuantityInsertion metric. This metric allows evaluating the inclusion of one community in another. In other words, how many members from community C are in community C ? Consequently, QuantityInsertion QI(C1,C2) of community C1 in community C2 is computed as follows:
QI( , )=| ∩ |
| | (1)
In the following section, the algorithm of key node detection is firstly introduced and then we present our core-based algorithm of tracking community evolution.
4.1 Key Node Detection Algorithm
As covered earlier, key nodes are significant in our evolution algorithm that is why their selection is of greatest importance. We believe that key nodes play a good stable quality element since the key nodes do not appear unexpectedly without any evidence in the past snapshots.
Since the structure of a community is excessively dynamic and changeable, it is very difficult to fix an experimental threshold to differentiate key nodes from regular ones. Contrasting to [36], our technique focuses on both efficiency and also parameter free. In order to find out community key members, several techniques have been suggesting quantifying the nodes’ centrality measures such as degree, betweenness, paging rank and so on. Normally, the higher a node's centrality measure is, the more central it is in a community. In our method, a node Ni is given a key value SP(Vn) by computing its social position. For complete information about social position metric, how to compute and implement it refer to [37] [38] [39] [40].
In brief, for each vertex Vi, we compare its social position value with the one of its neighbor, if SP(Vi) is higher than the social position of SP(Vj), then Vi is considered more essential than Vj, so Vi’s key value should be incremented by the difference of social position value of both nodes, on the other hand, Vj’s value is decremented by the same value. After going through all the edges, if Vi’s key value is positive, it is considered as a key node. If not, it is just a normal node. The pseudo-code of the algorithm is described in Algorithm1.
4.2 Key-based Algorithm of Detecting Community Evolution
The fact that employing community quantity insertion and centrality social position for identifying the changes within the community gives our algorithm a great gain over other techniques; it respects both the quantity and quality of community members. The quality is guaranteed by the detection of key members, while the quantity is reflected by the QuantityInsertion metric. Really, this method offers equilibrium between the communities that contain only little but more important members and communities with many of less core members. It is expected that only one event can happen for two communities (C , C ) in the successive snapshots; but, one community in snapshot t can take part in many events with several communities in t+1.
Algorithm 1 Algorithm KeyNodeDetection
Input:a community C with n vertices
Output: the set of key nodes of C
Compute the social position of each node in C
if SP(V1)= SP(V2)= …= SP(Vn) then
Return C
end if
key(V1)=0, k ∈ [1,n]
for every edge e ∈ Edge (C) do
Vl, Vk are nodes connected with e
if SP(Vk) < SP(Vl) then
key(Vk) = key(Vk) - | SP(Vk) -SP(V1) |
key(Vl) = key(V1) + | SP(Vk)-SP(V1) |
end if
if SP(Vk)>= SP(Vl) then
key(Vk) = key(Vk) + | SP(Vk)-SP(V1) |
key(Vl) = key(V1) - | SP(Vk)-SP(V1) |
end if end for
keyset = {}
for every node Vi∈ Vertex(C) do
if key(Vk)>=0 then
input Vk into keyset;
end if end for
6133 The process for the Community Evolution Detection Technique (CED) is described by the algorithm2.
Algorithm 2 Community Evolution Detection
Input: Output:
KeyDet(C )=KeyNodeDetection(C )
for every community in snapshot t + 1 do if QI( , ) = QI( , ) and | | = | | then
Communities ‘continuing’;
else if QI( , ) < QI( , ) and | | > | | and QI( , ) =1 and
KeyDet( ) ∩ Node( ) ≠ Ø then (there is only one matching event between and all communities in the previous snapshot Ti)
Communities ‘shrinking’;
else if QI( , ) > QI( , ) and | | < | | and KeyDet( ) ∩ Node( ) = | KeyDet( )| then
Communities ‘growing’; (there is only one matching event between and all communities in the next snapshot Ti+1)
else if QI( , ) > QI( , ) and | | > | | and KeyDet( ) ∩ Node( ) ≠ Ø then
Communities ‘splitting’; (there is more than one matching event between and all communities in the previous snapshot Ti)
else if QI( , ) < QI( , ) and | | < | | and KeyDet( ) ∩ Node( ) ≠ Ø then
Communities ‘merging’; (there is more than one matching event between and all communities in the next snapshot Ti+1)
else if QI( , ) ≠ QI( , ) and
Node( ) ∩ KeyDet ( ) = Ø and
KeyDet( ) ∩ Node( ) = Ø then
Communities ‘Birth’;
else if QI( , ) ≠ QI( , ) and
KeyDet( ) ∩ KeyDet ( ) = Ø and
KeyDet( ) ∩ KeyDet ( ) = Ø then (for in Ti and each communities in Ti+1)
Communities ‘Death’;
5. EXPERIMENTAL STUDY
5.1 Experimental Datasets
We execute experiments to assess our algorithm on real social network dataset; we are using two real datasets: Gowalla and Brightkite. Gowalla is a location-based social network created in 2009: users are able to check-in at places through their mobile devices; Check-ins are shared with friends. The Gowalla dataset [32] is a 196,591 users' friendship network. The check-in data were collected from February 2009 to October 2010 and each user has 32.8 check-in records on average. Brightkite is a location-based social network created in 2007: users are able to check-in at places through their mobile devices; Brightkite users can establish mutual friendship links and they can push their check-ins to their Twitter and Facebook accounts. We study a dataset collected in September 2009 which includes the whole Brightkite user base at that time, with information about 54,190 users.
In the dataset, a check-in record is a tuple <userid, check-in time, latitude, longitude, location id>. Here latitude and longitude denotes the latitude and longitude of the location where the user visited, and check-in time denotes the time stamp of the check-in activity. Each user in the dataset has a check-in list which contains a location sequence and a time-stamp sequence.
We are studying active users whose number of check-ins is greater than 50. The reason of choosing this number is to capture important characteristics of users’ behaviors through check-in activities. We set the snapshots to be one month each for a period of one year.
5.2 Evaluation measures
On both these datasets, we compare our method CED (community evolution detection) with another event-based framework GED (The method for group evolution discovery).
5.2.1 The number of identified events
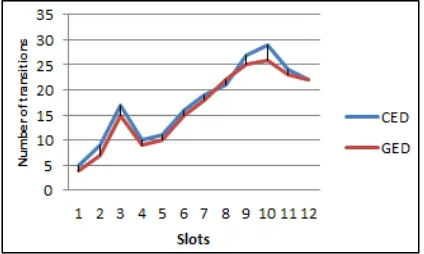
6134 events is higher than the other events for both datasets and in both methods: CED and GED.
[image:8.612.313.520.144.266.2]Figure 4:Distribution of the event types using CED
Figure 5:Distribution of the event types using GED
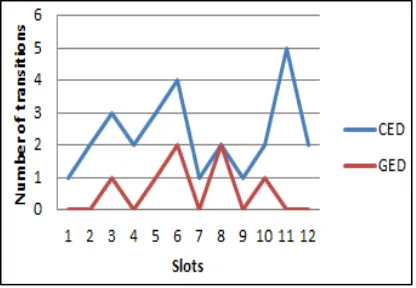
The Figures 5-11 represent the amounts of different types of event transitions recognized by both algorithms CED and GED in the corresponding time slots using Gowalla dataset.
[image:8.612.90.298.245.440.2]Continuing: Figure 5 illustrates the number of transitions associated to communities without change (continuing). Our method discovered more events of this category.
Figure 6:Distribution of continuing event
Shrinking: Figure 6 describes the number of transitions related to community shrinking. Our method discovered more events of this category.
Figure 7:Distribution of shrinking event
[image:8.612.314.522.358.502.2]Growing: Figure 7 presents the number of transitions corresponding to community growing. Our method discovered more events of this category.
Figure 8:Distribution of growing event
[image:8.612.291.519.567.699.2]Splitting: Figure 8 demonstrates number of transitions associated to community splitting.
[image:8.612.90.307.598.703.2]6135
Merging: Figure 9 illustrates the number of transitions associated to community merging. Our method discovered more events of this category.
Figure 10:Distribution of merging event
[image:9.612.90.302.144.271.2]Dissolving: Figure 10 shows the number of transitions associated to community dissolving. Our method discovered more events of this category.
Figure 11: Distribution of dissolving event
Forming: Figure 11 presents the number of transitions associated to community merging. Our method discovered more events of this category.
Figure 12: Distribution of forming event
5.2.2 Events discovered by our method CED and not discovered by GED
Table 1 illustrates the events that our method CED has identified and GED method has not. GED did not find those events because the approach is based on two parameters: alpha and beta (See [10] for complete description). The entire events not found by the GED method have both inclusions beneath 50%, which was reflected in the value for alpha and beta thresholds. To demonstrate this, the GED method was computed once more with thresholds equal to 10%. The result shows that only few events identified by our method were absent in the GED method.
Table 1: Events that CED has discovered (CEDF) and
GED has not found (GEDNF) and Total no. of distinct
events found by both methods (DE) Total no. of
events found No. of events
CEDF
Total no. DE DataSet CED GED CED GED CED
& GED Gowalla 428 412 46 77 441 Brightkite 407 389 38 69 423
Using the event transitions extracted earlier between two consecutive snapshots, an evolution chain may be produced for each community Ci from Tn. Such chain contains all other previous communities from the preceding snapshots (Tn-1, Tn-2, Tn-3, etc.) the current community Ci comes from. Generally, it may occur that a community has been formed from two or more other communities—through merging. For instance, community Ci+3 came into being from Ci+1 and Ci+2. In such case, two separate evolution chains are being created for Ci+3, one with community Ci+1 and one with Ci+2.
[image:9.612.90.302.349.484.2] [image:9.612.91.299.561.690.2]6136
Table 2: The number of evolution chains for particular chain length: CED
Chain
Length Gowalla Brightkite
2 3 4 5 6 7 8 9 10 860 705 594 480 316 222 105 78 59 820 677 521 419 306 203 97 66 43
Table 3: The number of evolution chains for particular event type and particular chain length (CL) in Gowalla
CED CL Co ntin in g Shri nking Gr owi ng Sp littin g Mer gi ng Dissol vin Forming 2 3 4 5 6 7 8 9 10 150 98 86 72 64 55 47 36 32 249 190 163 123 94 87 71 62 56 217 202 193 184 176 168 154 140 131 96 88 72 68 61 54 46 38 32 136 129 103 95 84 72 69 62 54 4 3 2 2 1 1 1 0 0 8 8 5 3 3 1 0 0 0
5.2.3 Differences between our method CED and the method GED
Our method is faster on computing results rather than GED method and greatly depends on key nodes. Moreover, it is implemented with free parameters. However, the GED method depends heavily on two parameters α and β. Those parameters need full control and impact the number of events obtained which proves the large gap in the attained results.
The above considerations approve that the CED method is better than GED method for both non-overlapping and overlapping community detection methods.
6. CONCLUSION
One of the challenging research problems in dynamic social networks is to extract communities and analyze their evolution over time. In this article, we overviewed different dynamic
community detection approaches. We then provide a method which monitors the changes in the dynamic network through tracking and examining the dynamic evolution of communities within a sequence of snapshots. In other words, we propose a model to capture all the possible events that may occur for communities. This approach will help comprehend the mechanisms leading the growth and changeability of social communities. The strengths of our community evolution discovery method are the following: it was designed to be parameter-free, conserves the low and adaptable computational complexity and is appropriate to determine fusion and division events. Simultaneously, it was designed to fit in both overlapping and disjoint communities. However, our challenge is to scale in large network. Our experiment is using a real-life datasets in order to analyze the soundness and feasibility of this technique. Our future work will be extending our present work by predicting the future changes of the communities based on the present and precedent events.
REFERENCES:
[1] S. Wasserman, and K. Faust, ”Social Network Analysis: Methods and Applications”, Cambridge University Press, 1994.
[2] L. Meyers, M. Newman and B. Pourbohloul, “Predicting on directed contact networks”, Journal of Theoretical Biology, 240, 2006, pp. 400–418.
[3] J. Palau, M. Montaner, B. L´ opez and J. L. de la Rosa, “Collaboration analysis in recommender systems using social networks”, Proceedings of the 8th International Workshop on Cooperative Information AgentsCIA ’04, 2004, pp. 137–151. [4] J. R. Tyler, D. M. Wilkinson and B. A. Huberman, “Email as spectroscopy: Automated discovery of community structure within organizations”, In Communities and technologies, 2003, pp. 81–96.
[5] A. Calvo-Armengol and Y. Zenou, “Social Networks and Crime Decisions: The Role of Social Structure in Facilitating Delinquent Behaviour”, CEPR Discussion Papers 3966, 2003.
[6] M. E. J. Newman and M. Girvan, “Finding and evaluating community structure in networks”, Physical Review E,69, 026113, 2004.
6137 SIGKDD international conference on Knowledge discovery and data miningKDD ’03, 2003, pp. 137-146.
[8] T. Y. Berger-Wolf and J. Saia, “Critical Groups in Dynamic Social Networks”, DIMACS Technical Report, 2005.
[9] S. FORTUNATO, “Community detection in graphs”, Phys. Rep. 486, 3–5, 2010, pp. 75–174. [10] P. Bródka, P. Saganowski, P. Kazienko, “GED: The Method for Group Evolution Discovery in Social Networks”, Social Network Analysis and Mining, 2012, DOI:10.1007/s13278-012-0058- [11] BW. Kernighan, S. Lin, “An Efficient Heuristic
Procedure for Partitioning Graphs”, The Bell system technical journal 49(1), 1970, pp: 291– 307.
[12] M. Fiedler, “Algebraic connectivity of graphs”, Czech Math J 23, 1973, 298–305.
[13] J. Shi and J. Malik, “Normalized Cuts and Image Segmentation”, IEEE Transactions on Pattern Analysis and Machine Intelligence 22(8), 2000, pp: 888–905.
[14] L. Hagen, and A.B. Kahng, “New spectral methods for ratio cut partition and clustering”, IEEE Trans. on Computer-Aided Design, Vol. 11, No. 9, 1992, pp.1074-1085. [15] A. Pothen, H. Simon, and K.P. Liou,
“Partitioning Sparse Matrices with Eigenvectors of Graphs”, SIAM J. of Matrix Analysis and Application, Vol. 11, 1990, pp. 430-452 [16] B.W. Kernighan, and S. Lin, “An Efficient
Heuristic Procedure for Partitioning Graphs”, Bell System Technical, Vol. 49, 1970, pp. 291-307
[17] M. Girvan and M. E. J. Newman. “Community structure in social and biological networks”, In Proceedings of National Academy of Sciences. USA, vol. 99, no. 12, 2002, pp: 7821–7826.
[18] M. E. J. Newman, “Fast algorithm for detecting community structure in networks”, Phys. Rev. E 69, 2003.
[19] A. Clauset, M. E. J. Newman, and C. Moore, “Finding community structure in very large networks”, Phys. Rev. E 70, Aug 2004. [20] M. G. Gong, M. Jing-Jing, ”Community
Detection in Dynamic Social Networks Based on Multiobjective Immune Algorithm”, Journal of computer science and technology 27(3), May 2012, pp: 455- 467.
[21] J. Reichardt and S. Bornholdt, “Detecting fuzzy community structures in complex
networks with a potts model”, Phys. Rev. Let., Vol. 93, No. 19, 2004, pp.218701
[22] G. W. Flake, S. Lawrence and C. L. Giles, “Efficient identification of web communities,” in Proceedings of ACM Conference on Knowledge and Data Discovery (KDD 2000), 2000, pp. 150–160.
[23] W. Chang-Dong, L. Jian-Huang, S. Y. Philip, “NEIWalk: Community Discovery in Dynamic Content-Based Networks”, IEEE transactions on knowledge and data engineering, Vol. 26, No. 7, July 2014.
[24] S. Gregory, “An algorithm to find overlapping community structure in networks”, Proceedings of the 11th European Conference on Principles and Practice of Knowledge Discovery in Databases, 2007, pp. 91–102. [25] I. Nagehan, G. O. Sule, “Community Event
Prediction in Dynamic Social Networks”, proceedings 12th IEEE International Conference on Machine Learning and Applications, 2013, pp. 191 -196.
[26] G.S. Thakur, R. Tiwari, M.T. Thai, S.S. Chen, A.W.M. Dress, “Detection of local community structures in complex dynamic networks with random walks”, published in IET Syst. Biol., vol 3, issue 4, 2009, pp. 266–278.
[27] M. Spiliopoulou, I. Ntoutsi, Y. Theodoridis, and R. Schult, “Monic : modeling and monitoring cluster transitions”, Proceedings of the 12th ACM SIGKDD international conference on Knowledge discovery and data mining, ACM New York, NY, USA, 2006, pp: 706–711. [28] J. Hopcroft, O. Khan, B. Kulis, and B. Selman,
“Tracking evolving communities in large linked networks”, Proceedings of the national academy of sciences of the United States of America, 101(Suppl 1), 2004, pp:5249-5253.
[29] G. Palla, D. Abel, I. Derényi, I. Farkas, P. Pollner and T. Vicsek, “K-clique percolation and clustering in directed and weighted networks”, Bolayai Society Mathematical Studies, 2005.
[30] G. Palla, AL. Baraba´si, T. Vicsek, “Quantifying social group evolution”, Nature, 2007, pp:446:664–667.