IJPSR (2012), Vol. 3, Issue 10 (Research Article)
Received on 25 May, 2012; received in revised form 21 July, 2012; accepted 19 September, 2012
FORMULATION OF COATED TABLETS OF DRY HAWTHORN EXTRACT AND THE DEVELOPMENT AND VALIDATION OF AN RP-HPLC METHOD FOR EVALUATING IT’S IN VITRO DISSOLUTION
M.O. Aggrey 1, 2, Z. Liu 1, 2*, R. Zhang 1, 2, C.I. Okeke 1, 2, L. Ma 1, 2, N. Li 1, 2 and L. Li 1, 2
Tianjin State Key Laboratory of Modern Chinese Medicine 1, 88 Yuquan Road, Tianjin 300193, P.R. China
Engineering Research Center of Modern Chinese Medicine Discovery and Preparation Technique 2,Ministry of Education, Tianjin 300193, P.R. China
ABSTRACT
Extracts of hawthorn (Crateagus sp.) have been indicated in the treatment of cardiovascular diseases, however, tablets produced from dry extract due to a multiple of factors such as inconsistent botanical ingredients, moisture content and hygroscopicity turn to be hard with prolong disintegration. Dissolution test is increasingly being employed for the assessment of solid herbal medicinal dosage form due to its ability to predict the bioavailability of active therapeutic agent from herbal products. The aim of this study was to formulate coated tablets containing dry extracts of hawthorn leafs and flowers and to develop and validate a reverse phase high performance liquid chromatography (RP-HPLC) method for assessing in vitro dissolution profile of hawthorn tablet. Comparative extraction procedure studies showed that percolating the plant material with ethanol and extracting with ethyl acetate produce extract with the highest amount of total flavonoids calculated either as rutin or hyperoside and the highest hyperoside content. Assessment of two disintegrating agents; Sodium starch glycolate (SSG) and cross-linked polyvinyl pyrrolidone (PVPP) showed that PVPP was a better agent for this formulation. Disintegration time also improved when distilled water was used as granulation fluid compared to alcoholic solutions. The disintegration time of coated tablets (CT), CT1 and CT2 were 8.83±0.41min and
9.33±0.52min respectively. The RP-HPLC method was validated as per ICH guidelines. The validation studies demonstrated that the proposed method is simple, selective, accurate and reliable and can be used for routine dissolution analyses of hawthorn tablets. The dissolution profile of the formulated tablets showed Q-values of 89.952% and 86.3765% for CT1 and
CT2 respectively.
INTRODUCTION: Tablets of Hawthorn (Crataegus pinnatifida Bge (Rosaceae)), extract is indicated in chest constrictions, stabbing pericardial pain, angina pectoris and palpitation 1. The use of hawthorn in cardiovascular diseases has been shown to be common in most cultures 2.
It has also been shown to have anti diabetic, antioxidant, anti-inflammatory and a mild to moderate sedative effect 3-7. These biological activities have been attributed to the phenolic component such as quercetin, isoquercitrin, chlorogenic acid, vitexin-4// -O-glucoside, vitexin-2//-O-rhamnoside, vitexin, rutin and
Keywords: Hawthorn, Hyperoside, Dissolution, RP-HPLC, Validation
Correspondence to Author: Z. Liu
Associate Professor, Tianjin State Key Laboratory of Modern Chinese Medicine, 88 Yuquan Road, Tianjin, P.R. China
E-mail: [email protected] QUICK RESPONSE CODE
IJPSR: ICV- 4.57
The rate of disintegration can be the rate-limiting step in the dissolution process and it’s particularly important for the dissolution of drugs from coated dosage forms 11. Slow or incomplete disintegrations reduce the bioavailability of active substances12. Dry herbal extract often increase tablet hardness and prolong disintegration time largely due to its hygroscopic nature and thus present a major problem in tablet formulation 13-16.
For quality control purposes, dissolution tests are frequently conducted for synthetic drugs but scarcely used for herbal products 17and this has been stated to be problematic 18-21. Certain conditions and manufacturing processes can limit drug release and affect its pharmacological activity 22. Absorption of drugs is controlled by their dissolution and variation in dissolution can lead to variation in their therapeutic or toxic effects 23, thus the need for evaluating the dissolution profile of herbal products.
To maximize the opportunity and overcome challenges associated with herbal medicines, new technologies to modernize their preparations are being evaluated24 and employing these new technologies and processes can ensure the efficacy and safety of herbal products
25
. Dissolution of herbal products may add to the innovative processes in the pharmaceutical industry 26. The goal of the present study was to develop coated hawthorn tablet with suitable disintegrating time and to develop and validate a RP-HPLC method for assessing its dissolution.
MATERIALS AND METHODS:
Materials: Microcrystalline cellulose (MCC) PH-101 was obtained from Shandong Liaocheng A Hua Pharmaceutical (China), Sodium Starch Glycolate (SSG) from Sheridan & Sons (Germany), Cross-linked Polyvinyl Pyrrolidone (PVPP) from ISP Technologies, INC, (USA), Rutin 98% HPLC grade and Hyperoside 98% HPLC grade from Biotech (China), Tetrahydrofuran HPLC grade was obtained from Concord Technology (China) and Tianjin Guangfu Fine Chemical Research Institute (China). Dried leafs and flowers of hawthorn (Crateagus pinnatifida) was obtained from the local market.
All chemicals and reagents was of analytical grade.
Methods:
1. Identification of Plant Material: The dried plant material was identified by thin layer chromatography 1 (TLC). Rutin and hyperoside was used as reference samples. The reference samples was dissolved in ethanol to prepare a 0.1mg/ml solution of each. 2g of powdered plant material was decocted under reflux for 1.5 h with 50mls of dilute ethanol TS (52.9mls of 95% ethanol diluted to 100ml with distilled water) in a round bottom flask. It was filtered and the ethanol completely removed in vacuo. 10mls of distilled water was added and washed two times with 20ml of petroleum ether (30-60oC).
The aqueous portion was then extracted twice with 20ml of ethyl acetate and ethyl acetate extract evaporated to dryness. The residue was then dissolved in 2ml of ethanol and used as the test solution. Using a polyamide plate and a mixture of ethanol, acetone and water in the ratio 7:5:6 as the mobile phase, 2ul of the samples was applied and developed. After development, the plate was dried in air and sprayed with aluminum chloride in ethanol TS. It was then dried under hot air and examined under UV light at 365nm.
2. Extraction of Hawthorn leaves and flowers:
Hawthorn leaves and flowers was extracted with distilled water, 45% ethanol and 70% ethanol to obtain three different solvent liquid extract E1, E2, E3
respectively. 150g of hawthorn leafs and flowers was decocted under reflux for 1.5h twice (1: 8 drug to solvent ratio). The extracts were then combine and concentrate in a rotary evaporator in vacuo at 40oC for the ethanol extracts and 50oC for the aqueous extract. The concentrates were placed on a water bath to completely evaporate solvent. It was further dried in a vacuum oven at 50oC for 5h to obtain dried extracts DE1, DE2, and DE3 of E1, E2, E3
respectively. A fourth dried extract, DE4, was
The extract was concentrated to a density of 1.01 and diluted with an equal volume of water. It was then washed with 0.167 volume of petroleum ether (60-90oC). The petroleum ether layer was discarded and the aqueous layer extracted with 0.7 volume of ethyl acetate 1. The ethyl acetate extract was concentrate at 40oC in vacuo in a rotary evaporator and placed on a water bath to completely remove the solvent. It was further dried in a vacuum oven at for 5h at 50oC. A second batch of raw material was obtained and extracted by the CH.P method described above and coded DE5. The dried extracts
were grinded using a mortar and pestle into fine powders and sieved through No. 80 sieve.
3. Moisture content: The percentage moisture contents of the dry powdered extracts were determined using Sartorius MA100 infrared moisture content analyzer.
4. Assay for Total Flavonoids as Rutin 1: Rutin was dissolved in ethanol to obtain reference solution containing 0.2mg/ml. To 1, 2, 3, 4, 5, and 6ml of reference solution in a 25ml volumetric flask, 1ml of 5% solution of Sodium nitrite was added. After 6min, 1ml of 10% solution of Aluminum nitrate was added and allowed to stand for another 6min after which 10ml of Sodium hydroxide TS was added and then made up to the 25ml mark with distilled water. The absorbance was measured after 15min at 500nm using a corresponding reagent solution as blank. Absorbance was plotted against concentration to obtain the standard curve.
0.15g of DE1, DE2, DE3, DE4 and DE5 was added to
25ml of dilute ethanol TS in separate stopped conical flasks, ultrasonicated for 5min and allowed to stand for 3h after which it was filtered. 2ml of filtrates were then transferred into 25ml volumetric flasks and distilled water was added to volume to serve as test solutions. 2ml of test solutions were transferred into separate 25ml volumetric flask and 4ml of distilled water added to each. 1ml of 5% solution of Sodium nitrite was added and after 6min 1ml of 10% solution of Aluminum nitrite added. After another 6min, 10ml of Sodium hydroxide TS was added and distilled water added to make the volume.
Distilled water was added to 2ml of each test solution in a 25ml volumetric flask to serve as the corresponding blank. The absorbance was measure in triplicate at 500nm.
The percentage content of total flavonoids in each extract was then calculated.
5. Assay for Total Flavonoids as Hyperoside 27: Stock solutions were prepared by dissolving 0.10g of extracts in 100ml of ethanol. To assay an extract, 5ml of its stock solution was evaporated in vacuo to dryness in a round-bottom flask. The residue was dissolved in 8ml of a mixture of 10 volumes of methanol and 100 volumes of glacial acetic acid and transfer into 25ml volumetric flask. The round-bottom flask was rinsed with 3ml of the same mixture and transferred into the 25ml volumetric flask. 10ml of a solution containing 25g/L of boric acid and 20g/L of oxalic acid in anhydrous formic acid was added and made to volume with anhydrous acetic acid.
The absorbance was measured after 30min at 410nm using a compensation liquid as blank. The percentage content of total flavonoids calculated as hyperoside was determined from the expression:
A x 1.235 m
Taking specific absorbance to be 405nm.
A = absorbance at 410nm; m = mass of the extract examined in grams.
6. Percentage content of Hyperoside in extracts by RP-HPLC: The external standard method of reverse phase high performance liquid chromatography (RP-HPLC) was use for the assay using COMETRO 6000 HPLC system under the following conditions: column, Diamonsil C18 (200mm X 4.6mm, 5µm); UV
7. Formulation of Tablets: Tablets were compressed to contain 64mg of dried extracts, (the minimum
dose prescribe by the CH.P)by the wet granulation method using the formulation table below (Table 1). To prepare granules, the extract and MCC were mixed by passing it through No. 80 sieve for 20 times. The granulation fluid was added, mixed well and the wet mass passed through No. 18 sieve.
[image:4.612.30.588.181.659.2]The wet granules were dried at 40oC for 2 h in an oven. Agglomerates were eliminated by forcing the dried granules through No. 20 sieve. The disintegrating agent was added, mixed well and the lubricant added. The formulation was then compressed using a single punch tablet machine with a spherical punch of diameter 10mm.
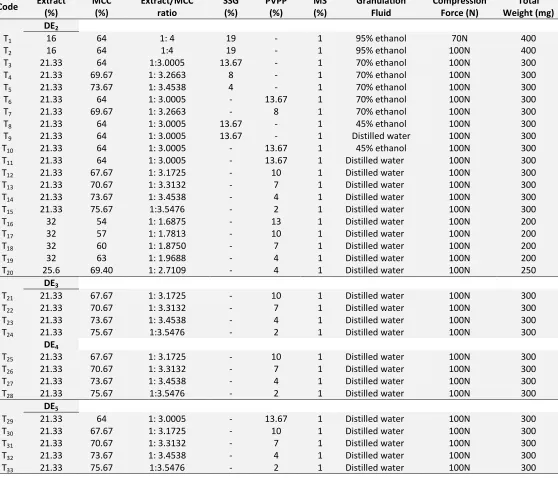
TABLE 1: FORMULATION OF TABLETS Code Extract
(%)
MCC (%)
Extract/MCC ratio
SSG (%)
PVPP (%)
MS (%)
Granulation Fluid
Compression Force (N)
Total Weight (mg) DE2
T1 16 64 1: 4 19 - 1 95% ethanol 70N 400
T2 16 64 1:4 19 - 1 95% ethanol 100N 400
T3 21.33 64 1:3.0005 13.67 - 1 70% ethanol 100N 300
T4 21.33 69.67 1: 3.2663 8 - 1 70% ethanol 100N 300
T5 21.33 73.67 1: 3.4538 4 - 1 70% ethanol 100N 300
T6 21.33 64 1: 3.0005 - 13.67 1 70% ethanol 100N 300
T7 21.33 69.67 1: 3.2663 - 8 1 70% ethanol 100N 300
T8 21.33 64 1: 3.0005 13.67 - 1 45% ethanol 100N 300
T9 21.33 64 1: 3.0005 13.67 - 1 Distilled water 100N 300
T10 21.33 64 1: 3.0005 - 13.67 1 45% ethanol 100N 300
T11 21.33 64 1: 3.0005 - 13.67 1 Distilled water 100N 300
T12 21.33 67.67 1: 3.1725 - 10 1 Distilled water 100N 300
T13 21.33 70.67 1: 3.3132 - 7 1 Distilled water 100N 300
T14 21.33 73.67 1: 3.4538 - 4 1 Distilled water 100N 300
T15 21.33 75.67 1:3.5476 - 2 1 Distilled water 100N 300
T16 32 54 1: 1.6875 - 13 1 Distilled water 100N 200
T17 32 57 1: 1.7813 - 10 1 Distilled water 100N 200
T18 32 60 1: 1.8750 - 7 1 Distilled water 100N 200
T19 32 63 1: 1.9688 - 4 1 Distilled water 100N 200
T20 25.6 69.40 1: 2.7109 - 4 1 Distilled water 100N 250
DE3
T21 21.33 67.67 1: 3.1725 - 10 1 Distilled water 100N 300
T22 21.33 70.67 1: 3.3132 - 7 1 Distilled water 100N 300
T23 21.33 73.67 1: 3.4538 - 4 1 Distilled water 100N 300
T24 21.33 75.67 1:3.5476 - 2 1 Distilled water 100N 300
DE4
T25 21.33 67.67 1: 3.1725 - 10 1 Distilled water 100N 300
T26 21.33 70.67 1: 3.3132 - 7 1 Distilled water 100N 300
T27 21.33 73.67 1: 3.4538 - 4 1 Distilled water 100N 300
T28 21.33 75.67 1:3.5476 - 2 1 Distilled water 100N 300
DE5
T29 21.33 64 1: 3.0005 - 13.67 1 Distilled water 100N 300
T30 21.33 67.67 1: 3.1725 - 10 1 Distilled water 100N 300
T31 21.33 70.67 1: 3.3132 - 7 1 Distilled water 100N 300
T32 21.33 73.67 1: 3.4538 - 4 1 Distilled water 100N 300
T33 21.33 75.67 1:3.5476 - 2 1 Distilled water 100N 300
8. Friability: Friability of the tablets was measured as the percentage of weight loss of 20 tablets tumbled in a friabilator. After 100 rotations in 4 minutes, the tablets were dusted and the percentage weight loss calculated.
9. Tablet Coating: Tablets produced by T29 and T30
were coated with OPADRY® II white (85F18422) in 50% ethanol, 8%w/w to obtain coated tablets CT1
and CT2 respectively using a conventional coating
10. Disintegration Test: Disintegration of both coated and uncoated tablets was carried out using ZB-1C intelligent disintegration apparatus (Tianjin University Precision Instrument Factory). Six tablets from each formulation was tested using 900ml of distilled water as medium at 37 ± 1oC with the timer set at 30min.
11. Development and Validation of RP-HPLC Method for Dissolution Assay:
a. Instrumentation: Agilent 1200 HPLC system under the following conditions: column, Diamonsil C18
(200mm X 4.6mm, 5µm); UV detector set at 363nm; column temperature, 25oC; mobile phase, methanol-acetonitirile-tetrahydrofuran-5% solution of glacial acetic acid (1:1:19.4:78.6); flow rate, 1ml/min.
b. Preparations of Standard Stock Solution: 2.5mg of hyperoside was accurately weighed into a 25ml volumetric flask and made to volume with dilute ethanol TS to obtain a solution of 100µg/ml concentration. 1ml of this was taken into a 10ml volumetric flask and diluted to the mark with dilute ethanol TS to obtain a concentration of 10µg/ml. c. Preparation of Working Standard Solution: 0.2, 0.4,
0.6, 0.8, 1 and 1.2ml of the 10µg/ml standard solutions was taken into 10ml volumetric flasks and diluted to the mark with dilute ethanol TS to prepare 0.2, 0.4, 0.6, 0.8, 1, and 1.2µg/ml concentrations respectively.
d. Selectivity: To demonstrate selectivity, 1µg/ml working solution was injected and the chromatogram recorded.
e. Calibration Curve/Linearity: Each of the working standard solutions was injected in triplicates and their peak areas recorded. The mean peak areas were then plotted against the concentrations. f. Precision: The methods precision was evaluated by
repeatability and intermediate precision studies. To demonstrate repeatability, the 0.8µg/ml working standard solution was injected 8 times, during the same day under the same experimental conditions. The peak areas were recorded and the %RSD calculated.
Intermediate precision was evaluated by intraday and inter day analysis. For intraday analysis, 0.6, 0.8 and 1µg/ml working standard solutions were injected six times each. Their peak areas were recorded and their %RSD calculated. The inter day analysis was for five consecutive days by six determinations with the 0.6, 0.8 and the 1µg/ml working standard solutions. Their peak areas were recorded and %RSD calculated.
g. Accuracy: To ensure that the proposed method is reliable and accurate, recovery studies were conducted by analyzing samples in triplicate at concentrations equivalent to 50%, 100% and 150% of the theoretical concentration of hyperoside in tablet. The percentage recovery and %RSD for each level was then calculated.
h. Limits of Detection (LOD) and Limit of Quantification (LOQ): Serial dilutions of the working standard solutions were injected and the LOD/LOQ determined by the Signal-to-Noise ratio. i. Robustness: Deliberate changes were made to the
chromatographic conditions and analysis carried out using the 1µg/ml working solution. The conditions varied were flow rate, column temperature and Tetrahydrofuran from a different manufacturer. The retention times and the peak area were recorded and the %RSD of the peak areas determined.
j. Saturation Solubility Studies: Equilibrium solubility studies as per the amount of hyperoside in saturated solutions of hawthorn extract was conducted. Water, Hydrochloric acid solution, pH 1.2, Phosphate buffer solutions, pH 4.5 and 6.8, and 0.5, 1, 1.5, and 2% Sodium dodecyl sulphate (SDS) solution were selected as mediums.
k. Dissolution Studies: Dissolution studies using six tablets were conducted with USP Dissolution test apparatus II (EWERKA DT 820, Germany) in 750ml of 2% SDS solution as medium, using the paddle method at 50 rpm at 37oC. Aliquots of 10mls were withdrawn at 10, 20, 30, 40, 50 and 60 minutes intervals and filtered. The volume was kept constant by adding 10mls of the dissolution medium. The filtered samples were assayed for hyperoside using the validated HPLC method.
RESULTS AND DISCUSSION: The plant material was successfully identified as that of hawthorn leafs and flowers by the TLC as shown in figure 1. The spots marked H represents the hyperoside spots and those marked R denotes the rutin spots with retention factors of 0.73 and 0.55 respectively.
The percentage moisture content of the extracts were within acceptable limits (Table 2). The standard curve of the rutin spectrometry showed linearity for the range of concentrations of rutin (9.168-55.008µg/ml) with regression coefficient, R2, of 0.9998. The line equations was y = 87.461 + 1.127. DE5 contained the
highest amount of total flavonoids either as rutin or hyperoside but contained a lesser amount of hyperoside compared to DE4 as shown in Table 3. It is
worth noting that, whiles the total flavonoids calculated as rutin fell below the stipulated value of not less than 80.0 percent in the CH.P for all the extract, the total flavonoids calculated as hyperoside
for DE1, DE4, DE5 were above the Eur.P limits of 2.5
percent for aqueous and 6.0 percent for hydro alcoholic extracts. In 2008, the global market for traditional medicines was estimated at US$83 billion annually 28. To maximize international trade in traditional medicinal products and reduce trade limitations, methods of qualification and quantification need to be harmonized.
FIGURE 1: PHOTO OF TLC UNDER UV-365NM. H= HYPEROSIDE SPOTS, R= RUTIN SPOTS
TABLE 2: MOISTURE CONTENT
Extract % Moisture Content
DE1 4.88
DE2 4.86
DE3 2.94
DE4 2.29
[image:6.612.371.529.170.349.2]DE5 1.4
TABLE 3: TOTAL FLAVONOIDS AND HYPEROSIDE CONTENT IN EXTRACTS
Extract % Content of Total Flavonoids calculated as Rutin % Content of Total Flavonoids calculated as Hyperoside
% Content of Hyperoside
DE1 25.3937 4.7278 0.2143
DE2 41.8482 5.8081 0.3358
DE3 44.7197 5.8696 0.4010
DE4 46.6403 7.6872 0.9160
DE5 58.1100 13.8000 0.8292
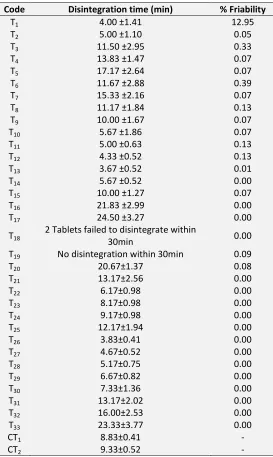
Two disintegrating agents; SSG and PVPP, with varying amounts were evaluated to access their effect on tablet disintegration. Binders were not used in this formulation as the extract exhibited a strong binding effect. Plant extracts have been show to act as strong binders 29. This is illustrated by the fact that tablets with lower weight containing the same amount of the extract either had a longer disintegrating time within the 30min experimental time or failed the test even
though they contained the same percentage of disintegrating agents and filler. For example, T14, T19
and T20 contained 4 percent of PVPP. Whiles T19 failed
to disintegrate within 30min, T20 disintegrated in
20.67min and T14 had a disintegrating time 5.67min.
Also compare T12 and T17, T13 and T18. The binding effect
[image:6.612.20.596.513.600.2]The complexity of indentifying an appropriate extract-filler-disintegrating agent combination for producing tablets (containing extract with binding ability) with good disintegration time was highlighted in this study. It has been observed that disintegrating agents are not effective in formulations which exhibit long disintegration time due to binding properties of the herbal extract not being reduced by a filler 29.
For 300mg of tablets containing DE2, DE3 or DE4, 7
percent PVPP resulted in disintegration times lower than those containing a higher or lower percentage of the same. However, tablets formulated with DE5
showed a different behavior; disintegration time improved with increasing percentage of PVPP. Again, tablets formulated with DE5 showed significant
differences in disintegration times compared with those of DE4 though the extraction method and
composition of formulations were the same. Though environmental conditions can bring about slight changes, this wide difference could be attributed to the fact that the physico-chemical properties of the extracts as well as their interaction with other components in the formulation are not exactly the same. It is therefore imperative to access the disintegration times of tablets when different extracts are used, especially when raw materials are not of the same batch.
SSG showed a better disintegrating ability compared to PVPP at the same percentage in tablets of equal weight when 70% ethanol was used as granulation fluid; comparing the disintegration time of T3 andT6 or T4 and
T7. However, PVPP showed a superior effect on tablet
disintegration better than SSG when 45% ethanol or distilled water was use as granulations fluid; see disintegration times for T8 and T10; and T9 and T11. In
general terms, disintegration time improves when lower percentage of ethanol was use regardless of the disintegrating agent. Distilled water was the best granulation fluid found in this study as it improved the disintegration of the tablets. It may therefore be suggested that alcohol increases the binding ability of the extracts.
The disintegration times for the coated tablets were 8.83±0.41 and 9.33±0.52 for CT1 and CT2 respectively.
Their percentage weight gains after coating were 7% and 9% respectively.
The disintegration times for the various formulations are shown in table 4.
[image:7.612.316.589.131.588.2]All the tablets showed acceptable friability when pressed at 100N.
TABLE 4: DISINTEGRATION TIME AND FRIABILITY
Code Disintegration time (min) % Friability
T1 4.00 ±1.41 12.95
T2 5.00 ±1.10 0.05
T3 11.50 ±2.95 0.33
T4 13.83 ±1.47 0.07
T5 17.17 ±2.64 0.07
T6 11.67 ±2.88 0.39
T7 15.33 ±2.16 0.07
T8 11.17 ±1.84 0.13
T9 10.00 ±1.67 0.07
T10 5.67 ±1.86 0.07
T11 5.00 ±0.63 0.13
T12 4.33 ±0.52 0.13
T13 3.67 ±0.52 0.01
T14 5.67 ±0.52 0.00
T15 10.00 ±1.27 0.07
T16 21.83 ±2.99 0.00
T17 24.50 ±3.27 0.00
T18
2 Tablets failed to disintegrate within
30min 0.00
T19 No disintegration within 30min 0.09
T20 20.67±1.37 0.08
T21 13.17±2.56 0.00
T22 6.17±0.98 0.00
T23 8.17±0.98 0.00
T24 9.17±0.98 0.00
T25 12.17±1.94 0.00
T26 3.83±0.41 0.00
T27 4.67±0.52 0.00
T28 5.17±0.75 0.00
T29 6.67±0.82 0.00
T30 7.33±1.36 0.00
T31 13.17±2.02 0.00
T32 16.00±2.53 0.00
T33 23.33±3.77 0.00
CT1 8.83±0.41 -
CT2 9.33±0.52 -
Method Development and Validation: Method
Selectivity was demonstrated by injecting a standard hyperoside solution and recording the chromatogram,
Figure 1.
FIGURE 1: STANDARD CHROMATOGRAM OF HYPEROSIDE; #- STANDARD PEAK OF HYPEROSIDE
Precision was demonstrated by repeatability and intermediate precision. The %RSD for repeatability was 0.621963, that for intraday and inter day analysis were 0.611981, 0.682309, 1.066869 and 0.277034, 0.590566, 0.966917 respectively for the chosen concentrations of 0.6, 0.8 and 1µg/ml. The very low %RSDs indicates that the proposed method is precise. The percentage recoveries at the level of 50%, 100% and 150% were 100.40, 103.04 and 100.95 with %RSD between 0 and 1.01. Thus, the method is accurate and reliable.
The LOD and LOQ were found to be 0.06µg/ml and 0.1µg/ml respectively.
Changes in the flow rate, column temperature and THF manufacturer did not result in significant changes in the retention times and peak areas. The %RSDs were 0.383197, 0.666667 and 0.383197 which are within acceptable range and thus method can be said to be robust;
[image:8.612.314.587.258.455.2]Medium Selection: Results from the saturation equilibrium solubility studies showed that the highest amount of hyperoside was releas in the 2% SDS solution. 2% SDS solution was therefore selected as medium for the dissolution studies.
TABLE 5: RESULT OF SOLUBILITY STUDIES
Medium Solubility (mg/ml)
Water 0.6224
Hydrochloric acid solution, pH 1.2 0.5503 Phosphate buffer, pH 4.5 0.5422 Phosphate buffer, pH 6.8 0.6585
0.5% SDS 0.9088
1% SDS 1.1275
1.5% SDS 1.1944
2% SDS 1.2948
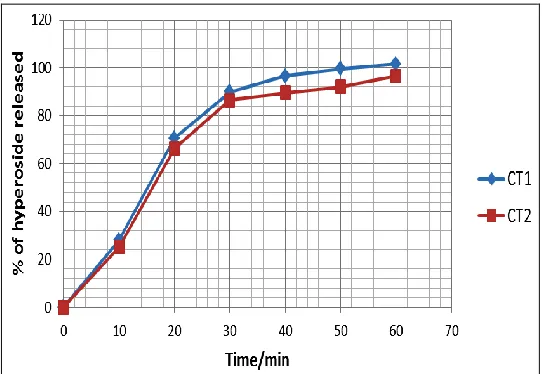
Dissolution studies: Figure 2 shows a typical chromatogram of dissolution samples. The developed RP-HPLC method was able to detect and quantify the released of hyperoside.
FIGURE 2: A TYPICAL CHROMATOGRAM OF DISSOLUTION SAMPLE: #- HYPEROSIDE PEAK
The results of the dissolution test are presented as percentage of hyperoside released at the preset times,
Figure 3.
[image:8.612.314.585.520.707.2]It was observed that, the amount of hyperoside released from CT1 was higher at all the set time than
that released from CT2. The amount released was 4%
higher for CT1 in 30 minutes and 5% higher after the
run time; 60 minutes.
Although there is no pharmacopoeia specification for dissolution of this formulation, the Q-value was set at least 75% after 30 minutes. The Q-value for CT1 was
found to be 89.952% and that for CT2 was 86.3765%,
therefore both tablets meet the set specification.
CONCLUSION: Coated hawthorn extract tablets with acceptable disintegration time and dissolution has been produced. HPLC method for assessing the dissolution of herbal tablets has been recommended as against spectrophotometry since identifying the matrix used by manufacturers could prove impossible 26. A RP-HPLC method which is simple, selective, accurate and reliable has been developed for assessing the in vitro dissolution of hawthorn extract tablet. This method can be applied for the routine quality control analyses of hawthorn tablet.
ACKNOWLEDGEMENT: This study was financially
supported by National Key Technology Research and Development Program of China (2012ZX09304007), and also supported by Program for Changjiang Scholars and Innovative Research Teams in Universities..
REFERENCES:
1. Pharmacopoeia of the People’s Republic of China. China Medical Science and Technology Publishing House, Beijing, English Edition, Volume I, 2010; 69-70, 662-663.
2. Herbal Medicines Association, B., British Herbal Pharmacopoeia. Bournemouth: British Herbal Medicines Association; 1984. 3. Wang T, An Y, Zhao C, Han L, Boakye-Yiadom M, Wang W, Zhang
Y: Regulation Effects of Crataegus pinnatifida Leaf on Glucose
and Lipids Metabolism. J. Agric. Food Chem., 2011;
dx.doi.org/10.1021/jf1049062
4. Brchm, M. et al.: Comparative antitumor activity of doxorubicin plus two radical scavenging plant extract preparations (Ginkgo biloba, Crataegus oxyacantha) and of doxorubicin alone, Conbrib Oncol., 1995;48, 48-52
5. Dr Duke’s phytochemical and ethnomedicinal data base
(online). Available at URL:
http://www.ars-grin.gov/duke/index.html
6. Della Loggia, R. et al.: Depressive effect of Crataegus oxyacantha L. on central nervous system in mice. Sci. Pharm., 1983; 51, 319-24
7. Rewerski, V., Piechocki, T., Rylski, M., Lewak, S: Some
pharmacological properties of crataegeus oxyacantha
compounds and isolated oligomeric procyanidins.
ArzneimForsch Drug Res. 1971; 21, 886-88
8. Veveris, M.; Koch, E.; Chatterjee, S. S: Crataegus special extract WS 1442 improves cardiac function and reduces infarct size in a rat model of prolonged coronary ischemia and reperfusion. Life Sci., 2004; 74, 1945-1955.
9. Asgary, S., Naderi, G. H., Sadeghi, M., Kelishadi, R., Amiri, M: Antihypertensive effect of Iranian Crataegus curvisepala Lind: a randomized, double-blind study. Drugs Exp. Clin. Res., 2004; 30, 221¨-225.
10.Tadic VM, Dobric S, Markovic GM, Dordevic SM, Arsic IA, Menkovic NR, Stevic T: Anti-inflammatory, gastroprotective, free-radical-scavenging, and antimicrobial activities of hawthorn berries ethanol extract. J. Agric. Food Chem., 2008; 56: 7700-7709.
11.Siepmann J, Siepmann F, Florence AT, , ‘Factors Influencing Oral Drug Absorption and Drug Availability’ in AT Florences and J Siepmann (eds), Modern Pharmaceutics, Informa Healthcare USA, Inc., New York, Edition 5, Volume 1, 2009:134.
12.Von Eggelkraut-Gottanka SG, Abed SA, Muller W, Schmidt PC: Roller compaction and tabletting of St. John's wort plant dry extract using a gap width and force controlled roller compactor. I. Granulation and tabletting of eight different extract batches., Pharm. Dev. Technol., 2002;7 (4) 433-45
13.Soares LAL, Ortega GG, Petrovick PR, Schmidt PC: Optimization of tablets containing a high dose of spray-dried plant extract: A technical note. AASP PharmSciTech., 2005;E: 367-371
14.Eder M, Mehnert W: The importance of concomitant
compounds in plant extracts. Pharmazie.1998; 53: 285-93. 15.Onunkwo GC, Egeonu HC, Adikwu MU, Ojile JE, Olowosulu AK:
Some physical properties of tabletted seed of Garcinia kola (HECKEL), Chem. Pharm. Bull., 2004; 52: 649-53
16.Rocksloh H., Rapp FR, Abu Abed S, Muller W, Reher M, Gauglitz G, Schmidt PC: Optimization of crushing strength and disintegration time of a high-dose plant extract tablet by neural networks, Drug Dev. Ind. Pharm., 1999; 25: 1015-25
17.Taglioli V, Bilia AR, Ghiara C, Massi G, Mercati V, Vincieri FF: Evaluation of the dissolution behaviour of some commercial herbal drugs and their preparations. Pharmazie, 2001; 56: 868-870.
18.Bempong DK, Houghton PJ: Dissolution and absorption of caffeine from guarana. J Pharm Pharmacol, 1992; 44: 769771. 19.Kressmann S, Biber A, Wonnemann M, Schug B, Blume HH,
Muller WEJ: Influence of pharmaceutical quality on the bioavailability of active components from Ginkgo biloba
preparations. Pharm. Pharmacol.,2002; 54: 1507-1514. 20.Westerhoff K, Kaunzinger A, Wurgilics M, Dressman J, Shubert
MZJ:. Biorelevant dissolution testing of St John’s wort products. Pharm. Pharmacol., 2002; 54: 1615-1621
21.Kratz JM, Terrazas CB, Motta MJ, Reginatto FH, Simões CMO: Determinação da composição quimica e dos perfis de dissolução in vitro de medicamentos a base de Ginkgo biloba
disponiveis no mercado brasileiro. Lat Am J Pharm.,2008; 27: 674-680.
22.Ansel HC, Popovich NG, Allen Jr. LV: Formas farmaceuticas e sistemas de liberação de farmacos, Baltimore, Editorial Premier, 2000; 568.
23.Ngo SNT: When do differences in dissolution profiles predict clinical problems? J Clin Pharm Therapeut.,2007; 32:111-112. 24.Vasconcelos EAF, Medeiros MGF, Raffi FN, Moura TFAL:
25.Alves FNR: Desafio para a inovação em fitomedicamentos no contexto da industria farmaceutica nacional. Rev Fitos.,2005; 1: 18-29.
26.Costa ART, Alves SF, da Conceicao EC, Garrote CFD, Paula JR, Bara MTF: Dissolution test of herbal medicines containing
Passiflora sp., Braz. J. Pharmacogn., 2010; 25.
27.European Pharmacopoeia. Council of Europe, Strasbourg, France, Editions 6, Volume I, 2008: 2036-2037
28.Traditional Medicine: Global Situation, Issue and Challenges.
Geneva, World Health Organization, 2011
(WHO/EMP/MIE/2011.2.3). Available at: http://apps.who.int/ medicinedocs/documents/s18063en/s18063en.pdf
29.Kucinskaite A, Sawicki W, Breidis V, Sznitowska M: Fast disintegrating tablets containing Rhodiola rosea L. Acte Poloniae Pharmaceutica- Drug Research, 2007; 64: 63-67.
30.International Conference on Harmonization, 1995, ‘Q2A: Text on Validation of Analytical Procedures’, Federal Register 60(40), 11260-11262.
How to cite this article: