Full Length Research Article
OPTIMIZATION OF INDOLE-3-ACETIC ACID PRODUCTION BY
BACILLUS SUBTILIS
TIB6 USING
RESPONSE SURFACE METHODOLOGY
1,*
Ton That Huu Dat,
2Nguyen Thị Kim Cuc and
1Pham Viet Cuong
1
Mientrung Institute of Scientific Research, Vietnam Academy of Science and Technology
2Institute of Marine Biochemistry, Vietnam Academy of Science and Technology
ARTICLE INFO ABSTRACT
The influence of carbon, nitrogen sources and tryptophan supplementation on indole-3-acetic acid (IAA) production of Bacillus subtilis TIB6 isolated from pepper rhizosphere, Tay Nguyen province of Viet Nam was investigated and obtained results showed that sucrose and yeast extract were the most favorable carbon and nitrogen sources for TIB6’s IAA production, respectively, while the presence of L-tryptophan in culture medium stimulated the formation of IAA. The student’s t-test of the Plackett-Burman design were used for screening significant factors affecting IAA producing capacity of TIB6 and obtained results showed that l-tryptophan, yeast extract concentrations and inoculation ratio were the main effecting parameters. By using central composite design (CCD) of response surface methodology (RSM), the culture conditions for TIB6 were optimized for maximum IAA production. The optimum values of variables were: L-tryptophan (0.088%), Yeast extract (0.82%) and inoculation ratio (1.65%). At these conditions, the maximum IAA production was estimated to be 120,846 mg/L.
Copyright © 2015 Ton That Huu Dat et al.This is an open access article distributed under the Creative Commons Attribution License, which permits unrestricted use, distribution, and reproduction in any medium, provided the original work is properly cited.
INTRODUCTION
Plant growth promoting rhizobacteria play a crucial role in agriculture by increasing the exchange of plant nutrients and reducing the use of chemical fertilizers. There are several mechanisms by which rhizosphere bacteria may stimulate plant growth. One of the most commonly reported direct growth promotion mechanism by bacteria is the production of plant growth promoting compounds. IAA (indole-3-acetic acid) is known as the member of the group of phytohormones and is considered the most important native auxin
(Ashrafuzzaman et al., 2009), involving in increasing the root
growth and length as well as wide root surface area, which enables the plant to easily access to more nutrients
from soil (Vessey, 2003). IAA is produced through l-tryptophan metabolism by bacteria, fungus and algae
(Sarwar and Kremer, 1995; Stein et al., 1990; Finnie and
Van Staden, 1985; Rifat et al., 2010). Bacteria from
different genera (Azospirillum, Enterobacter, Azotobacter,
*Corresponding author: Ton That Huu Dat
Mientrung Institute of Scientific Research, Vietnam Academy of Science and Technology
Klebsiella, Alcaligenes faecalis), actinomycetes (Streptomyces
olivaceoviridis, Streptomyces rimosus) and fungi
(Colletotrichum gloeosporioides, Ustilago maydis) have
shown to stimulate plant growth by the synthesis of IAA
(Torres-Rubio et al., 2000; Reinekei et al., 2008; Khamna
et al., 2010). Root exudates are natural source of l-tryptophan for rhizospheric microflora, which may promote IAA
biosynthesis in the rhizosphere (Glick et al., 1995), thus IAA
is considered as secondary metabolites (Ahmad et al., 2005).
Apart from detecting and screening IAA producing microorganisms, optimization of cultural conditions for IAA production improvement of the isolated strain was essential. Before now, the classical optimization method was used popularly in which “one factor at a time” was studied, i.e. only one factor of a system being variable, whereas the others were fixed during each experiment and therefore, much trials were
required(Sasirekha et al., 2012). Additionally, this laborious
and time consuming method does not guarantee the
determination of optimal conditions (Aravindan et al., 2007).
Statistical approach for medium optimization would effectively solve these problems, which involves specific design of trials to minimize the error in determining the effect
of variables(Krishnan et al., 1998). Statistical methods have
benefits over conventional methods in predicting the accurate
ISSN: 2230-9926
International Journal of Development Research
Vol. 5, Issue, 04, pp. 4036-4042, April,2015
International Journal of
DEVELOPMENT RESEARCH
Article History: Received 07th January, 2015
Received in revised form 11th February, 2015
Accepted 04th March, 2015
Published online 29th April, 2015
Key words:
Bacillus subtilis,
results based on utilization of fundamental principles of
statistics, randomization, and replication (Sasirekha et al.,
2012). In this study, we applied statistical approach for optimization of culture conditions for IAA production of
Bacillus subtilis TIB6 isolated from pepper rhizosphere, Tay Nguyen province of Vietnam
MATERIALS AND METHODS
Bacillus subtilis TIB6 strain
Bacillus subtilis TIB6 strain was isolated from pepper rhizosphere in Vietnam and the identification was carried out based on morphological, biochemical characteristics and 16S rDNA sequence analysis. Strain was maintained on nutrient
agar slant at 40C and stored at Vietnam Academy of Science
and Technology. Inoculum was prepared in nutrient broth
(g/L): glucose 10, peptone 5, KH2PO4 0.3, MgSO4.7H2O 0.5,
NaCl 3 by transferring a loop of the bacteria from stock
culture and incubated at 37oC, shaking 200 rpm for 24 h.
Estimation of IAA production
The IAA produced was estimated by previously described method (Gordon and Weber, 1951). One ml of the cell-free supernatant was added to 4 ml of the Salkovski’s reagent and this preparation was incubated for 30 minutes at room temperature in darkness. Presence of pink color pointed out IAA production. The amount of IAA produced was determined calorimetrically at 540 nm and calculated based on standard graph prepared from authentic IAA
Effects of precursor (l-tryptophan) and carbon, nitrogen sources on IAA production
Effect of nutritional factors on IAA production, such as l-tryptophan, carbon and nitrogen sources was investigated. The bacteria was cultivated in nutrient broth supplemented with 0.1 % tryptophan or 1% different carbon sources like Glucose, Galactose, Lactose, Mannitol, Sucrose and 0.5% different nitrogen sources such Soya bean, beef extract, Yeast extract,
peptone and tryptone. After 24 hours cultivation at 37oC and
shaking 200 rpm, the amount produced IAA by TIB6 strain was determined.
Screening main parameters affecting on IAA production by Plackett-Burman design
Plackett-Burman design (PBD) is the most commonly used screening design due to its ability to estimate main effects with the same precision (Antony, 2008). It is a fractional factorial design with the advantage of minimizing the experimental runs from large number of variables to smaller most
significant factors (El-Refai et al., 2010; Fang et al., 2010). In
this design, N factors can be screened with N + 1 trial runs
(Fang et al., 2010). In this study, the PBD were applied to
evaluate the effect of 10 cultural factors which are considered to be important for IAA production. Each component was tested at two concentration levels, low and high. Table 1 shows the factors used for PBD with 12 experiments for assessing their effects on IAA production. All experiments were carried out in 250 ml Erlenmeyer flasks containing 100 ml media, shaking at 200 rpm.
Table 1. Coded and actual values of the variables used in PBD
Variables Unit Low level (-1) High level (+1)
X1-Sucrose % 0.1 2
X2-Yeast extract % 0.1 1
X3-L-tryptophan % 0.01 0.1
X4-KH2PO4 % 0.01 0.05
X5-MgSO4.7H2O % 0.01 0.05
X6-NaCl % 0.1 1
X7-Temperature 0C 20 40
X8-pH - 5 8
X9-Incubation period Days 2 10
X10-Inoculation ratio % 1 3
The PBD based on the first order model without interaction effect has been represented by Equation 1.
= + (1)
Where Y is the response function, β0 is the model intercept, i
is the variable number, βi is regression coefficient and Xi
represents the independent variables. A 12-experimental run PBD consisting of the 10 factors at 2 levels was designed and the trials were carried out with triplicates. The standard design matrix with the responses is presented in Table 2.
The main effect of each of the variable is given in Equation 2.
( )= (∑ − ∑ )/ (2)
Where ( ) is the effect of the variables, ∑ is the
summation of the response at high level, ∑ is the
summation of the response at low level, n is the number of trials (Ndaliman, 2013). When the effect value is positive, the influence of the variable on IAA production is greater at higher concentration, conversely, if the effect value is negative, the influence of the variable is greater at lower concentration. The statistical analysis of the results was performed with the aid of statistical software package Design
[image:2.595.311.556.75.183.2]Expert 7.0(Sasirekha et al., 2012).
Table 2. PBD with the responses for IAA production
Exp.
No. X1 X2 X3 X4 X5 X6 X7 X8 X9 X10 IAA (mg/L)
1 + - + - - - + + + - 91.91
2 + + - + - - - + + + 105.29
3 - + + - + - - - + + 118.43
4 + - + + - + - - - + 111.82
5 + + - + + - + - - - 93.73
6 + + + - + + - + - - 110.51
7 - + + + - + + - + - 101.19
8 - - + + + - + + - + 105.26
9 - - - + + + - + + - 79.98
10 + - - - + + + - + + 81.81
11 - + - - - + + + - + 87.23
12 - - - 74.94
Optimization for IAA production using Response Surface Methodology
In order to determine the optimal level of each important independent variable, a central composite design (CCD) of response surface method had been used, which allows to estimate a full quadratic model for each response
2003; Chang et al., 2006). The CCD in 20 runs was adopted (Table 4) for the experiment containing 3 key effect factors at 5 levels each (Table 3). The relationship of the independent variables and the responses was represented in the second-order polynomial equation 4.
Y = β0+ β1x1+ β2x2+ β3x3+ β11x1x1+ β12x1x2+ β13x1x3+ β22x2x2+
β23x2x3+ β33x3x3 (4)
Where Y is the response; β0 is the intercept; β1, β2, β3 are
linear coefficients; β11, β22, β33 are squared coefficients; β12,
β13, β23 are interaction coefficients. The analysis of variance
(ANOVA) was used to value the effects and determine regression coefficients of model. The response surface plots were adopted to represent the effect of the independent variables on IAA production. These response curves were then
used to predict the optimum level of the factors (Pham et al.,
[image:3.595.43.280.400.601.2]1998; Kwak et al., 2006).
Table 3. Experimental range of the three significant variables used in Central composite design for IAA production
Independent variables Levels
-α -1 0 +1 +α A: L-tryptophan (%) 0.046 0.06 0.08 0.1 0.114 B: Yeast extract (%) 0.33 0.5 0.75 0.1 1.17 C: Inoculation period (%) 0.66 1.0 1.5 2.0 2.34
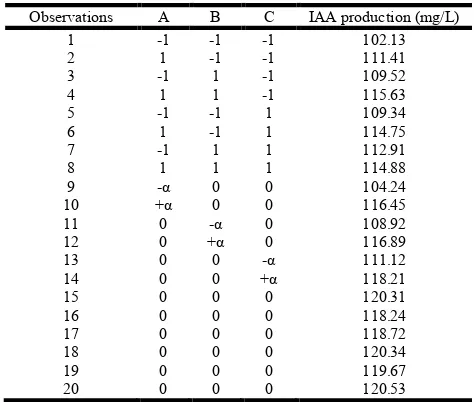
Table 4. Experimental design and responses of IAA production in Central composite design
Observations A B C IAA production (mg/L)
1 -1 -1 -1 102.13
2 1 -1 -1 111.41
3 -1 1 -1 109.52
4 1 1 -1 115.63
5 -1 -1 1 109.34
6 1 -1 1 114.75
7 -1 1 1 112.91
8 1 1 1 114.88
9 -α 0 0 104.24
10 +α 0 0 116.45
11 0 -α 0 108.92
12 0 +α 0 116.89
13 0 0 -α 111.12
14 0 0 +α 118.21
15 0 0 0 120.31
16 0 0 0 118.24
17 0 0 0 118.72
18 0 0 0 120.34
19 0 0 0 119.67
20 0 0 0 120.53
RESULTS AND DISCUSSION
Effect of L-tryptophan on IAA production
Obtained results showed that l-tryptophan stimulated IAA
production of B. subtilis TIB6. TIB6 produced 76.4 ± 2.1
mg/L IAA when 0.1% tryptophan was added into culture medium compared with 28.5 ± 2.8 mg/L IAA in control
(without tryptophan). It means that strain B. subtilis TIB6
probably synthesized IAA through l-tryptophan dependent pathways. Tryptophan is believed to be the primary precursor for the formation of IAA in plants and rhizobacterium
(Monteiro et al., 1988).
The role of tryptophan in the enhancement of IAA production
also reported in several earlier reports (Chopade et al., 2008;
Khalid et al., 2004). Maximum IAA production of 170µg/ml
was obtained when 0.5% l-tryptophan was used for culturing
Pseudomonas sp. (Balaji et al., 2012), while IAA production of Klebsiella increased with an increasing of tryptophan up to
0.2%. Similarly, strains Pseudomonas aeruginosa produced
IAA at 5 fold higher than control (without tryptophan) when culture medium was supplemented with 0.1 g/l-tryptophan (Chaiharn and Lumyong, 2010). IAA synthesis of many bacteria was improved when tryptophan was added into
culture medium (El- Khawas and Adachi, 1999; Ali et al.,
2010). However, excessive concentration of l-tryptophan may
also have adverse effect on IAA production (Nita et al., 2011).
This phenomenon may be due to release of IAA degrading
enzymes as reported earlier for Rhizobium species (Datta and
Basu, 2000).
Effect of carbon sources on IAA production
Strain TIB6 can use all investigated carbon sources for growth and IAA synthesis. In culture medium with glucose and sucrose (1%), TIB6 synthesized 76.3 ± 2.7 and 78.3 ± 3.2 mg/L IAA, respectively. Meanwhile, in medium supplemented with other carbon sources, TIB6 produced less amount of IAA (Table 5). The studies regarding correlation between utilization different carbon sources and production of IAA of
Rhizobium showed that different Rhizobium strains prefer
different carbon source. The Rhizobium strains 12, 16 and 18
required sucrose, whereas Rhizobium strain 13 and Rhizobium
sp. from Cajanus Cajan preferred glucose for maximum production of IAA (Datta and Basu, 2000; Sridevi and Mallaiah, 2007). Sucrose was also the best carbon source for
the growth and IAA production of Acetobacter diazotrophicus
and Pantoea agglomerans (Apine and Jadhav, 2011; Nita et
al., 2011).
Table 5. Effect of carbon source on IAA production of TIB6
Carbon source Glucose Sucrose Mannitol Galactose Lactose IAA (mg/L) 76.3±2.7 78.3±3.2 63.5±2.3 68.7±2.3 71.2±2.9 ± standard error.
Effect of nitrogen sources on IAA production
Effect of nitrogen source on IAA production of TIB6 strain was assessed and experimental results pointed out that IAA production reached a peak of 79.1 ± 3.4 µg/ml when yeast extract was used as nitrogen source. Like carbon sources, bacteria utilize dissimilar nitrogen sources for maximum IAA
production. Rhizobium can utilize both organic and inorganic
nitrogen sources (Sridevi and Mallaiah, 2007), while
Pseudomonas sp. prefers yeast extract (Balaji, 2011).
Table 6. Effect of nitrogen source on IAA production of TIB6
Nitrogen source
Soya bean
Beef extract
Yeast
extract Peptone Tryptone IAA (mg/L) 65.7±2.6 70.1±2.9 79.1±3.4 75.9±3.2 63.9±3.1
[image:3.595.310.558.693.728.2]Beef extract was the most favorite nitrogen source for Pantoea
agglomerans PVM (Apine and Jadhav, 2011), and NH4Cl was
found to be the most suitable nitrogen source for IAA
production of Acetobacter diazotrophicus L1 (Nita et al.,
2011).
Screening of main factors effecting IAA production by Plackett-Burman design
PBD experiments showed that IAA production by TIB6 varied widely, ranging from 74.94 to 118.43 µg/ml. Sucrose,
L-tryptophan, yeast extract, KH2PO4, MgSO4 concentration, and
inoculation ratio showed positive effects, while NaCl, temperature, pH and incubation period have shown negative effects on IAA production. The Student’s t-test and p-value were used to determine the significance of model at 95% confidence level. On the basis of the Student’s t-test and the calculated p-values, l-tryptophan, yeast extract concentration and inoculation ratio were identified as the three significant components affecting IAA production. Based on the PB design, the effect of independent variables on IAA production is given by the first order linear model as equation 5 (actual
units). The regression coefficient of the model (R2 = 0.9993)
close to 1.0, implying that the given model is well fitted with the trial results. Analysis of variance (ANOVA) given in table 8 showed that the main effect of the independent variables was valid with 93.7% confidence level.
IAA = 72.3 + 2.46X1 + 13.1X2 + 215X3 + 123X4 + 72.3X5 -
[image:4.595.42.284.432.549.2]3.15X6 - 0.332X7 - 0.097X8 - 0.102X9 + 4.8X10 (5)
Table 7. Estimated effects and coefficients for analysis of PBD
Variables Main effect Coefficients t-value p-value
Constant 96.8417 283.44 0.002
X1 4.6733 2.3367 6.84 0.092
X2 11.7767 5.8883 17.23 0.037
X3 19.3567 9.6783 28.33 0.022
X4 5.4067 2.7033 7.91 0.080
X5 2.8900 1.4450 4.23 0.148
X6 -2.8367 -1.4183 -4.15 0.150 X7 -6.6400 -3.3200 -9.72 0.065 X8 -0.2900 -0.1450 -0.42 0.744 X9 -0.8133 -0.4067 -1.19 0.445
[image:4.595.38.288.593.645.2]X10 9.5967 4.7983 14.04 0.045
Table 8. ANOVA for linear model for effect of independent variables on IAA production
Source DF Sum of squares
Mean
square F-value p-value Main effects 10 2153.32 215.33 153.72 0.063 Residual error 1 1.40 1.40
Total sum of squares 11 2154.72
Plackett-Burman design can be used to find the significant variables in a system and allow them to be ranked in order of importance and to decide which one is to be investigated
further so as to determine the optimum values (Liu et al.,
2003). Sasirekha et al. (2012) used Plackett-Burman design
for screening the most significant effects influencing IAA
production by Pseudomonas aeruginosa, and yeast extract,
tryptophan and EDTA were identified as significant components.
Optimization for IAA production using response surface methodology
CCD has been adopted in determination of optimum cultural conditions and in the analysis of the interaction of three main variables for IAA production by bacteria. All the trials were carried out with triplicates and the average IAA production given in Table 4 was subjected to multiple linear regression analysis using Design-Expert 7.0.0 software. The effect of l-tryptophan, yeast extract concentration and inoculation ratio on IAA production was described in the form of second order polynomial model in coded units.
IAA (mg/L) = 119.66 + 3.17A + 2.10B +1.84C - 0.83AB -
1.00AC - 0.99BC - 3.47 A2 - 2.57B2 - 1.95C2 (6)
Where Y is IAA production (mg/L), A is l-tryptophan concentration (%), B is yeast extract concentration (%) and C is inoculation ratio (%). The analysis of variance (ANOVA) for second order polynomial model was given in Table 9. The statistical significance of the second-order polynomial model was assessed by F-test ANOVA. The model F-value of 57.03 implied the model was significant. P-value less than 0.05 will indicate that the model terms are significant at α=0.05. In this case, the model had a very low probability value (p-value < 0.0001 < α=0.05), implying that the model was highly significant and adequate to represent the relationship between IAA production (µg/ml) and l-tryptophan, yeast extract concentration and inoculation ratio. Lack-of-fit of model had a high probability value (p-value = 0.385 > α=0.05), which showed that lack of fit is insignificant. Similarly, the lack of fit F-value of 1.32 implied the lack of fit was not significant relative to the pure error. Non-significant lack of fit demonstrated that the model was well fit.
The R2 value of model represents the correlation between
observed and predicted values. In this study, R2 = 0.9809%
showed good correlation between observed and predicted values and proved that model could explain 98.09% of variability in the response and only 1.91% of the total variance could not be explained by the model. The Pred R-squared of 0.9058 was in reasonable agreement with the Adj R-squared of 0.9637. Adeq Precision measures the signal to noise ratio and a ratio greater than 4 is desirable. In this case, a ratio of 24.707 indicated an adequate signal. The coefficient of variation (CV) indicates the degree of precision with which the experiments are compared. A lower value of coefficient of variation shows the experiments conducted are precise and reliable (Box, 1978). In the present case, a low CV (0.9%) pointed out that the experiments performed are reliable.
Table 9. Analysis of variance (ANOVA) for second order polynomial model of IAA production
Factors DF Sum of Squares
Mean
Square F-value P-value Model 9 539.6666 59.96295 57.02756 < 0.0001 Lack of fit 5 5.976582 1.195316 1.316964 0.3850 Pure error 5 4.53815 0.90763
Total 19 550.1813
CV = 0.9%; R2 = 0.9809; Pred-R2= 0.9058; Adj-R2 = 0.9637; Adeq Precision
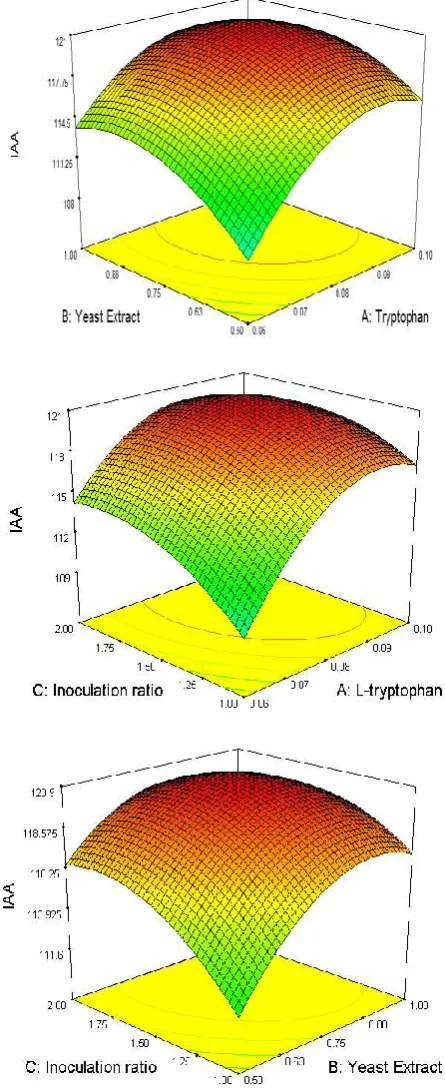
[image:4.595.307.559.673.733.2]Fig. 1. Optimization for IAA production using response surface method in 3D surface plot
The obtained 3D surface plots represent the effect of each of the three factors and their interactive influence on IAA production. The surface plots (Figure.1) showed that lower and higher level of l-tryptophan, yeast extract and inoculation ratio had less significant effect on the IAA production and increasing of IAA production was observed at middle level of l-tryptophan, yeast extract, as well as inoculation ratio. Results of optimization for culture conditions of IAA production based on response surface method indicated that predicted maximum
IAA production of 120.846 (mg/L) was obtained using L-tryptophan concentration of 0.088%, yeast extract
concentration of 0.82% and inoculation ratio of 1.65%. The comparison of predicted (120.846 mg/L) and experimental values (121.35 mg/l) showed good correlation between them, implying that the empirical model derived from RSM can be used to adequately describe the relationship between the cultural conditions and the IAA production. Response surface method has already been successfully adopted for optimization of media and culture conditions in many cultivation process for the production of primary and secondary metabolites
(Shirai et al., 2001; Boyaci, 2005), such as amino acids (Jyohi
et al., 2005; Xiong et al., 2005), ethanol (Carvalho et al.,
2003), flavoring compound (acetoin) (Xian et al., 2007),
enzyme (Rao et al., 1993), IAA (Swain and Ray, 2008), and
biomas (Sreekumar and Soundarajan, 2010). Swain and Ray (2008) applied RSM-CCD for optimization of IAA production in SSF, and showed that optimum parameters for IAA production were incubation period (6 days), pH (7.0) and moisture holding capacity (70%).
Conclusion
The influence of carbon, nitrogen sources and tryptophan supplementation on IAA production of the TIB6 strain was studied and the experimental results revealed that sucrose and yeast extract were the most favorable carbon and nitrogen sources for TIB6’s IAA producing capability, respectively. Besides, the presence of L-tryptophan in culture medium increased amount of IAA produced by TIB6 strain. Plackett-Burman design was used for determination of main culturing
factors affecting IAA production by B.subtilis TIB6 and
obtained results showed that L-tryptophan, yeast extract concentration and inoculation ratio were parameters exhibited significant effect on IAA production. These variables were further optimized using RSM with CCD design and the comparison of predicted and experimental values of IAA production showed good correlation between them. The optimum culture parameters for maximum IAA production (121.35 mg/L) of TIB6 were l-tryptophan (0.088%), yeast extract (0.82%) and inoculation ratio (1.65%).
Acknowledgement
This work was financially supported by Tay Nguyen 3rd
Program of Technological and Scientific Development, Vietnam Academy of Science & Technology for the project:
Improving and technological transfer of POLYFA-TN3 product for soil reclamation in Tay Nguyen. No Code: TN3/C10.
REFERENCES
Adinarayana, K. and Ellaiah, P. 2002. Response surface optimization of the critical medium components for the production of alkaline protease by a newly isolated
Bacillus sp. J. Pharm Sci, 5, 272-276.
Ahmad, F. I. Ahmad and M. S. Khan. 2005. Indole acetic acid
production by the indigenous isolates of Azotobacter and
Fluorescent Pseudomonas in the presence and absence of
Tryptophan. Turkish Journal of Biology, 29, 29-34.
Ali, B., Sabri, A. N. and Hasnain, S. 2010. Rhizobacterial
potential to alter auxin content and growth of Vigna
Antony, J. 2008. Design of Experiments for Engineers and Scientists. (Butterworth Heinemann, U.K), pp. 48.
Apine, O. A. and Jadhav, J. P. 2011. Optimization of medium
for indole-3-acetic acid production using Pantoea
agglomerans strain PVM. Journal of Applied
Microbiology, 110(5), 1235-44.
Aravindan Rajendran, Meikandhan Thirugnanam and
Viruthagiri Thangavelu, 2007. Statistical evaluation of medium components by Plackett-Burman experimental design and kinetic modeling of lipase production by
Pseudomonas fluorescens. Indian Journal of
Biotechnology, 6, 469-478.
Ashrafuzzaman, M., F. A. Hossen, M. R. Ismail, M. A. Hoque, M. Z. Islam, S. M. Shahidullah and S. Meon, 2009. Efficiency of Plant Growth promoting Rhizobacteria
(PGPR) for the Enhancement of Rice Growth. African
Journal of Biotechnology, 8, 1247-1252.
Balaji, N., S. S. Lavanya, S. Muthamizhselvi and K. Tamilarasan, 2012. Optimization of fermentation condition
for indole acetic acid production by Pseudomonas species.
International Journal of Advanced Biotechnology and Research, 3, 797-803.
Beg, Q. K., Saxena, R. K. and Gupta, R. 2002. Kinetic constants determination for an alkaline protease from
Bacillus mojavensis using response surface methodology.
Biotechnol. Bioeng, 78, 289-295.
Box, G. E. P., Hunter, W. G. and Hunter, J. S. 1978. Statistics for Experimenters (John Wiley and Sons, New York), pp. 291.
Boyaci, I. H. 2005. A new approach of determination of
enzyme kinetic constants using response surface
methodology, Biochem Eng J, 25, 55-62.
Carvalho, J. C. M., Vitolo, M., Sato, S. and Aquarone, E.
2003. Ethanol production by Saccharomyces cerevisiae
grown in sugarcane blackstrap molasses through a feed
batch process: optimization by response surface
methodology. Appl Microbiol Biotechnol, 110, 151-164.
Chaiharn, M. and S. Lumyong, 2011. Screening and optimization of indole-3-acetic acid production and phosphate solubilization from rhizobacteria aimed at
improving plant growth. Curr. Microbiol, 62(1), 173-181.
Chang, Y. C., Lee, C. L. and Pan, T. M. 2006. Statistical optimization of media components for the production of
Antrodia cinnamomea AC0623 in submerged cultures.
Appl. Microbiol. Biotechnol, 72, 654-661.
Chopade, B. A., S. B. Huddedar, A. M. Shete, J. N. Tilekar, S.
D. Ghore and D. D. Dhavale, United States 7, 341, 868
(Drinker, Biddle & Reath LLP) 11th of March 2008. Datta, C. and Basu, P. S. 2000. Indole acetic acid production
by Rhizobiumspecies from root nodules of a leguminous
shrub, Cajanus cajan. Microbiol. Res, 155, 123-127.
El-Khawas, H. and Adachi, K. 1999. Identification and
quantification of auxins in culture media of
Azospirillumand Klebsiella and their effect on rice roots.
Biol. Fert. Soils, 28, 377-381.
El-Refai, HA., E. R. El-Helow, M. A. Amin, L. A. Sallam and H. A. Salem, 2010. Application of multifactorial experimental design for optimization of biotin production
by a Rhizopus Nigricans strain. Journal of American
Science, 6, 179-187.
Fang, H., C. Zhao and Y. Y. Song, 2010. Optimization of enzymatic hydrolysis of steam-exploded corn stover by
two approaches: response surface methodology or using
cellulose from mixed cultures of Trichoderma Reesei
RUT-C30 and Aspergillus Niger NLO2. Bioresource
Technology, 101, 4111-4119.
Finnie, J. F. and Van Staden, J. 1985. Effect of seed weed concentrate and applied hormones on in vitro cultured
tomato roots. J. Plant Physiol, 120, 215-222.
Glick, B. R., D. M. Karaturovic and P. C. Newell, 1995. A novel procedure for rapid isolation of plant growth
promoting Pseudomonads. Canadian Journal of
Microbiology, 41(6), 533-536.
Gordon, S. N. and Weber, R. P. 1951. Colorimetric estimation
of indole acetic acid. Plant Physiology, 26, 192-195.
Jyohi, A. N., Sasikiran, K., Nambisan, B. and Balagopalan, C. 2005. Optimization of glutamic acid production from
cassava starch factory residues using Brevibacterium
divaricatum. Process Biochem, 40, 3576-3579.
Khalid, A., M. Arshad and Z. A. Zahir, 2004. Screening plant growth-promoting Rhizobacteria for improving growth and
yield of wheat. Journal of Applied Microbiology, 96,
473-480.
Khamna, S., Yokota, A., Peberdy, J. F. and Lumyong, S. 2010.
Indole-3-acetic acid production by Streptomyces sp.
isolated from some Thai medicinal plant rhizosphere soils.
Eur. Asia. J. Biosci, 4, 23-32.
Kristo, E., Biliaderis, C. G. and Tzanetakis, N. 2003. Modeling of the acidification process and rheological properties of milk fermented with a yogurt starter culture
using response surface methodology. Food Chem, 83,
437-446.
Kwak, K. O., Jung, S. J., Chunga, S. Y., Kangc, C. M., Huhd, Y. I. and Baea, S. O. 2006. Optimization of culture
conditions for CO2 fixation by a chemoautotrophic
microorganism, strain YN-1 using factorial design.
Biochem. Eng. J, 31, 1-7.
Liu, C., Liu, Y., Liao, W., Wen, Z. and Chen, S. 2003. Application of statistically based experimental designs for the optimization of nisin production from whey.
Biotechnol. Lett, 25, 877-882.
Monteiro, A. M., Crozier, A. and Saanberg, G. 1988. The biosynthesis and conjugation of indole-3- acetic acid in
germinating seeds and seedlings of Dalbergia
dolichopetala. Planta, 174, 561-568.
Ndaliman, M. B., A. A. Khan, M. Y. Ali and Z. Wahid, 2013. Determination of Influential Factors on EDMed Surface
Properties Using Plackett-Burman Design. World Applied
Sciences Journal, 21, 88-93.
Nita B. Patil, Milind Gajbhiye, Sangita S. Ahiwale, Aparna B. Gunjal and Balasaheb P. Kapadnis. 2011. Optimization of
Indole 3-acetic acid (IAA) production by Acetobacter
diazotrophicus L1 isolated from Sugarcane. International Journal of Environmental Sciences, 2(1), 307-314.
Pham, P. L., Taillandier, P., Delmas, M. and Strehaiano, P. 1998. Optimization of a culture medium for xylanase
production by Bacillus sp. using statistical experimental
designs. W. J. Microbiol. Biotechnol, 14, 185-190.
Rao, P. V., Jayaraman, K., Lakshmanan, C. M. 1993.
Production of lipase by Candida rugosa in solid-state
fermentation, medium optimization and effect of earation.
Process Biochem,28, 391-395.
(IAA) biosynthesis in the smut fungus Ustilago may disand its relevance for increased IAA levels in infected tissue and
host tumor formation. Mol Plant Pathol, 9, 39-355.
Rifat Hayat, Safdar Ali, Ummay Amara, Rabia Khalid and Iftikhar Ahmed, 2010. Soil beneficial bacteria and their
role in plant growth promotion: a review. Ann Microbiol,
60, 579- 598.
Sarwar, M. and R. J. Kremer, 1995. Determination of
bacterially derived auxins using a micro plate method. Lett.
Appl. Microbiol. 147, 282-285.
Sasirekha, B., S. Shivakumar and S. B. Sullia, 2012. Statistical optimization for improved indole-3-acetic acid (iaa)
production by Pseudomonas aeruginosa and demonstration
of enhanced plant growth promotion. Journal of Soil
Science and Plant Nutrition, 12(4), 863-873.
Shirai, K., Guerrero, I., Huerta, S., Saucedo, G., Castillo, A., Gorzalez, R. O. and Hall, G. M. 2001. Effect of initial glucose concentration and inoculum level of lactic acid
bacteria in shrimp waste ensilation. Enz Microbiol
Technol, 28, 446-452.
Shridevi, M. and Mallaiah, K. V. 2007. Bioproduction of indole acetic acid by Rhizobium strains isolated from root
nodules of green manure crop. Sesbania sesban (L.) Merr.
Iran J Biotechnol, 5, 178-182.
Sreekumar, G. and Soundarajan Krishnan, 2010. Enhanced
biomass production study on probiotic Bacillus subtilis
SK09 by medium optimization using response surface
methodology. African Journal of Biotechnology, 9(45),
8078-8084.
Stein, A., Fortin, J. A. and Vallee, G. 1990. Enhanced rooting of Picea mariana cuttings by ecto mycorrhizal fungi. Can J Bot, 68, 492-498.
Swain, M. R. and Ray, R. C. 2008. Optimization of cultural conditions and their statistical interpretation for production
of indole-3-acetic acid by Bacillus subtilis CM5 using
cassava fibrous residue. Journal of Scientific and Industrial
Research, 67, 622-628.
Torres-Rubio, M. G., Valencia-Plata, S.A., Bernal-Castillo, J. and Martinez-Nieto, P. 2000. Isolation of enterobacteria,
Azotobacter sp. and Pseudomonas sp. producers of indole-3-acetic acid and siderophores, from Colombian rice
rhizosphere. Rev Latinoam Microbiol, 42, 171-176.
Vessey, J. K. 2003. Plant growth promoting rhizobacteria as
biofertilizers. Plant and Soil, 255, 571-586.
Xian, J. Z., Lin, P. H., Qin, J. Y. and Xu, P. 2007. Statistical optimization of medium composition for enhanced acetoin production from molases and soybean meal hydrolysate.
Appl Microbiol Biotechnol, 74, 61-68.
Xiong, C., Shouwen, C., Ming, S. and Ziniu, Y. 2005. Medium optimization by response surface methodology for poly-Y-glutamic acid production using dairy manure as the basic
of a solid substrate. Appl Microbiol Biotechnol, 69,
390-396.