Full Length Research Article
A STUDY ON GEOMORPHOLOGICAL RESPONSE FOR ESTIMATION OF DIRECT RUNOFF IN
KOTHUWATARI WATERSHED
*
Singh, B. R., Sweta Singh, Papu Singh and Mishra, D. K.
Department of Agricultural Engineering and Food Technology, College of Agriculture, Sardar Vallabhbhai Patel
University of Agriculture and Technology, Meerut-250110, (U.P.) India
ARTICLE INFO ABSTRACT
Hydrological data of Kothuwatari sub-watershed comprising an area of 2793 hectares of the Tilaiya dam catchment of Upper Damodor valley, located in Hazaribagh district of Jharkhand State (India) were analyzed to study the geomorphological response for estimation of direct runoff by using Geomorphological Instantaneous Unit Hydrogroph (GIUH) model. GIUH model was based on storm basis incorporating geomorphological parameters with the hydrological characteristics of the watershed. Geomorphological parameters such as bifurcation ratio (RB),
length ratio (RL) and area ratio (RA), were derived graphically from topographic maps of the
watershed satisfying Horton’s (1945) law when ordered according to Strahler (1957) ordering procedure. A synthesis of the hydrologic response of Kothuwatari watershed to surface runoff was derived by linking the instantaneous unit hydrograph. (IUH) to the geomorphological permeters, watershed to surface runoff was derived by linking the instantaneous unit hydrograph. The GIUH of the watershed was calibrated using the observed direct runoff hydrograph data. Direct runoff hydrographs were obtained from GIUH and these were compared with the observed DRHs to judge the performance of the model. The model performed well for all the test data sets with high coefficient of efficiency, lower relative squared error and absolute relative error in computed peak flow rates values and near zero Coefficient of Residual Mass values. The percentage absolute error in time to peak between computed and observed direct runoff hydrograph was found to be zero percent. The performance of the model showed that it simulates components of direct runoff of hydrographs well.
Copyright © 2014 Singh et al. This is an open access article distributed under the Creative Commons Attribution License, which permits unrestricted use, distribution, and reproduction in any medium, provided the original work is properly cited.
INTRODUCTION
The development of a sound watershed management plan necessitates an effective information system for the collection, storage and analysis of a wide range of physiographic and socio economic data. The major objective behind the watershed approach is also to boost agriculture production in rainfed areas through efficient use of natural resources within the natural boundaries of the development area. Watershed management deals with the response of the watershed with the major objective being harvesting of available water to increase the net agriculture production. Due to social and economical constraints, most of the watershed in India are still ungauged ngaged there by limiting the information needed for assessing the watershed, such watersheds, however, can be studied with either physically based models or models incorporating
*Corresponding author: Singh, B. R., Department of Agricultural Engineering and Food Technology, College of Agriculture, Sardar
Vallabhbhai Patel University of Agriculture and Technology, Meerut-250110, (U.P.) India
geomorphological parameters. Development of rainfall-runoff models for accurate estimation of runoff is very important for proper planning, design and management of water resources projects. As a result of continuous research in the field of hydrological modelling many models have been developed to define the rainfall-runoff relationship of ungauged watersheds. Though several models are developed to meet this requirements but there has been a gap in the coupling of quantitative geomorphological analysis with the most important hydrologic variables namely, the stream flow response to the surface runoff of geomorphological unit. The concept for determining the response of watershed is the form of IUH based on geomorphology can be developed. An improvement over some of the models is the geomorphology-based models e.g., Gupta and Waymire3 (1983), which represent the watershed structure and the stream network well. The watershed geomorphology plays a major role in the transformation of rainfall into runoff. By using the quantitative geomorphological parameters of a watershed, its hydrological
ISSN:
2230-9926
International Journal of Development Research
Vol. 4, Issue, 8, pp. 1660-1666, August,2014
International Journal of
DEVELOPMENT RESEARCH
Article History: Received 09th May, 2014
Received in revised form 19th June, 2014
Accepted 07th July, 2014
Published online 31st August, 2014 Key words:
GIUH, Watershed, Runoff, Geomorphology
response can be modeled. In the present study this concept has been successfully used for the development of geomorpological parameters and geomorpological instantaneous unit hydrograph (GIUH) for Kothuwatari watershed (27.93 sq km) of Tilaiya dam catchment of upper Damodar Valley, located in Jharkhand state, (INDIA).
MATERIALS AND METHODS
Study Area
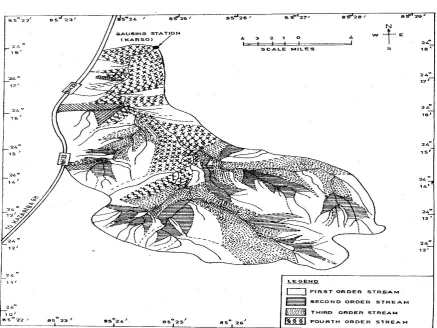
The Kothuwatari watershed lies at the South-Eastern part of the Tilaiya dam catchment between 240 12’ 27” and 240 16’ 54” North latitudes and 850 24’ 18” and 850 28’ 10” East longitudes Location of Kothuwatari watershed in Tilaiya dam sub catchment of upper Damoder Velley is shown in Figure 1. The Kothuwatari watershed comprising of an area 2793 ha is irregular in shape. Heavy sheet and gully erosion from unprotected up lands is predominant. The maximum elevation of the watershed at upstream is 579 m whereas it is 381 m above mean sea level at the gauging station of Karso village. The climate of watershed varies from tropical to sub-temperate. Mean air temperature is maximum in the month of May, and minimum in January with an annual average temperature of about 25ºC. The summer is generally hot with low humidity, and normally during May, the day temperature rises to the peak of about 45ºC and goes down to about 5ºC during January.
Geomorphological Data
The drainage map and the contour map of the Kothuwatari watershed were obtained from the office of the Damodar Valley Corporation, Hazaribagh, (Jharkhand State) and used to determine the geomorphological parameters. Fig. 2 and 3 showed the stream ordering for the watershed and the area contributing to different order streams, respectively. Geomorphological parameters for the watershed were determined with the help of different maps of the study area which are shown in Table 1. The geomorphological ratios, i.e. bifurcation ratio, RB, area ratio, RA, and length ratio, RL, were
estimated using Horton's (1945) graphical procedure and their values were found as 4.0663, 5.4011 and 2.4315, respectively.
Rainfall and Runoff data
The rainfall and runoff data were obtained from D.V.C Hazaribagh, (Jharkhand state) Inida. The rainfall data were collected with the recording type rain gauge and runoff in the form of stage hydrograph is being measured by automatic well type water stage recorder installed at Karso recording station in the watershed. The collected rainfall and runoff data were used for determining the Geomorphological Instantaneous Unit Hydrographs for the study area.
Geomorphological Instantaneous Unit Hydrograph (GIUH) Model
The Geomorphological Instantaneous Unit Hydrograph (GIUH) Model used in this present study is based on the theory proposed by Rodriguez-Iturbe & Valdes (1979) and its subsequent generalization by Gupta et al. (1980). According to the theory, the unit input (unit depth of rainfall) is considered to be composed of an infinite number of small, non-interacting drops of uniform size, falling instantaneously over the entire region. The travel time of a randomly chosen drop of water, from its starting point to the outlet, represents the instantaneous unit hydrograph (IUH) of the basin. The Instantaneous Unit Hydrograph for the Kothuwatari watershed was developed by the convolution of the probability density function of travel time with the help of geomorphological characteristics of the watershed, and is finally expressed as:
)
(s
p
t
x
-exp
C
=
h(t)
(
)
j
jk k
1 = j
S
s
… (1)
Where, p (s) is the probability that a drop follows a particular path SK from a finite set of possible paths to reach the outlet
and is given by:
...
k 2
1
1
p
...
.
p
=
p(s)
r xx xk-1x … (2)Fig. 2. Drainage Network Map of Kothuwatari Watershed Depicting Designation of Stream Orders
Fig. 3. Drainage area contribution map of Kothuwatari Watershed
[image:3.595.80.518.423.751.2]where, πrii is the initial state probability, defined as the ratio of
the total area of the overland segment draining directly to stream of order i to the total watersheds area; and Pij is the
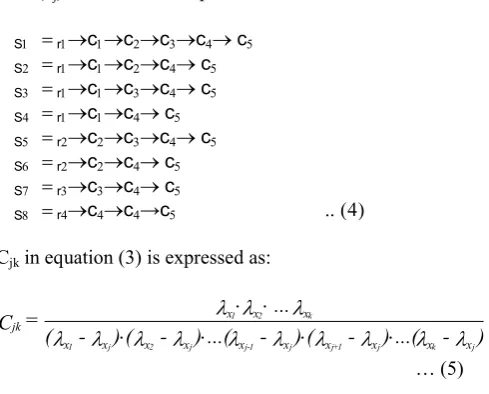
transition probability, defined as the ratio of the number of streams of order i draining to stream of order j to total number of streams of order j. The possible path space for the study area, i.e., for 4th order watershed, is given as:
S = {S1, S2, S3, S4, S5, S6, S7, S8} … (3)
These paths are the combination of overland (rj) and channel
flow (cj) states and are expressed as follows:
S rccccc
S rcccc
S rcccc
S rccc
S rcccc
S rccc
S rccc
S rcc→c
Cjk in equation (3) is expressed as:
) ...( ) ( ) ...( ) ( ) ( ... = C x x x x x x x x x x x x x jk j k j 1 + j j 1 -j j 2 j 1 k 2 1
… (5)Where,
xjis the parameter termed as mean holding time of adrop. The values of parameter
xjare not directly obtainable.However, for overland and channel flow states, these can be determined as:
i
1
L
N
2
A
=
1
i i r 1/3 r i i … (6) and
=
L
1
i
1
i 1/3
ci
… (7)
Where, Ω is the order of the watershed; Nj, number of stream
of order j;
L
j, mean length of stream of order j; and γ is the empirical constant, i.e, estimated from the mean holding time of a given state.
ri,
ci are the parameters for overland andchannel flow state. The mean holding time is obtained from the direct runoff hydrograph of the watershed by equating the first moment of the IUH with that of the DRH. Cjk is
calculated using equation (5) whereas,
xj(xj {rj, cj) iscalculated using equations (6) and (7) for overland and channel flow states, respectively. By substituting the values of
xjin equation (5), the values of Cjk can be obtained. Aftersubstituting the values of Cjk,
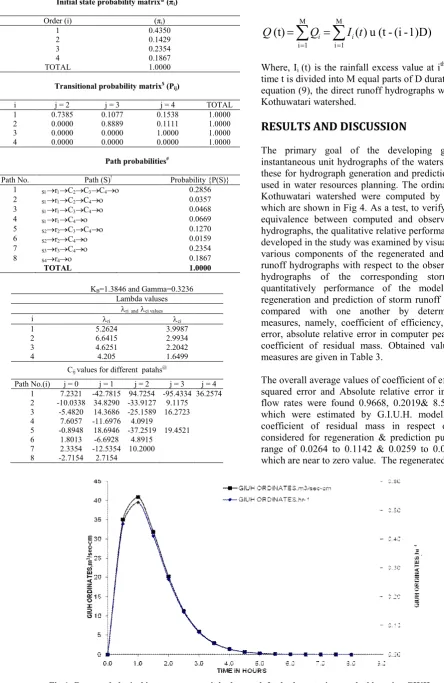
xjand p(s) in equation (1), theGIUH ordinates for the watershed were obtained. Which are Shown its Fig 4.
Estimation of parameters of GIUH model
The required parameters of GIUH model i.e. initial state probabilities, transitional probabilities and path probabilities were estimated by using appropriate method as described by Singhal et. al. (2000) and Singhet. al. (2004). By using the
observed DRH and the estimated net effective rainfall intensity, the mean holding time of the watershed was estimated. From these parameters the coefficients of the final equation (1) were estimated and obtained values are shown in Table 2.
Computation of Direct Runoff Hydrograph
The ordinates of direct runoff hydrograph for the watershed were obtained using the derived GIUH by convoluting the effective rainfall hyetograph with the GIUH. The ordinates of direct runoff hydrograph, Q(t) at any time t may be given as :
t' 0u
)
t
(
Q
(t - τ) I (τ) d τ … (8)Where, u(t) is IUH ordinate; and I (τ) = effective rainfall of duration t0
t' = t when t < t0
[image:4.595.38.283.191.388.2]t' = t0 when t ≥ t0
Table 1. Geomorphological parameters of the Kothuwatari watershed
Order of the basin 4
Stream order, i
Total number of streams, Ni
Total length of streams, Li
Mean stream length, Li
Total area of streams, Ai
Mean stream area, Ai
Area of draining directly to streams, A'I
(km) (km) (km2) (km2) (km2)
1 65 30.0000 0.4615 12.1500 0.1869 12.1500
2 18 19.8045 1.1002 16.1400 0.8967 3.9900
3 4 11.0220 2.7555 22.7150 5.6787 6.5750
4 1 6.5700 6.5700 27.9300 27.9300 5.2150
No. of streams draining directly to streams of higher order
Order 2 3 4
1 48 7 10
2 - 16 2
3 - - 4
Bifurcation ratio (RB) 4.0663
Length ratio (RL) 2.4315
Table 2. Estimated coefficients for GIUH of the Kothuwatari watershed
Initial state probability matrix* (πi)
Order (i) (πi)
1 0.4350
2 0.1429
3 0.2354
4 0.1867
TOTAL 1.0000
Transitional probability matrix$ (Pij)
i j = 2 j = 3 j = 4 TOTAL
1 0.7385 0.1077 0.1538 1.0000
2 0.0000 0.8889 0.1111 1.0000
3 0.0000 0.0000 1.0000 1.0000
4 0.0000 0.0000 0.0000 1.0000
Path probabilities#
Path No. Path (S)! Probability {P(S)}
1 SrCCC 0.2856
2 SrCC 0.0357
3 SrCC 0.0468
4 SrC 0.0669
5 SrCC 0.1270
6 SrC 0.0159
7 SrC 0.2354
8 Sr 0.1867
TOTAL 1.0000
KB=1.3846 and Gamma=0.3236
Lambda valuses
ri and ci values
i ri ci
1 5.2624 3.9987
2 6.6415 2.9934
3 4.6251 2.2042
4 4.205 1.6499
Cij values for different patahs@
Path No.(i) j = 0 j = 1 j = 2 j = 3 j = 4 1 7.2321 -42.7815 94.7254 -95.4334 36.2574 2 -10.0338 34.8290 -33.9127 9.1175
3 -5.4820 14.3686 -25.1589 16.2723 4 7.6057 -11.6976 4.0919
5 -0.8948 18.6946 -37.2519 19.4521 6 1.8013 -6.6928 4.8915
7 2.3354 -12.5354 10.2000
8 -2.7154 2.7154
Above integral is known as convolution integral and is difficult to solve, so an approximate numerical method is adopted to solve the integral as follows.
1)D)
-(i
-(t
u
)
(
(t)
M
1 i M
1 i
t
I
Q
Q
i
i
… (9)Where, Ii (t) is the rainfall excess value at ith part, when total
time t is divided into M equal parts of D duration. By utilizing equation (9), the direct runoff hydrographs were estimated for Kothuwatari watershed.
RESULTS AND DISCUSSION
The primary goal of the developing geomorphological instantaneous unit hydrographs of the watershed was to apply these for hydrograph generation and prediction which may be used in water resources planning. The ordinates of GIUH for Kothuwatari watershed were computed by the equation (1) which are shown in Fig 4. As a test, to verify and validate the equivalence between computed and observed direct runoff hydrographs, the qualitative relative performance of the model developed in the study was examined by visual comparisons of various components of the regenerated and predicted direct runoff hydrographs with respect to the observed direct runoff hydrographs of the corresponding storm events. The quantitatively performance of the model as regards to regeneration and prediction of storm runoff hydrographs was compared with one another by determining statistical measures, namely, coefficient of efficiency, relative squared error, absolute relative error in computer peak flow rates and coefficient of residual mass. Obtained values of statistical measures are given in Table 3.
The overall average values of coefficient of efficiency, relative squared error and Absolute relative error in computed peak flow rates were found 0.9668, 0.2019& 8.5342 respectively which were estimated by G.I.U.H. model. The values of coefficient of residual mass in respect of storm events considered for regeneration & prediction purposes lie in the range of 0.0264 to 0.1142 & 0.0259 to 0.0316 respectively which are near to zero value. The regenerated direct runoff
Fig.4. Geomorphological instantaneous unit hydrograph for kothuwatari watershed by using GIUH model
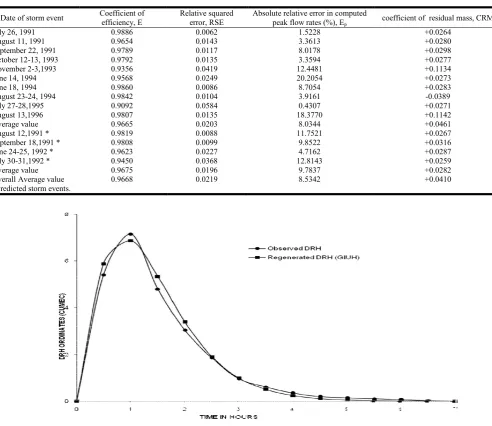
[image:5.595.45.490.89.773.2]Table 3. Estimated values of coefficient of efficiency, relative squared error, absolute relative error in computed peak flow rates and coefficient of residual mass on storm basis for Kothuwatari watershed
Date of storm event Coefficient of efficiency, E
Relative squared error, RSE
Absolute relative error in computed
peak flow rates (%), Ep coefficient of residual mass, CRM
July 26, 1991 0.9886 0.0062 1.5228 +0.0264
August 11, 1991 0.9654 0.0143 3.3613 +0.0280
September 22, 1991 0.9789 0.0117 8.0178 +0.0298
October 12-13, 1993 0.9792 0.0135 3.3594 +0.0277
November 2-3,1993 0.9356 0.0419 12.4481 +0.1134
June 14, 1994 0.9568 0.0249 20.2054 +0.0273
June 18, 1994 0.9860 0.0086 8.7054 +0.0283
August 23-24, 1994 0.9842 0.0104 3.9161 -0.0389
July 27-28,1995 0.9092 0.0584 0.4307 +0.0271
August 13,1996 0.9807 0.0135 18.3770 +0.1142
Average value 0.9665 0.0203 8.0344 +0.0461
August 12,1991 * 0.9819 0.0088 11.7521 +0.0267
September 18,1991 * 0.9808 0.0099 9.8522 +0.0316
June 24-25, 1992 * 0.9623 0.0227 4.7162 +0.0287
July 30-31,1992 * 0.9450 0.0368 12.8143 +0.0259
Average value 0.9675 0.0196 9.7837 +0.0282
Overall Average value 0.9668 0.0219 8.5342 +0.0410
[image:6.595.38.561.94.283.2]*Predicted storm events.
Fig. 5. Comparison of Observed and Regenerated Direct Runoff Hydrographs for the Storm Event of August 23-24, 1994 for Kothuwatari Watershed
[image:6.595.109.503.561.755.2]hydrograph for the representative storm event of August 23-24, 1994 and the predicted direct run off hydrograph for the representative storm event of June 24-25, 1992 are illustrated in Fig. 5 and Fig. 6, respectively for comparison with the observed direct runoff hydrographs of the corresponding storm event. On the basis of the qualitative and quantitative performance of the GIUH model with regards to regenerating and predicting of the direct runoff hydrographs, it is concluded that GIUH model simulates well with closer agreement with the observed direct runoff hydrographs and it can very well be used with sufficient degree of accuracy to study the rainfall-runoff transformation process for the test watershed. This model can also be employed for derivation of direct runoff hydrographs with reasonable accuracy in other watershed possessing similar hydrometrological conditions.
Conclusion
Based on the overall qualitative, quantitative performance of the model, the GIUH model can very well be used for regeneration and prediction of direct runoff hydrographs with sufficient degree of accuracy.
Acknowledgements
The authors are grateful to Soil Conservation Department, Damoder Valley Corporation, Hazaribagh (Jharkhand State) for providing the data used in the investigations. The authors are thankful to the G.B. Pant University of Agriculture and Technology, Pantnagar-263 145, U.S. Nagar, Uttaranchal (India) for providing the facilities during the investigations.
REFERENCES
Gupta, V.K. and Waymire, E. 1983. On the formulation of an analytical approach to hydrologic response and similarity at basin scale. Journal of Hydrology, 65:95-123.
Gupta, V.K., Waymire, E. and Wang, C.T. 1980. A representation of an instantaneous unit hydrograph from geomorphology. Water Resources Research, 16 (5):855-862.
Horton, R.E. 1945. Erosional development of streams and their drainage basins: hydrological approach to quantitative morphology. Bulletin Geological Society of America, 56:275-370.
Rodriguez-Iturbe, I. and Valdes, J.B. 1979. The geomorphologic structure of hydrologic response. Water
Resource Research, 15 (6):1409-1420.
Singh, B.R., Kumar, V. and Singh, S.K. 2004. “Development of a Geomorphological Instantaneous Unit Hydrograph (GIUH) for mandapa watershed”-Lead technical paper, proceeding of the National symposium of “second generation problem in Agriculture and its remedies” held at S.V.P.U.A. & T, Meerut U.P. during 26-27 November ,2004, pp 162-170.
Singh, M.K., Panigrahy, N. and Singh, R. 2000. Development, calibration and validation of Geomorphological Instantaneous Unit Hydrograph (GIUH) model for small watershed. IE (I) Journal of the Institution of Engineers (India), 80: 27-34.