ANALYSIS OF SUCCESS FACTORS IN THE
IMPLEMENTATION OF ERP SYSTEM IN RESEARCH
INSTITUTE
1INDRA BUDI, 2HABIBUL RAFUR
1,2
Faculty of Computer Science, Universitas Indonesia
E-mail: [email protected], [email protected]
ABSTRACT
Organizations must be able to determine success factors in adopting and implementing Enterprise Resource Planning (ERP) system to get benefit as much as possible. Different kind of organization may be needed different success factors in implementing ERP system. Purpose of this research is to analyze the relationship between success factors and success indicators for implementation of ERP system in research institute. This research contributes to identify which the success factors are relevant for the implementation of ERP for research institute. This research uses three models, namely DeLone & McLean IS Success Model, Technology Acceptance Model 2, and the success factors in project management of ERP systems implementation. These models include variables that can indicate success factors and their relationship in implementation of ERP system. The analysis technique that used are descriptive statistics and correlation testing. This research uses National Nuclear Energy Agency in Indonesia, namely BATAN, as case study. This research finds that the success factors for the implementation of ERP are system quality, image, result demonstrability, internal support, and software selection. Those factors can affect the success indicators through an intermediary factor, namely perceived usefulness.
Keywords: D&M IS Success Model, TAM2, project management success factors, ERP System Implementation, Research Institute.
1. INTRODUCTION
Enterprise Resource Planning (ERP) system has been very popular in middle and big company for the last ten years [1]. ERP system is integrated information system for organization that used for organize resource, information, and business function from database that shared across the business functions of the organization [1, 2].
The fitness between ERP system and organization is believed to be the critical success factors of ERP implementation [3, 4, 5]. Information system implementation also needs support from management and employees to success the information system implementation [1, 6]. Therefore, analysis of success factor in implementation of ERP system is important to get benefit from ERP implementation.
Todays, many organization who implementing ERP are business organization, the use of ERP in other organization still rare, including in research institution. In the other hand, research institution also needs the benefits of ERP systems [7]. Research institutions need to manage their
resources to help them run business processes. Research institutions also need to integrate all the functions of an organization into a single computer system that can serve different needs of all departments of research institutions. Research of ERP in research institution is still infrequent [7]. It is important doing research in this area because of several reasons, which are: lack of research related to ERP systems in research institutions, the high failure rate of ERP system implementation, and the poor fitness between the organization and ERP systems are implemented.
National Nuclear Energy Agency in Indonesia (BATAN) is research institute that working in nuclear research and development in Indonesia that has implemented ERP system to support their research process. ERP system that owned by BATAN is called Sistem Informasi
Pengelolaan Litbangyasa (SIPL). BATAN uses
and publication or dissemination of the research results.
This paper describes evaluation of the implementation success factors for ERP systems in research institutes (BATAN) based on success indicators in the implementation of ERP systems. This paper will only analyze relationship between success factors with success indicators in implementation of ERP systems in research institutions using correlation testing. Rest of this paper organized as follows. The next section describes literature background, the third section describe the methodology, result and analysis is described in fourth section and it concludes in fifth section.
2. LITERATURE REVIEW
Chyan and Yi-fen defined Enterprise Resource planning (ERP) as a coordinating calculation system of enterprise that has been designed for automation of material currents information and financial supply in all application in an organization on informative base [8]. Meanwhile McGaughey and Sumner defined ERP System as system that used to manage organization’s resources with some of the traits, i.e. (1) multi module application software; (2) support, automation, integrate, simplify, and increase some of an organization's business processes, both within the business functions and across business functions; (3) share common practice and data; and (4) produce and access information in real-time environment [9,10].
Many researches had been conducting in exploring critical success factor in implementing ERP in some organizations. Kyung-Kwon suggested three major critical success factors, which are top management, client and user [3]. Ağaoğlu proposed two main factors (ERP adopting organization environment and ERP system environment) as the critical success factors [12]. There are still a few researches in ERP system implementation in the research institute. de Sousa describes an implementation of ERP system as management information system at Research and Technology Organization (RTO) [7]. They developed the system by focusing on two modules, laboratory information management and technical information management for research. ERP system develop based on master plan which describe all business processes in the institution. Master plan
consists of programs, subprograms, and all activities to support business process in the organization.
Main functions from ERP system for RTO are operational function for research planning and mechanism on how to implement the planning. Operational function for research planning is the planning function, what activities will be carried out by the research and how to make reporting on the result. ERP system is expected to provide a report on the research plan and can be used as tool for monitoring and evaluation [7].
DeLone suggests interactive and taxonomy model as framework for information system success model. There are 180 articles related to measurement of information system success that use DeLone & McLean IS Success Model or D&M IS Success Model [11]. DeLone and McLean say that the use of system can be used in measuring information system success, but researcher must give attention to nature of system use, quality, and accuracy of system use. Nature of system use can be measured by how much system functions are used for some purposes. Development of system use is measured from how much information can be used from non-main system function [11].
Dong explained that Technology Acceptance Model (TAM) was introduced by Davis et al. in 1989 as instrument to predict likelihood of new technology that adopted by organization [12]. The purpose of TAM is to give explanation about acceptance factors in adopt the new information technology that related to behavior of many kinds of end user. TAM gives fundamental concept to find relation between external variables and internal beliefs, attitudes, and intentions [12]. Internal belief consists of perceived usefulness and perceived ease of use. TAM explains that use of technology is determined by intention of using the system, user’s attitude, and perceived usefulness. TAM explains that effect of external variable to intention of use must through perceived usefulness and perceived ease of use. TAM also explains that perceived usefulness is influenced by perceived ease of use because the easier using the system, the more benefit for individual or organization [12].
are not explained explicitly [13]. Hence, Venkatesh and Davis added external variables and defined them explicitly. The purposes of TAM2 are to find out important factor beside perceived usefulness and perceived ease of use, expand adaptation of using technology acceptance model [13]. External variables in TAM2 consist of social influence processes (subjective norm, voluntariness, and image) and cognitive instrumental processes (job relevance, output quality, result demonstrability, and perceived ease of use).
Chung identified four success factors can represent success factor for ERP implementation, which are: (1) top-management support, planning, training, and team contributions; (2) software-selection efforts; (3) information-systems area participation; and (4) consultant capability and support. Those factors can influence success indicator of project like time, cost or budget, quality, and scope. Project success can give impacts to net benefit of organization [14, 15].
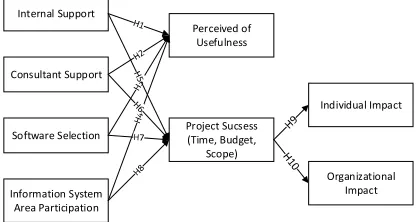
Based on above literatures, we proposed a model (Figure 1) for success factors for ERP system implementation, which consist of three parts: success factors, main construct and success indicators. Success factors adopted from D&M IS Model which are (1) internal support, (2) software selection, (3) information system area participation, and (4) consulting support. Main construct for ERP system implementation are perceived usefulness, which come from TAM, and success indicators for ERP system implementation are (1) individual impact, (2) organizational impact, and (3) project success from time, cost or budget, quality, and scope.
Internal Support
Consultant Support
Software Selection
Information System Area Participation
Perceived of Usefulness
Project Sucsess (Time, Budget,
Scope)
Individual Impact
Organizational Impact
Figure 1. Model for Analysis Success Factor in Implementation of ERP System
Analysis success factor in implementation of ERP system will test 10 hypotheses. The hypotheses are:
H1. Internal support gives impact to perceived usefulness positively.
H2. Consultant support gives impact to perceived usefulness positively.
H3. Software selection gives impact to perceived usefulness positively.
H4. Information system area participation gives impact to perceived usefulness positively. H5. Internal support gives impact to project success positively.
H6. Consultant support gives impact to project success positively.
H7. Software selection gives impact to project success positively.
H8. Information system area participation gives impact to project success positively.
H9. Project success gives impact to individual impact positively.
H10. Project success gives impact to organizational impact positively.
3. RESEARCH METHODOLOGY
We used qualitative and quantitative approaches as the research methodology. In qualitative approach, we used interview method, to understand (1) organization’s characteristic, (2) business process organization related to research activities and development, and (3) how ERP system can help business process organization. We used survey with Likert-5 scale to data collection for quantitative approach.
We distribute questioner to all staffs of Information Technology Department of BATAN who include in SIPL implementation project as population of this research.
Evaluation of success factor in ERP system implementation uses descriptive statistic technique, such as mode, mean, and standard deviation. This technique is used because amount of questioner for analyze success factor in ERP system implementation are just seven questioners from 10 samples. Analyze for success factor in ERP system implementation sees scale from the answer or every indicator from seven respondents, and then find mode, mean, and standard deviation for every indicator from its latent variable.
[image:3.612.90.298.541.652.2]implementation to answer some of hypothesis. SPSS version 20.0 is used to calculate parameter for evaluation of success factor in ERP system implementation. SPSS is chosen because SPSS is tools that often used by statistical analysis to calculate mean, mode, standard deviation, and correlation testing
4. ANALYSIS AND DISCUSSIONS
This section explains about ERP system at case study BATAN, description of the demographic data of respondents, and presents the analysis results of data.
BATAN has ERP system called Sistem Informasi Pengelolaan Litbangyasa (SIPL) to help business process in doing research activities. SIPL is system that developed by BATAN by utilize the IT staff BATAN. SIPL is system that almost includes all of process business in BATAN related to research and development that can reduces using of papers. SIPL has some main function, i.e. research planning function, reporting of research function, monitoring function, assessment or evaluation function, recapitulation function, official data functions, financial function, and system settings, such as changing the year activities and some parameters related to SIPL.
There are 10 questioners that are returned from 10 respondents that are included in SIPL implementation project, but only seven questioners are valid, six from IT staff BATAN and one from Head Officer. Three respondents have five years of working experience; two respondents have eight years of working experience and one IT staff has been working for 27 years and one Head Officer as respondent has working experience for 21 years.
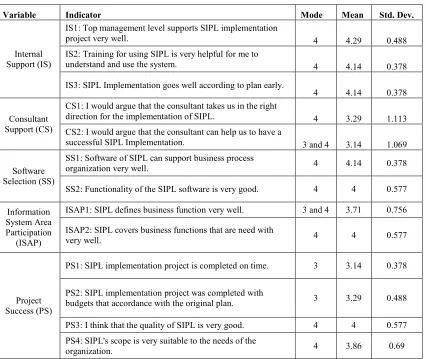
Table 2 shows the values of mode, mean and standard deviation for all variables and indicators. For internal support, it shows that respondents are more agree with support from internal of organization related to SIPL implementation, both SIPL user and top management level. It indicates that internal support can be success factor in ERP system implementation.
In consultant support variable, respondents are more agree to choose neutral for support from consultant related to SIPL implementation. The answer's diversity is quite high if it is seen from standard deviation of two indicators for consultant support. This indicates that the variable consultant
support cannot be considered as success factors for implementing ERP systems in BATAN.
Meanwhile, for software selection variable, the table shows that respondents are more agree with software selection gives impact to SIPL implementation. It indicates that software selection can be success factor for implementing ERP systems in BATAN.
Table 2 also shows that respondents are more agree with SIPL can defines business functions very well and those functions are suitable with business function organization. It indicates that information system area participation can be success factor for implementing ERP systems in BATAN.
Based on project success criteria, there are two indicators (quality and scope) that indicate agreement from respondent. It shows that SIPL implementation project only fulfill the success category in quality and scope.
Hypothesis Testing
Hypothesis testing for success factor in ERP system implementation model at case study uses correlation testing between latent variable’s indicators based on hypothesis in figure 1. Table 1 and Table 3-9 show the results of the hypothesis testing.
Table 1. Correlation Testing Result between Internal Support’s Indicators and Perceived Usefulness’
Indicators Related to H1
Correlations PU1 PU2 PU3 PU4
IS1 Pearson Correlation
.710 .710 .710 .548
Sig. (2-tailed) .074 .074 .074 .203
N 7 7 7 7
IS2 Pearson Correlation
.750 .750 .750 .354
Sig. (2-tailed) .052 .052 .052 .437
N 7 7 7 7
IS3 Pearson Correlation
.167 .167 .167 .354
Sig. (2-tailed) .721 .721 .721 .437
N 7 7 7 7
Table 2. Mode, Mean, and Standard Deviation Values for All Indicators
Variable Indicator Mode Mean Std. Dev.
Internal Support (IS)
IS1: Top management level supports SIPL implementation
project very well. 4 4.29 0.488
IS2: Training for using SIPL is very helpful for me to
understand and use the system. 4 4.14 0.378
IS3: SIPL Implementation goes well according to plan early.
4 4.14 0.378
Consultant Support (CS)
CS1: I would argue that the consultant takes us in the right
direction for the implementation of SIPL. 4 3.29 1.113 CS2: I would argue that the consultant can help us to have a
successful SIPL Implementation. 3 and 4 3.14 1.069
Software Selection (SS)
SS1: Software of SIPL can support business process
organization very well. 4 4.14 0.378
SS2: Functionality of the SIPL software is very good. 4 4 0.577 Information
System Area Participation
(ISAP)
ISAP1: SIPL defines business function very well. 3 and 4 3.71 0.756 ISAP2: SIPL covers business functions that are need with
very well. 4 4 0.577
Project Success (PS)
PS1: SIPL implementation project is completed on time. 3 3.14 0.378
PS2: SIPL implementation project was completed with
budgets that accordance with the original plan. 3 3.29 0.488 PS3: I think that the quality of SIPL is very good. 4 4 0.577 PS4: SIPL's scope is very suitable to the needs of the
organization. 4 3.86 0.69
Table 1 shows that sample correlation coefficient value between indicator IS1, IS2, and IS3 to indicator PU1, PU2, PU3, and PU4 has positive value but not significant because significant value is more than 0.05 for all indicators of internal support that correlated to perceived usefulness.
Based on the values of mode, mean, and standard deviation for all indicators of consultant support in table 1, it shows that respondents are neutral to consultant support related to SIPL implementation. It indicates that consultant support is not considered as success factor in ERP system implementation at BATAN. Therefore, correlation testing between consultant support and perceived usefulness related hypothesis to H2 and between consultant support and project success related to hypothesis H6 are unnecessary to be done. H2 and
H6 are automatically rejected because consultant support is not considered as success factor.
ERP systems according to respondents. Table 1 shows that respondents are more agree with SIPL can defines business functions very well and those functions are suitable with business function organization. It indicates that information system area participation can be success factor for implementing ERP systems. Those four indicators for project success in Table 1 represent success category in information system implementation project from time, budget, quality, and scope. Based on mode, mean, and standard deviation in table 1, only indicator PS3 and PS4 indicate agreement from respondent. It shows that SIPL implementation project only fulfill the success category in quality and scope.
Table 3. Correlation Testing Result between Software Selection’s Indicators and Perceived Usefulness’
Indicators related to H3
Correlations PU1 PU2 PU3 PU4
SS1 Pearson Correlation
.750 .750 .750 .354
Sig. (2-tailed)
.052 .052 .052 .437
N 7 7 7 7
SS2 Pearson Correlation
.764* .764* .764* .540
Sig. (2-tailed)
.046 .046 .046 .211
N 7 7 7 7
*. Correlation is significant at the 0.05 level (2-tailed). **. Correlation is significant at the 0.01 level (2-tailed).
Table 3 shows that SS2 gives impact to PU1, PU2, and PU3 significantly. It indicates that good functionality of SIPL software has significant positive correlation with perceived usefulness. When we see that correlation between SS1 with PU1, PU2, and PU3 have significant value (0.052), it only has 0,002 different from minimum standard of significant value (0.005). In general, it shows that software selection has positive impact to PU1, PU2, and PU3 significantly. Therefore, selection software is considered positively correlated with perceived usefulness significantly.
Table 4 shows that all indicators from information system area participation have negative correlation with indicators PU1, PU2, and PU3. Correlation between ISAP1 and PU4 has positive value, but significant level is too high so it doesn’t have significant impact. ISAP2 has correlation value 0 to PU4. It indicates that ISAP2 doesn’t have correlation with PU4. Overall, Indicators from information system area participation don’t have positive impact to perceived usefulness.
Table 4. Correlation Testing Result between Information System Area Participation’s Indicators and Perceived
Usefulness’ Indicators Related to H4
Correlations PU1 PU2 PU3 PU4
ISAP1 Pearson Correlation
.167 .167 .167 .059
Sig. (2-tailed)
.721 .721 .721 .900
N 7 7 7 7
ISAP2 Pearson Correlation
.382 .382 .382 .000
Sig. (2-tailed)
.398 .398 .398 1.000
N 7 7 7 7
*. Correlation is significant at the 0.05 level (2-tailed). **. Correlation is significant at the 0.01 level (2-tailed).
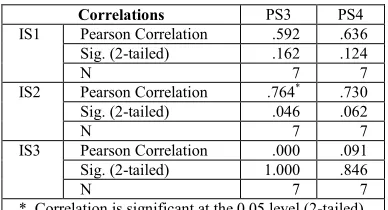
Table 5 shows that all indicators from internal support have positive correlation with indicators of project success, except indicator IS3 toward PS3. Based on this result, it confirms that process of SIPL implementation doesn't have any impact on project success in quality criteria. Although the correlation between the IS3 and PS4 is positive, but significant value is too high so that implementation of SIPL goes well in accordance with the original plan can provide insignificant impact on project success in scope criteria. There is significant relationship between IS2 and PS3 because significant value from that correlation is less than 0.05. It indicates that training for SIPL user can give positive impact and significant toward project success in quality criteria. Overall, internal support has positive impact toward project success in quality and scope criteria, but insignificant.
Table 5. Correlation testing result between Internal Support’s Indicators and Project Success’ Indicators
Related to H5
Correlations PS3 PS4
IS1 Pearson Correlation .592 .636 Sig. (2-tailed) .162 .124
N 7 7
IS2 Pearson Correlation .764* .730 Sig. (2-tailed) .046 .062
N 7 7
IS3 Pearson Correlation .000 .091 Sig. (2-tailed) 1.000 .846
N 7 7
*. Correlation is significant at the 0.05 level (2-tailed).
[image:6.612.85.305.305.431.2] [image:6.612.321.515.510.615.2]Table 6. Correlation Testing Result between Software Selection’s Indicators and Project Success’s Indicators
Related to H7
Correlations PS3 PS4
SS1 Pearson Correlation .764* .730
Sig. (2-tailed) .046 .062
N 7 7
SS2 Pearson Correlation 1.000** .837*
Sig. (2-tailed) .000 .019
N 7 7
*. Correlation is significant at the 0.05 level (2-tailed). **. Correlation is significant at the 0.01 level (2-tailed).
[image:7.612.94.295.129.199.2]Table 7 shows that all indicators of information system area participation have negative correlation with indicators of project success in quality and scope criteria. It indicates that there is no positive impact from information system area participation toward project success.
Table 7. Correlation Testing Result between Information System Area Participation’s Indicators and Project
Success’ Indicators Related to H8
Correlations PS3 PS4
ISAP1 Pearson Correlation -.382 -.091 Sig. (2-tailed) .398 .846
N 7 7
ISAP2 Pearson Correlation -.500 -.418 Sig. (2-tailed) .253 .350
N 7 7
*. Correlation is significant at the 0.05 level (2-tailed).
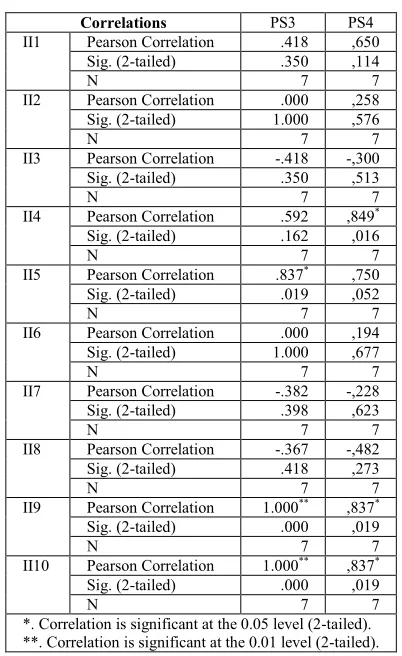
Table 8 shows that correlation between PS3 with II5, II9, and II10 have positive correlation significantly. PS4 also has positive correlation significantly with II4, II9, and II10 if it is seen from correlation value of those relationship are more than 0 with significant value that less than 0.05. Overall, project success in quality and scope criteria can give positive and significant impact to SIPL user for (1) fulfill the user’s needs, (2) expand the IT opportunities, (3) increase individual productivity, and (4) useful for individual tasks.
Table 8. Correlation Testing Result between Project Success’ Indicators and Individual Impact’s Indicators
Related to H9
Correlations PS3 PS4
II1 Pearson Correlation .418 ,650 Sig. (2-tailed) .350 ,114
N 7 7
II2 Pearson Correlation .000 ,258 Sig. (2-tailed) 1.000 ,576
N 7 7
II3 Pearson Correlation -.418 -,300 Sig. (2-tailed) .350 ,513
N 7 7
II4 Pearson Correlation .592 ,849*
Sig. (2-tailed) .162 ,016
N 7 7
II5 Pearson Correlation .837* ,750
Sig. (2-tailed) .019 ,052
N 7 7
II6 Pearson Correlation .000 ,194 Sig. (2-tailed) 1.000 ,677
N 7 7
II7 Pearson Correlation -.382 -,228 Sig. (2-tailed) .398 ,623
N 7 7
II8 Pearson Correlation -.367 -,482 Sig. (2-tailed) .418 ,273
N 7 7
II9 Pearson Correlation 1.000** ,837*
Sig. (2-tailed) .000 ,019
N 7 7
II10 Pearson Correlation 1.000** ,837*
Sig. (2-tailed) .000 ,019
N 7 7
*. Correlation is significant at the 0.05 level (2-tailed). **. Correlation is significant at the 0.01 level (2-tailed).
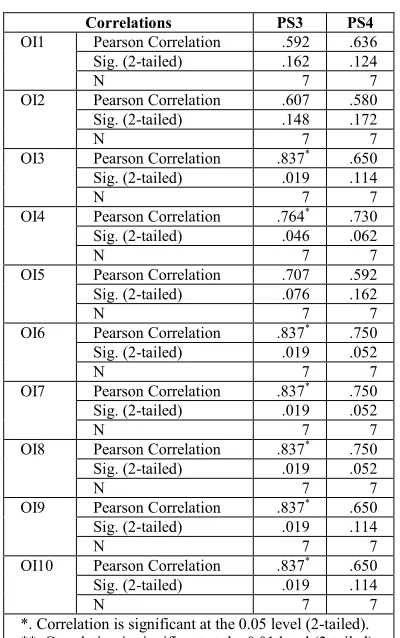
[image:7.612.98.291.339.422.2]Table 9. Correlation Testing Result between Project Success’ Indicators and Organizational Impact’s
Indicators
Correlations PS3 PS4
OI1 Pearson Correlation .592 .636 Sig. (2-tailed) .162 .124
N 7 7
OI2 Pearson Correlation .607 .580 Sig. (2-tailed) .148 .172
N 7 7
OI3 Pearson Correlation .837* .650
Sig. (2-tailed) .019 .114
N 7 7
OI4 Pearson Correlation .764* .730
Sig. (2-tailed) .046 .062
N 7 7
OI5 Pearson Correlation .707 .592 Sig. (2-tailed) .076 .162
N 7 7
OI6 Pearson Correlation .837* .750 Sig. (2-tailed) .019 .052
N 7 7
OI7 Pearson Correlation .837* .750
Sig. (2-tailed) .019 .052
N 7 7
OI8 Pearson Correlation .837* .750
Sig. (2-tailed) .019 .052
N 7 7
OI9 Pearson Correlation .837* .650
Sig. (2-tailed) .019 .114
N 7 7
OI10 Pearson Correlation .837* .650
Sig. (2-tailed) .019 .114
N 7 7
*. Correlation is significant at the 0.05 level (2-tailed). **. Correlation is significant at the 0.01 level (2-tailed).
5. CONCLUSIONS
Based on research question and based on analysis result with PLS and descriptive statistic, it was concluded that there are several success factors, success indicators, and impact of variable for implementation of ERP systems at research institute. Analysis results show that there are two success factors that can give impact directly to success indicator in implementation of ERP system, which are internal support and software selection. Analysis results show only internal support and software selection have impact to determine the success of implementation ERP system in research institution. Compare to all success factor for implementation ERP system in literature review, research institution only need to focus on internal support and software selection for implementation ERP system. Both factors can influence success criteria of ERP system implementation project in quality and scope criteria. Internal support and software selection will give impact indirectly to individual and organization.
6. LIMITATIONS
Although this research has reached its aims, there were some unavoidable limitation. First, this research was conducted only on a small size of correspondent that related to implementation ERP in research institution. Therefore, to generalize the result for larger group, this result should have involved more participant for different research institution which have implement ERP System. Although, it is hard to find research institution have implement ERP System. Second, there are very limit study about implementation ERP system in research institution. Finally, not all research institutions are suitable to implement ERP system for their business function. Therefore, it is hard to find the correspondent for this study.
REFERENCES:
[1] J. Kallunki, E.K. Laitinen, and Silvola, H, Impact of enterprise resource planning systems on management control systems and firm performance, International Journal of Accounting Information Systems, Vol. 12 No. 1, 2011, pp. 20-39.
[1a] A.CY. Houa, Y.C. Chen, R.A. Shang, "Mutual relations in ERP implementation: the impacts of work alienation and organizational support in state-owned enterprise", Procedia Computer Science, vol. 100, pp. 1289-1296, 2016.
[2] H. Kyung-Kwon and K. Young-Gul, The critical success factors for ERP implementation: An organizational fit perspective. Information & Management, Vol. 40 No. 1, 2002, pp. 25-40. [2a] E. Hustad, M. Haddara, and B. Kalvenes, "ERP
and organizational misfits: An ERP customization journey", Procedia Computer Science, Volume 100, pp. 429-439, 2016. [2b] M. Munir Ahmad and R.P. Cuenca, "Critical
success factors for ERP implementation in SMEs", Robotics and Computer-Integrated Manufacturing, vol. 29, pp 104-111, 2013. [2c] S. Ahmadi, E. Papageorgiou, C.H. Yeh, and R.
Martin, "Managing readiness-relevant activities for the organizational dimension of ERP implementation" Computers in Industry, vol 68, pp. 89-104, 2015.
[4] Y. Chyan, and S. Yi-fen, “A Structural equation model for analyzing the impact of Erpon SCM”,
J. Elservier, 37: 456-469 Cycle, Electronic
Commerce, and Risk. UK: Cambridge
University Press, 2010.
[5] R.E., McGaughey and A. Gunasekaran, “Enterprise Resource Planning (ERP): Past, Present and future”, International Journal of Enterprise Information Systems, 3 (3), 2007, pp. 23-30.
[6] M. Sumner, “Enterprise Resource Planning”,
Upper Saddle River, New Jersey: Prentice Hall,
2005.
[11] W.H, DeLone and E.R, McLean, “The DeLone and McLean model of information systems success: A ten-year update”, Journal of
Management Information Systems, 19(4), 2003,
pp 9-30.
[12] T. Dong Ping and Lian Jin, C, “A review of the evolution of research on information Technology Acceptance Model”, Business
Management and Electronic Information
(BMEI) International Conference, 2, 588-591, 2008.
[13] Venkatesh, V., & Davis, F. D, “A theoretical extension of the technology acceptance model: Four longitudinal field studies”, Management Science, 46, 186–204, 2000.
[14] B. Chung, “An analysis of success and failure factors for ERP systems in engineering and construction firms”, (Order No. 3297265,
University of Maryland, College Park).
ProQuest Dissertations and Theses, 234, 2007.
Appendix 1: Example Question for Questioner
Give a checkmark (√) in one of the five scale available Scale:
1 = Strongly Disagree 5 = Strongly Agree
1 2 3 4 5
Success Factor
a. Internal Support
No. Question 1 2 3 4 5
1. Top management give great support in SIPL implementation project.
2. Training for using SIPL is very helpful to understand the system and give more understanding of the system.
3. The implementation of SIPL went well according to the original plan.
Intermediate Construct
a. Perceived Usefulness
No. Question 1 2 3 4 5
1. Using SIPL improve my work performance. 2. Using SIPL improve my productivity. 3. Using SIPL improve my effectivity.
4. Overall, using SIPL is very useful for my work.
Success Indicator
a. Organizational Impact
No. Question 1 2 3 4 5
1. My organization can save operation cost by using SIPL 2. My organization can increase revenue by using SIPL 3. Increase competitiveness or strategic advantage. 4. Allows organizations more adaptable to changes.
5. Build and maintain good image and reputation with management. 6. SIPL improve organization business process.
7. SIPL can help organization to change business process. 8. SIPL improve decision making.