Copyright © 2000, American Society for Microbiology. All Rights Reserved.
Computer-Assisted Analysis and Epidemiological Value of
Genotyping Methods for
Campylobacter jejuni
and
Campylobacter coli
PAULODEBOER,1,2* BIRGITTA DUIM,1ALAN RIGTER,1JANVAN DERPLAS,3
WILMA F. JACOBS-REITSMA,1ANDJAAP A. WAGENAAR1
Department of Bacteriology, Institute for Animal Science and Health, Lelystad,1Utrecht University, Utrecht,2
and TNO Nutrition and Food Research Institute, Zeist,3The Netherlands
Received 29 November 1999/Returned for modification 21 January 2000/Accepted 23 February 2000
For epidemiological tracing of the thermotolerantCampylobacterspeciesC. jejuniandC. coli, reliable and highly discriminatory typing techniques are necessary. In this study the genotyping techniques of flagellin typing (flaAtyping), pulsed-field gel electrophoresis (PFGE), automated ribotyping, and amplified fragment length polymorphism (AFLP) fingerprinting were compared. The following aspects were compared: computer-assisted analysis, discriminatory power, and use for epidemiological typing of campylobacters. A set of 50 campylobacter poultry isolates from The Netherlands and neighboring countries was analyzed. Computer-assisted analysis made cluster analysis possible and eased the designation of different genotypes. AFLP fingerprinting was the most discriminatory technique, identifying 41 distinct genotypes, while PFGE identified 38 different types,flaAtyping discriminated 31 different types, and ribotyping discriminated 26 different types. Furthermore, AFLP analysis was the most suitable method for computer-assisted data analysis. In some cases combining the results of AFLP fingerprinting, PFGE, andflaAtyping increased our ability to differentiate strains that appeared genetically related. We conclude that AFLP is a highly discriminatory typing method and well suited for computer-assisted data analysis; however, for optimal typing of campylobacters, a combination of multiple typing methods is needed.
The thermotolerant Campylobacter species Campylobacter jejuniandCampylobacter coliare a major cause of human acute enteritis all over the world (18). A main source of human infection is thought to be the consumption of contaminated poultry meat (20, 21). To date, however, infection routes of broiler flocks are still unknown. Reliable and powerful typing methods forCampylobacterare necessary in order to gain more insight into these infection routes.
Traditionally, phenotyping methods such as serotyping, phage typing, and biotyping have been used. The drawbacks of these methods are their restricted resolutions, the lack of spe-cific reagents for serotyping, and a large portion of untypeable strains.
To resolve these problems, attention has turned to genotyp-ing methods that are more generally available and applicable. Several techniques have been developed and are in general use already, such as flagellin typing (flaAtyping) (1, 12), pulsed-field gel electrophoresis (PFGE) (2, 6, 27), and ribotyping (5, 15). These methods were an improvement in comparison to the older phenotyping techniques; however, none of these combines high resolution, high throughput, and simple, reli-able data analysis. In order to fulfill these needs, the amplified fragment length polymorphism (AFLP) technique has been adjusted for use withCampylobacter(4, 10).
Interpretation of data is an extremely important aspect of genotyping techniques. Results of phenotyping techniques are often “black or white” or “present or absent,” whereas results of genotyping techniques are often complicated banding pat-terns. Band presence or absence, position, and intensity are
relevant input data in comparison analyses. Analysis of geno-typing data in a numeric manner requires computer assistance. Furthermore, computer-assisted analysis allows data sharing and can ease the processing of large numbers of samples.
The purpose of this study was to establish an optimal typing system forCampylobacterwith regard for the above-mentioned considerations. We performed a comparative analysis offlaA
typing, PFGE, ribotyping, and AFLP fingerprinting using a set of 50 poultry isolates. Advantages and disadvantages of com-puter-assisted data analysis and the discriminatory powers of the four different techniques were compared. With these re-sults, the potential for automated analysis in epidemiological typing ofCampylobacterwas examined.
MATERIALS AND METHODS
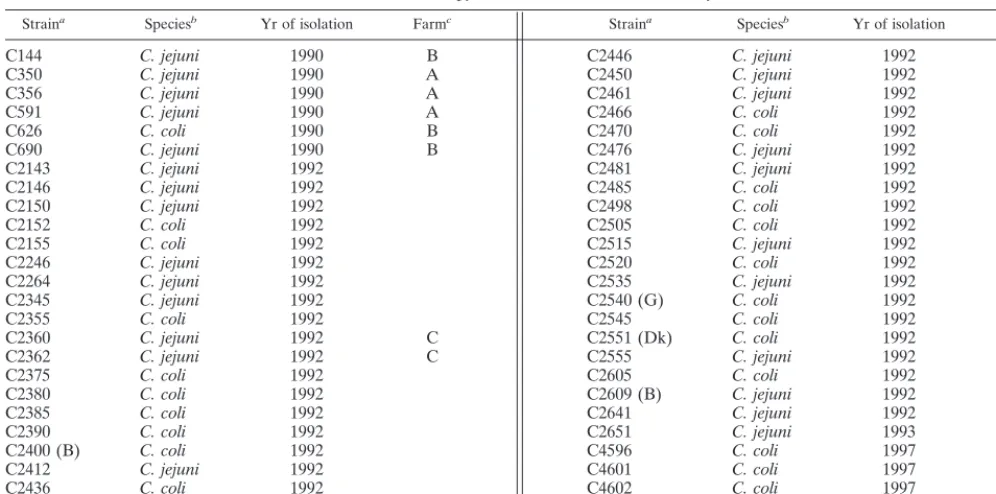
Bacterial strains and culture conditions.FiftyC. jejuniandC. colistrains
isolated from poultry from dispersed places in The Netherlands (46 strains) and neighboring countries (4 strains) over a period of time (1990, 1992, 1993, and 1997) were used in this study (Table 1). Strains were grown on heart infusion plates containing 5% sheep blood for 48 h (24 h for preparations of PFGE plugs) at 42°C under microaerobic conditions. Alternatively, for storage and sample preparation for ribotyping, strains were grown overnight in heart infusion broth at 37°C under microaerobic conditions with gentle shaking (100 rpm). Strains were stored at⫺80°C in heart infusion broth containing 15% glycerol.
Genomic DNA isolation.Genomic DNAs were extracted from 48-h-old
cul-tures using a Wizard genomic DNA purification kit (Promega, Madison, Wis.).
flaAtyping.PCR mixtures for flagellin A (flaA) typing contained 50 mM KCl,
10 mM Tris-HCl (pH 9.0), 0.01% (wt/vol) gelatin, 2 mM MgCl2, 0.2M each
deoxynucleoside triphosphate, 50 pmol of theflaAprimer (5⬘-CGTATTAACA CAAATGTTGCAGC-3⬘, adapted from reference 1), 50 pmol of theflaRprimer (5⬘-GATTTGTTATAGCAGTTTCTGCTATATCC-3⬘, adapted from reference 1), 50 pmol of the template (genomic DNA), and 2.5 U of AmpliTaq DNA polymerase (Perkin-Elmer), with a total reaction volume of 50l. Reaction conditions were 94°C for 60 s, followed by 45 cycles of 45 s of 94°C, 45 s of 55°C, and 2 min of 72°C, and ended with 5 min of 72°C. After verification of the PCR product, 12.5l of the amplicon was digested for 2 h at 37°C using 10 U ofDdeI (Boehringer Mannheim, GmbH, Mannheim, Germany) in a total volume of 15 l. After digestion, restriction fragments were separated on an agarose gel containing 2.0% (wt/vol) NuSieve (FMC, Rockland, Maine) agarose, by using
* Corresponding author. Mailing address: Department of Bacteriol-ogy, Institute for Animal Science and Health, P.O. Box 65, 8200 AB Lelystad, The Netherlands. Phone: 31 320 238161. Fax: 31 320 238153. E-mail: [email protected].
1940
on May 15, 2020 by guest
http://jcm.asm.org/
0.5% (wt/vol) multipurpose agarose (Boehringer Mannheim) in 1⫻TAE (17) for 4 h at 80 V.
PFGE.Preparation of DNA-containing agarose blocks for PFGE was adapted
from the work of On et al. (14). Cells grown for 24 hours were resuspended in Pett IV buffer (1 M NaCl, 10 mM Tris [pH 8.0], 10 mM EDTA) at an optical density at 420 nm of 1.5 and heated to 50°C. Three hundred microliters was mixed with 700l of warm (50°C) 1% Resove Low (Biozym, Landgraaf, The Netherlands) agarose. The mixture was cast into molds (Bio-Rad, Richmond, Calif.) and solidified for 10 min at 4°C. Plugs were incubated in 3 ml of ESP lysis solution (0.5 M EDTA, 1.0%N-lauroyl sarcosine, 1 mg of proteinase K per ml) at 50°C for 48 h. The plugs were washed three times for 20 min each time in 2 ml of TE buffer (Tris-HCl 10 mM [pH 8.0], 1 mM EDTA) with 1.5 mM phe-nylmethylsulfonyl fluoride, followed by three washings of 20 min each with TE buffer. Subsequently, the plugs were equilibrated with 1⫻restriction buffer for 48 h at room temperature and DNA was finally cut for 4 h at 25°C in 250l of restriction buffer containing 20 U ofSmaI (Boehringer Mannheim).
Digested DNA plugs were loaded on a 1% SeaKem genetic technology grade agarose (FMC) gel and separated on a contour-clamped homogeneous electric field DR-III apparatus (Bio-Rad) in 0.5⫻TBE buffer (17) for 22 h at 14°C. Electrophoresis conditions were 6 V/cm, the included angle was 120 degrees, and ramp times were 5 to 10 s over 4 h, 10 to 40 s over 14 h, and 50 to 60 s over 4 h. After electrophoresis, gels were stained in a 1-mg/ml ethidium bromide solution and destained in electrophoresis buffer and bands were visualized under UV light.
Automated ribotyping.Automated ribotyping was performed on a RiboPrinter
(Qualicon, Wilmington, Del.) with the restriction enzymePstI, according to the instructions of the manufacturer. Shortly, the cell suspension was lysed and chromosomal DNA was isolated, digested withPstI, electrophoresed, and simul-taneously blotted in an automated manner. Subsequently, the Southern blot was hybridized with a chemiluminescently labeled 16 to 23S rRNA primer. Bands were detected and analyzed with RiboPrinter software.
AFLP fingerprinting.AFLP analysis was performed as previously described
(4). Shortly afterward, genomic DNAs were digested withHindIII andHhaI. Simultaneously, site-specific adapters were ligated to the restriction fragments. A preselective PCR amplification was followed by a selective PCR using a labeled
HindIII primer containing a selective nucleotide (A) and anHhaI primer con-taining a selective A nucleotide. Final products were analyzed on a 7.3% dena-turing sequence gel on an ABI 373 automated DNA sequencer.
Data analysis.Patterns obtained byflaAtyping and PFGE were photographed
using a digital camera (Minolta RD-175) and saved as TIFF files for use with GelCompar version 4.1 software (Applied Maths, Kortrijk, Belgium). Normal-ization was done according to molecular weight standards on each gel, with one
molecular weight standard being used for every four samples (flaAtyping) or for every six samples (PFGE). AFLP patterns were collected with Genescan soft-ware (PE Applied Biosystems), and densitometric curves were transferred to GelCompar version 4.1. AFLP gels were normalized according to internal size standards added to each lane. Ribotyping patterns as obtained from Qualicon software were exported as txt files, converted using Gelconvert 1.01 (Qualicon), and imported into GelCompar version 4.1 as int files. Normalization was done by the Qualicon software according to molecular weight standards on each gel (one molecular weight standard for every two samples).
Construction of similarity matrices was carried out with GelCompar version 4.1. For AFLP analysis the Pearson product-moment correlation coefficient was used, whereas forflaAtyping, PFGE, and ribotyping data the band-based Dice coefficient was used. In all cases the unweighted-pair group method using aver-age linkaver-ages (UPGMA) was used to cluster the patterns. Bands for analysis with the Dice coefficient were assigned manually, according to densitometric curves and the accompanying hard-copy photograph.
Species discrimination betweenC. jejuniandC. coli.For discrimination
be-tweenC. jejuniandC. coli, aCampylobacterspecies-discriminating multiplex PCR (23) was performed. Primers were based on the nucleotide sequences of species-specific probes selected fromC. jejuniandC. coliDNA fragment libraries (24).
RESULTS
Cutoff value.The experimental variation between duplicate experiments was determined for six replicate experiments us-ing sixCampylobacterstrains. ForflaAtyping these data were used to establish a cutoff value of 90% for typing identical strains with identical outputs. In a similar way, the cutoff values for PFGE and AFLP analysis were determined to be 90%. The reproducibility of ribotyping had been determined with Ribo-Printer software, and only one pattern from each strain was imported into GelCompar version 4.1. The cutoff value could therefore not be determined and was arbitrarily chosen to be 90%.
[image:2.612.53.551.83.330.2]flaAtyping.In this studyflaAtyping, using a cutoff of 90%, discriminated 31 different patterns out of 50 strains (Fig. 1). Bands could be reliably assigned down to 60 bp. The total number of bands ranged from 5 to 9 (Fig. 1).C. jejuniandC. TABLE 1. Campylobacter strains used in this study
Straina Speciesb Yr of isolation Farmc Straina Speciesb Yr of isolation Farmc
C144 C. jejuni 1990 B C2446 C. jejuni 1992
C350 C. jejuni 1990 A C2450 C. jejuni 1992
C356 C. jejuni 1990 A C2461 C. jejuni 1992
C591 C. jejuni 1990 A C2466 C. coli 1992
C626 C. coli 1990 B C2470 C. coli 1992
C690 C. jejuni 1990 B C2476 C. jejuni 1992
C2143 C. jejuni 1992 C2481 C. jejuni 1992
C2146 C. jejuni 1992 C2485 C. coli 1992 B
C2150 C. jejuni 1992 C2498 C. coli 1992
C2152 C. coli 1992 C2505 C. coli 1992
C2155 C. coli 1992 C2515 C. jejuni 1992
C2246 C. jejuni 1992 C2520 C. coli 1992
C2264 C. jejuni 1992 C2535 C. jejuni 1992
C2345 C. jejuni 1992 C2540 (G) C. coli 1992
C2355 C. coli 1992 C2545 C. coli 1992
C2360 C. jejuni 1992 C C2551 (Dk) C. coli 1992
C2362 C. jejuni 1992 C C2555 C. jejuni 1992
C2375 C. coli 1992 C2605 C. coli 1992
C2380 C. coli 1992 C2609 (B) C. jejuni 1992
C2385 C. coli 1992 C2641 C. jejuni 1992
C2390 C. coli 1992 C2651 C. jejuni 1993
C2400 (B) C. coli 1992 C4596 C. coli 1997 D
C2412 C. jejuni 1992 C4601 C. coli 1997 D
C2436 C. coli 1992 C4602 C. coli 1997 D
C2441 C. jejuni 1992 C4611 C. coli 1997 D
aAll strains were isolated in The Netherlands (9), except those indicated with (B), (G), or (Dk), which were isolated in Belgium, Germany, or Denmark, respectively (9).
bStrains were tested according to the multiplex PCR described by van de Giessen et al. (23). cStrains with the same letter are from the same farm.
VOL. 38, 2000 COMPUTER-ASSISTED GENOTYPING OFCAMPYLOBACTER 1941
on May 15, 2020 by guest
http://jcm.asm.org/
coliisolates are randomly distributed within the dendrogram, indicating thatflaAtyping does not discriminate these species. Moreover, someC. jejuni and C. coli isolates, namely, C690 and C2551 and C2385, C2446, and C2450, share the same flagellin type (Fig. 1 and Table 2).
PFGE analysis.Using a cutoff of 90%, PFGE analysis dis-criminated 38 different patterns (Fig. 2) and one isolate proved untypeable under the conditions used. The number of bands in PFGE patterns ranged from 4 to 12 (Fig. 2). As previously described (27), PFGE analysis allowed discrimination of C. jejuniandC. coli(Fig. 2).
PFGE data are usually analyzed according to the guidelines of Tenover et al. (22). However, these criteria could not be used for our strains since they cannot be applied to populations of strains collected over periods of more than 1 year or to patterns consisting of less than 10 distinct fragments.
Automated ribotyping.With the use ofPstI, an enzyme that does not cut within the 16S rRNA gene of Campylobacter, ribotyping produced three to six bands and discriminated 26 different types (Fig. 3) when a cutoff of 90% was used. As previously described (5, 19), ribotyping discriminatedC. jejuni
fromC. coli(Fig. 3).C. jejuniisolate C2246, however, clustered within a number ofC. coliisolates near the border between the
C. jejuni and C. coli isolates (Fig. 3), which indicates that species discrimination according to automated ribotyping is not completely reliable.
The number of types identified by analysis with GelCompar version 4.1 is somewhat lower than the number of ribotypes determined with the RiboPrinter software (31 ribotypes, data not shown), indicating that automated ribotyping can be best analyzed with a RiboPrinter. However, cluster analysis is not possible with the Riboprinter software.
AFLP typing.AFLP fingerprints consisted of 40 to 70 bands in the range of 50 to 500 bp (Fig. 4). Using a cutoff of 90% (4), we identified 41 distinct patterns. There was a clear distinction between AFLP fingerprints fromC. jejuniandC. colistrains,
indicating that AFLP analysis is capable of discriminating be-tween these species.
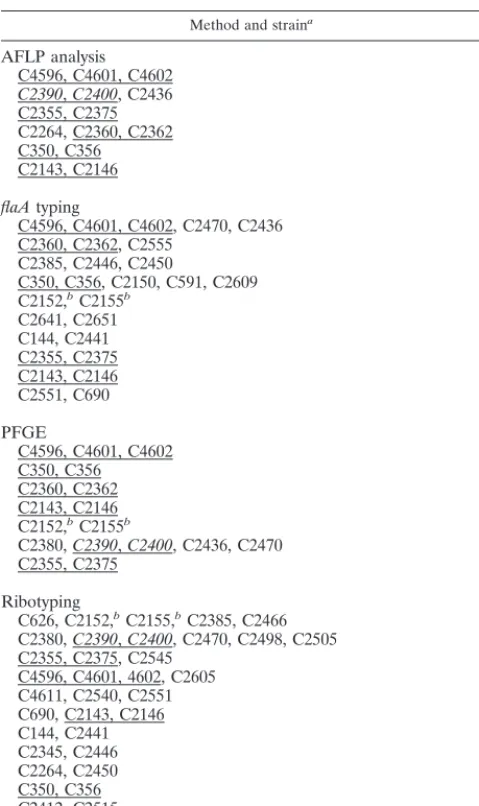
Comparison of the levels of discrimination obtained by the used methods. Comparison of the results of the four tech-niques identified several strains that are genetically related by all methods. These results are depicted in Table 2. Several strains with related genotypes were isolated from the same farm; examples are C350 and C356, C2360 and C2362, and C4596, C4601, and C4602 (Tables 1 and 2). However, strains isolated from different places, like C2143 and C2146 and C2355 and C2375 (Table 2) were also related. DifferentflaA
patterns but genetically related AFLP, PFGE, and ribotyping patterns were found for C2390 and C2400 (Table 2). In con-trast, identical flaApatterns but different AFLP, PFGE, and ribotyping patterns were found for isolates C591 versus C350, C356, C2150, and C2609 (Table 2).
DISCUSSION
In this study a set of 50Campylobacterisolates from poultry was typed by four genotyping techniques. The values of the routinely used genotyping techniquesflaAtyping, PFGE, and ribotyping and of the newly introduced AFLP analysis were compared for differentiation of strains and for computer-as-sisted analysis. All four genotyping techniques produce genetic fingerprints, although they differ in experimental approach and in levels of genetic discrimination.flaAtyping is based on only one locus, theflaAgene. Ribotyping is based on three rRNA gene clusters and their flanking regions as opposed to the one locus offlaAtyping. AFLP, only recently adjusted for typing
Campylobacterspecies (4, 10), is based on a subset of small fragments (50 to 500 bp) from the whole genome. In PFGE the complete genome is cut into a small number of large frag-ments. The obtained numbers of bands differed substantially between the different techniques. The calculation of levels of similarity between patterns was highly influenced by the num-FIG. 1. Dendrogram showing the assigned bands of the flagellin patterns. Levels of similarity were calculated with the Dice coefficient, and for cluster analysis the UPGMA was used. In GelCompar version 4.1 a position tolerance of 1.00% and an optimization of 0.50% were used. The species of the strains are indicated behind the strain number, with J indicatingC. jejuniand C indicatingC. coli.
on May 15, 2020 by guest
http://jcm.asm.org/
[image:3.612.106.504.73.312.2]ber of bands; the smaller the number of bands in a pattern, the larger the effect of one distinct band. AFLP analysis therefore appeared less subject to influences of individual band differ-ences than ribotyping.
A distinction can be made in the processing of genetic fin-gerprints. Band assignment is necessary for methods that are analyzed by a band-based analysis such as that of the Dice coefficient but not for methods that are analyzed by a correla-tion-based analysis such as that of the Pearson correlation coefficient. The band-based Dice coefficient method is based on the comparison of designated band positions and divides the number of matching bands between patterns by the total number of bands, thereby emphasizing the matching bands (3). The Pearson correlation coefficient method compares the whole densitometric curves of patterns and is independent of band definition (16). It is largely independent of relative
pat-tern intensities but is sensitive to differences in background. This makes the Pearson correlation coefficient method insen-sitive to peak-shoulder mismatches often found with band-matching coefficients. Differences in background intensities were observed withflaAtyping, PFGE, and ribotyping. These differences influenced the Pearson coefficient analysis, which could therefore not be used. Instead, the band-based Dice coefficient was used for the analysis offlaAtyping, PFGE, and ribotyping data. AFLP data were complex, band assignment was very laborious, and relatively minor differences in back-ground levels occurred. Therefore, the correlation-based Pear-son coefficient method was preferred.
Both analyses, band-based and correlation-based analyses, are largely influenced by the settings at which they are per-formed; different settings lead to different clusterings. The settings should therefore be carefully selected and should be kept constant within a comparison study.
Computer-assisted analysis, in theory, enables data transfer between different labs. Thus far the RiboPrinter method is the only method adapted for data exchange since it uses a stan-dardized method and stanstan-dardized materials. With GelCom-par version 4.1, data exchange of the other three techniques between labs is possible with the data-sharing module. How-ever, the methods will have to be standardized to enable valid comparisons between the exchanged data sets.
The discriminatory powers of the four techniques were ex-amined according to calculated similarities. AFLP fingerprint-ing was the most discriminatory technique, followed by PFGE,
flaAtyping, and ribotyping. Discriminatory power, however, is not the only criterion on which a technique should be judged for usefulness in epidemiological typing. Ease of use, availabil-ity and price of materials and consumables, and the amount of throughput are also important factors.flaAtyping is inexpen-sive, fairly quick, and the easiest method to perform in a laboratory. Drawbacks of this method are the risk of possible recombination events of the flagellin gene (8, 11, 25) and lack of species discrimination. Ribotyping has the advantage of being an automated, high-throughput process. However, the apparatus and consumables are expensive, it has only limited resolution, and due to the highly automated process, it is dif-ficult to interfere with the identification or settings. The Ribo-Printer is not capable of cluster analysis. Automated ribotyping can therefore be used only in situations in which a low reso-lution is satisfactory and cluster analysis is not necessary. PFGE is currently the most accepted method for typing campy-lobacters due to its high resolution (15, 19). However, it de-mands a specialized PFGE apparatus, is time-consuming and laborious, and is therefore unsuitable for typing large numbers of samples. In our study AFLP analysis was the most discrim-inatory technique; it was also capable of typing large numbers of samples, and it was best suited for computer-assisted anal-ysis due to the easy transfer of data from the automatic se-quencer to GelCompar version 4.1. Automated sequence equipment is desirable but not essential. Manual sequence equipment in conjunction with labeled isotopes is possible, but the easy transfer of data between the automated sequencer and GelCompar version 4.1 is lost. Furthermore, internal markers in every lane cannot be used and it is difficult to standardize the background intensities.
[image:4.612.55.295.101.504.2]Combining the results of all four methods provided addi-tional information about the studied strains. For example, clones consisting of isolates sharing identical patterns by all four methods and of common geographical origins could be discriminated (Tables 1 and 2). Other strains that were genet-ically similar by all methods did not share geographical rela-tionships (Tables 1 and 2), indicating possible dispersion of
TABLE 2. Schematic representation of the strains with more than 90% genetic homology as determined by analysis with GelCompar
version 4.1
Method and straina
AFLP analysis C4596, C4601, C4602
C2390,C2400, C2436 C2355, C2375 C2264, C2360, C2362 C350, C356
C2143, C2146
flaAtyping
C4596, C4601, C4602, C2470, C2436 C2360, C2362, C2555
C2385, C2446, C2450
C350, C356, C2150, C591, C2609 C2152,bC2155b
C2641, C2651 C144, C2441 C2355, C2375 C2143, C2146 C2551, C690 PFGE
C4596, C4601, C4602 C350, C356
C2360, C2362 C2143, C2146 C2152,bC2155b
C2380,C2390,C2400, C2436, C2470 C2355, C2375
Ribotyping
C626, C2152,bC2155,bC2385, C2466
C2380,C2390,C2400, C2470, C2498, C2505 C2355, C2375, C2545
C4596, C4601, 4602, C2605 C4611, C2540, C2551 C690, C2143, C2146 C144, C2441 C2345, C2446 C2264, C2450 C350, C356 C2412, C2515 C2360, C2362
aUnderlined strains are⬎90% similar by all methods, and italicized and underlined strains are⬎90% similar by all techniques exceptflaAtyping.
bStrains showing 87% homology by AFLP analysis due to background in the banding pattern of C2155 but showing more than 90% homology by all other methods.
VOL. 38, 2000 COMPUTER-ASSISTED GENOTYPING OFCAMPYLOBACTER 1943
on May 15, 2020 by guest
http://jcm.asm.org/
clones. Indications for flagellin-specific recombination (8, 11, 25) were also found in this set of 50 strains, e.g., C2390 and C2400 possess the same AFLP, PFGE, and ribotyping patterns but have differentflaApatterns (Fig. 1 and Table 2). In con-trast, C591 versus C2150, C350, and C356 show the sameflaA
pattern but have different AFLP, PFGE, and ribotyping pat-terns (Table 2).
[image:5.612.105.498.78.311.2]As observed previously (8, 11), flagellin patterns can be shared betweenC. jejuniandC. colistrains, e.g., betweenC. coliisolate C2385 and twoC. jejunistrains (C2446 and C2450) and betweenC. colistrain C2551 andC. jejunistrain C690 (Fig. 1). The most likely explanation is the lack of discriminatory power offlaAtyping because of the use of a single restriction enzyme. Genomic recombinations need to be considered when FIG. 2. Dendrogram of the PFGE patterns with designated bands. Cluster analysis was performed as described for Fig. 1. The clusters representingC. jejuniand
C. coliare indicated, and the species are indicated behind the strain number, with J indicatingC. jejuniand C indicatingC. coli. Isolate C2345, which was untypeable, is not shown.
FIG. 3. Dendrogram of ribotyping data with designated bands. Cluster analysis was performed as described for Fig. 1. The clusters representingC. jejuniandC. coliare indicated, and the species are indicated behind the strain number, with J indicatingC. jejuniand C indicatingC. coli.ⴱindicates aC. jejunistrain that is clustered among theC. colistrains.
on May 15, 2020 by guest
http://jcm.asm.org/
[image:5.612.122.484.464.698.2]genotyping techniques are applied toCampylobacter. Recently there have been reports indicating genomic recombination (7, 13, 26), but the effect of recombination on genotyping methods is not yet known. The possible influence of recombination, combined with the finding that multiple techniques result in better discrimination and identification of strains, supports the use of multiple genotyping techniques, including AFLP finger-printing, for optimal epidemiological typing ofCampylobacter.
ACKNOWLEDGMENTS
This work was partly funded by the Product Boards for livestock, meat, and eggs, Rijswijk, The Netherlands.
We thank Trudy Wassenaar for critically reading the manuscript.
REFERENCES
1.Ayling, R. D., M. J. Woodward, S. Evans, and D. G. Newell.1996. Restriction
fragment length polymorphism of polymerase chain reaction products ap-plied to the differentiation of poultry campylobacters for epidemiological investigations. Res. Vet. Sci.60:168–172.
2.Chang, N., and D. E. Taylor.1990. Use of pulsed-field agarose gel
electro-phoresis to size genomes ofCampylobacterspecies and to construct aSalI map ofCampylobacter jejuniUA580. J. Bacteriol.172:5211–5217.
3.Dice, L. R.1945. Measures of the amount of ecological association between
species. J. Ecol.26:297–302.
4.Duim, B., T. M. Wassenaar, A. Rigter, and J. Wagenaar.1999.
High-reso-lution genotyping ofCampylobacterstrains isolated from poultry and humans with amplified fragment length polymorphism fingerprinting. Appl. Environ. Microbiol.65:2369–2375.
5.Fitzgerald, C., R. J. Owen, and J. Stanley.1996. Comprehensive ribotyping
scheme for heat-stable serotypes ofCampylobacter jejuni. J. Clin. Microbiol.
34:265–269.
6.Gibson, J., E. Lorenz, and R. J. Owen.1997. Lineages withinCampylobacter
jejunidefined by numerical analysis of pulsed-field gel electrophoretic DNA profiles. J. Med. Microbiol.46:157–163.
7.Ha¨nninen, M. L., M. Hakkinen, and H. Rautelin.1999. Stability of related
human and chickenCampylobacter jejunigenotypes after passage through chick intestine studied by pulsed-field gel electrophoresis. Appl. Environ. Microbiol.65:2272–2275.
8.Harrington, C. S., F. M. Thomson-Carter, and P. E. Carter.1997. Evidence
for recombination in the flagellin locus ofCampylobacter jejuni: implications for the flagellin gene typing scheme. J. Clin. Microbiol.35:2386–2392.
9.Jacobs-Reitsma, W. F., N. M. Bolder, and R. W. Mulder.1994. Caecal
carriage ofCampylobacterandSalmonellain Dutch broiler flocks at slaugh-ter: a one-year study. Poult. Sci.73:1260–1266.
10. Kokotovic, B., and S. L. On.1999. High-resolution genomic fingerprinting of
Campylobacter jejuniandCampylobacter coliby analysis of amplified frag-ment length polymorphisms. FEMS Microbiol. Lett.173:77–84.
11. Meinersmann, R. J., L. O. Helsel, P. I. Fields, and K. L. Hiett.1997.
Discrimination of Campylobacter jejuni isolates by fla gene sequencing. J. Clin. Microbiol.35:2810–2814.
12. Nachamkin, I., K. Bohachick, and C. M. Patton.1993. Flagellin gene typing
ofCampylobacter jejuniby restriction fragment length polymorphism analy-sis. J. Clin. Microbiol.31:1531–1536.
13. On, S. L.1998. In vitro genotypic variation ofCampylobacter coli
docu-mented by pulsed-field gel electrophoretic DNA profiling: implications for epidemiological studies. FEMS Microbiol. Lett.165:341–346.
14. On, S. L., E. M. Nielsen, J. Engberg, and M. Madsen.1998. Validity of
SmaI-defined genotypes ofCampylobacter jejuniexamined bySalI,KpnI, and
BamHI polymorphisms: evidence of identical clones infecting humans, poul-try, and cattle. Epidemiol. Infect.120:231–237.
15. Owen, R. J., K. Sutherland, C. Fitzgerald, J. Gibson, P. Borman, and J.
Stanley.1995. Molecular subtyping scheme for serotypes HS1 and HS4 of
Campylobacter jejuni. J. Clin. Microbiol.33:872–877.
16. Pearson, K.1926. On the coefficient of racial likeliness. Biometrika18:105–
117.
17. Sambrook, J., E. Fritsch, and T. Maniatis.1989. Molecular cloning: a
lab-oratory manual, 2nd ed. Cold Spring Harbor Lablab-oratory, Cold Spring Har-bor, N.Y.
18. Skirrow, M. B., and M. J. Blaser.1992. Clinical and epidemiologic
consid-erations, p. 3–9.InI. Nachamkin, M. J. Blaser, and L. S. Tompkins (ed.),
Campylobacter jejuni: current status and future trends. American Society for Microbiology, Washington, D.C.
19. Stanley, J., D. Linton, K. Sutherland, C. Jones, and R. J. Owen.1995.
High-resolution genotyping ofCampylobacter coliidentifies clones of epide-miologic and evolutionary significance. J. Infect. Dis.172:1130–1134.
20. Stern, N. J.1992. Reservoirs forCampylobacter jejuniand approaches for
intervention in poultry, p. 49–60.InI. Nachamkin, M. J. Blaser, and L. S. Tompkins (ed.), Campylobacter jejuni: current status and future trends. American Society for Microbiology, Washington, D.C.
21. Tauxe, R. V.1992. Epidemiology ofCampylobacter jejuniinfections in the
United States and other industrialized nations, p. 9–19.InI. Nachamkin, M. J. Blaser, and L. S. Tompkins (ed.),Campylobacter jejuni: current status and future trends. American Society for Microbiology, Washington, D.C.
22. Tenover, F. C., R. D. Arbeit, R. V. Goering, P. A. Mickelsen, B. E. Murray,
D. H. Persing, and B. Swaminathan.1995. Interpreting chromosomal DNA
restriction patterns produced by pulsed-field gel electrophoresis: criteria for FIG. 4. Dendrogram of AFLP patterns. Cluster analysis was performed with GelCompar version 4.1 by using the UPGMA and the Pearson product-moment correlation coefficient. The clusters representingC. jejuniandC. coliare indicated, and the species are indicated behind the strain number, with J indicatingC. jejuni
and C indicatingC. coli.
VOL. 38, 2000 COMPUTER-ASSISTED GENOTYPING OFCAMPYLOBACTER 1945
on May 15, 2020 by guest
http://jcm.asm.org/
bacterial strain typing. J. Clin. Microbiol.33:2233–2239.
23. van de Giessen, A. W., J. J. Tilburg, W. S. Ritmeester, and J. van der Plas.
1998. Reduction ofCampylobacterinfections in broiler flocks by application of hygiene measures. Epidemiol. Infect.121:57–66.
24. van der Plas, J., H. Hofstra, J. H. J. Huis in’t Veld, et al.1993. DNA probe
assays for detection, identification and typing ofCampylobacterspecies and
Helicobacter pylori. Microb. Ecol. Health Dis.4:S60.
25. Wassenaar, T. M., B. N. Fry, and B. A. M. van der Zeijst.1995. Variation of
the flagellin gene locus ofCampylobacter jejuniby recombination and hori-zontal gene transfer. Microbiology141:95–101.
26. Wassenaar, T. M., B. Geilhausen, and D. G. Newell.1998. Evidence of
genomic instability inCampylobacter jejuniisolated from poultry. Appl. En-viron. Microbiol.64:1816–1821.
27. Yan, W., N. Chang, and D. E. Taylor.1991. Pulsed-field gel electrophoresis
ofCampylobacter jejuniandCampylobacter coligenomic DNA and its epi-demiologic application. J. Infect. Dis.163:1068–1072.