2016 International Conference on Electronic Information Technology and Intellectualization (ICEITI 2016) ISBN: 978-1-60595-364-9
Robust Statistics Analysis and Difference
Significance Test of the Test Data of
Laboratory Proficiency Testing
Yong Gao, Qingmei Wang and Ning Zhang
ABSTRACT
Statistical analysis of the results in laboratory proficiency testing occupies an important position in the verification activities, this article reviewed the most widely used method in laboratory proficiency testing called robust statistical Z-Score, and a statistical analysis of the results was done with the application of SPSS software, F test was applied to the results which were divided into different groups according to the different test methods each laboratory used. It is helpful to determine whether each test method has significant effects on the results of laboratory testing and a further analysis.
INTRODUCTION
As for the definition of proficiency testing, the GB/T 15483.1-1999 "Proficiency testing by inter laboratory comparisons Part1: Development and operation of proficiency testing schemes" stipulates, Proficiency testing refers to the ability to identify the specific detection and calibration of the laboratory by using laboratory comparison [1]. In 2006, the 9th announcement of the national certification and accreditation supervision and management committee points out that laboratory capability verification is to determine the technical capabilities of a laboratory which engaged in the specific test activities by using the comparison of the specified testing data.
______________________
Through proficiency testing, participants can find the insufficiency in their inspection work, and take effective measures promptly to improve the measurement precision of the results, at the same time, proficiency testing is also a kind of technical means which can ensure laboratories to provide effective and reliable laboratory test results continuously, to promote the competitiveness of the industry, and it’s an assessment technology to the laboratory accreditation or site assessment.
The method of robust statistical Z-Score is frequently applied in the process of data processing in laboratory proficiency testing, through which the effect of outliers in data on the statistical results can be reduced [2]. The method of split-level test sample is widely used in laboratory proficiency testing at present, to calculate the value of Z score between laboratory and Z score in laboratory combining the robust statistical techniques can roughly judge the deviation problems existing in the laboratory, which will provide direction for their reasons analysis and remedial measures [3].
There’s no relative criterion about which test method to choose for participants in the implement processes of proficiency testing project, laboratory test methods can be national standards or industry standards of testing methods, it can also be a non-standard methods but used informally by a laboratory, under which circumstances, it is necessary for the laboratory to provide detailed operation procedures about the method they adopted. Thus, there might exist certain differences between the results obtained by using different measure means, the differences may be caused by controllable factors namely different method itself, it may also be caused by some uncontrolled factors such as random error, this article introduced data difference significance test into the process of data processing in proficiency testing, A difference significant test analysis was done to the measurement results obtained by different means to determine whether each test method has a significant impact on proficiency testing results.
THE ROBUST STATISTICS OF TEST RESULTS
The robust statistics obtained contains President Measurement, Median, Inter quartile range(IQR), Standard inter quartile range(Norm IQR), Robust Coefficient of variation(Robust CV), Maximum, Minimum, and Range [4, 5] while using robust statistical techniques to conduct an analysis to the testing data.
At present, the common methods of domestic and foreign are offsetD, percent
Z x X s
[image:3.612.96.502.150.197.2] (1)
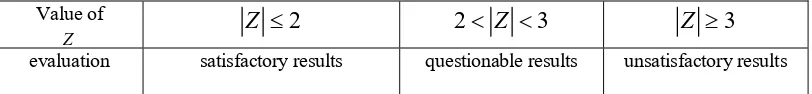
TABLE I. Z SCORE AND RESULT EVALUATION. Value of
Z Z 2 2 Z 3 Z 3
evaluation satisfactory results questionable results unsatisfactory results
X represents the median of the data measured in the laboratory, while s represents the standard inter quartile range of measurement data.
Regard the value of Z size as the basis of determining whether laboratory testing results are satisfactory or not, the determination of specific results are in the TABLEI.
Robust statistical method, the commonly used method in measuring institutions around the world in proficiency testing or international comparison, perform betters, in particular, when there exists differences between the actual data and the hypothetical data model, the distribution of measurement data is non-normal or existing outliers.
DATA DIFFERENCE SIGNIFICANCE TEST
In practice, there may appear two or more different test results when the test data is handled. For the purpose of conducting a comparative analysis, an analysis contains significant test of difference in statistics need to be done.
At present, the most commonly used difference significance test method contains Z test, t test, F test and chi-square etc. [7]. Statistically, the probability distribution of the most continuous random variables is normal distribution which our daily measurement result basically all obeyed. Proficiency testing analysis is based on the basis of test results is normal distribution [8]. In the statistical analysis of proficiency testing data, t test can be carried out on the samples while the samples can be divided into two groups in order to verify whether there is a significant difference between two samples data, furthermore, if the samples are grouped in two groups above, the F test can be carried out. Accordingly, the test results of the example in this paper can be divided into four groups according to the different test methods, thus, the F test can be adopted to the sample data.
T Test Method
calculation in the probability is less than P = 0.05, there exists significant difference between two groups of sample data, otherwise, that no significant difference between two groups of sample data, the computation formula of t is as formula (2).
1 2
1 2
X X
X X
t
S
(2)
1
X and X2 represents arithmetic mean of two samples respectively, SX1X2
represents two sample standard deviations of the mean difference. The calculation
method ofSX1X2 can divide into two different situations depend on whether the sample capacity is the same, computation formula can be as formula (3) when the sample capacity is the same:
1 2 1 2
2 2
X X
X X
S S
S
n
(3)
When the sample capacity is n1 and n2 respectively, the computation formula is as formula (4).
1 2 1 2
2 2
1 2
X X
X X
S S
S
n n
(4)
F Test Method
Before treating the test data by means of analysis of variance, we need to consider three assumptions of the observation data, namely whether the data meet normal distribution as a whole, whether the data is homogeneous or whether they have the trait of mutual independence [9]. F test and T test require the situation that the sample data based on the data obtained is generally subject to normal distribution, if the data is not in conformity with the normal population distribution, we can only use the method of non-parametric test.
Homogeneity means that the variance of each observation variable in the analysis of variance should have identity, namely whether the measurement population is suitable for comparative analysis between the overall observations [10]. Mutual independence in analysis of variance said that the value of the individual in the sample are independent of each other, that is, the value of the individual there should be no relevance in the two observation, otherwise, there would be likely appears results outputted which cannot be resolved.
deviation caused by control variables which is specific as different test method,
SSE is the deviation caused by random variables like sampling error in the third
part of this paper. The computation formula of SST is shown in formula (5).
SST SSASSE (5) The computation formula of SSA is as formula (6).
2
1
( )
k
i i
i
SSA n x x
(6)
K is the number of level which is the number of test methods used in this paper, ni is the sample capacity in the i level. It is obvious that dispersion square sum
between groups is the sum of the squares of mean and overall average deviation of the other groups.
The computation formula of SSA is as formula (7).
2
1 1
( )
i
n k
ij i
i j
SSE x x
(7)xij represents the data under i level, which is specified as the result data of laboratory j used the method of i, SSE is the sum of squares of each test result and it’s average deviation.
The computation formula of statistics F is as formula (8).
/ ( 1)
/ ( )
SSA k
F
SSE n k
(8)
Comparing the value of F-statistics calculated according to the experimental data
toF0.05,k1,n k achieved by the means of table look-up, it means that there exists
significant difference between each group of data if theF F0.05,k1,n k .
EXAMPLE ANALYSIS
This paper takes the test data of Cu in the result of elements of Cu、Pb、Zn、 Mo and V in sandy soil samples in the proficiency testing program organized by CNAL for example, national geological experimental testing center is responsible for
the implementation of this project [11]. Data differences significant analysis and robust statistical analysis are done to the results obtained through different test method.
examination of homogeneity and stability of the samples shows that the samples are qualified for the specified analysis. The number of the laboratory participated in the program is 45 with 44 laboratories in which give out the test results in the prescribed time. Those laboratories mainly come from the laboratory of geology and mineral resources (38 laboratories), nonferrous metals (3), nuclear industries (2) and chemical (1) etc. Eight laboratories in 44 laboratories have received the recognition fromCNAL , which accounting for 18.2% of the total number of laboratories
involved.
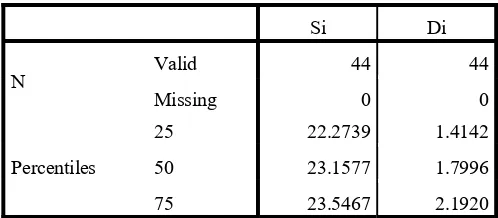
Using statistical software SPSS to analyze the results of robust statistics. The sum of standardization of S and the deviation of standardization D of each laboratory’s sample A and sample B are calculated and the quartile of S and D are as Table II.
What we can see from the table II is that the upper quartile, median and lower quartile of S is 22.2739, 23.1577 and 23.5467 respectively, upper quartile, median
and lower quartile of D is 1.4142, 1.7996 and 2.1920 respectively.
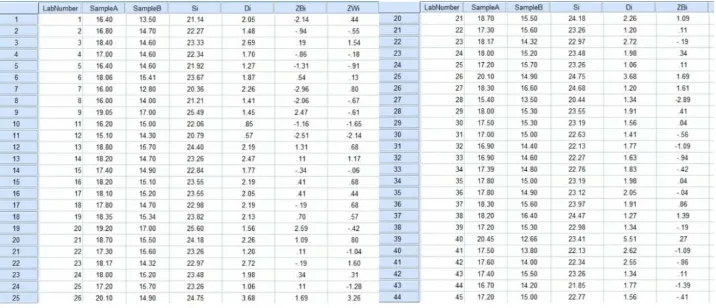
Editing formula (1) to calculate the value of ZB and ZW of each laboratory in the area used for calculating variable inSPSS, which reflects the laboratory's system
error and random error of the measurement results respectively. As for the project adopts the split level sample design, as long as one of the values of a laboratory is not satisfied, we can regard the test result corresponding as an unsatisfactory result.
The measurement results of each laboratory and value of ZB and ZW obtained inSPSSare as Figure 1.
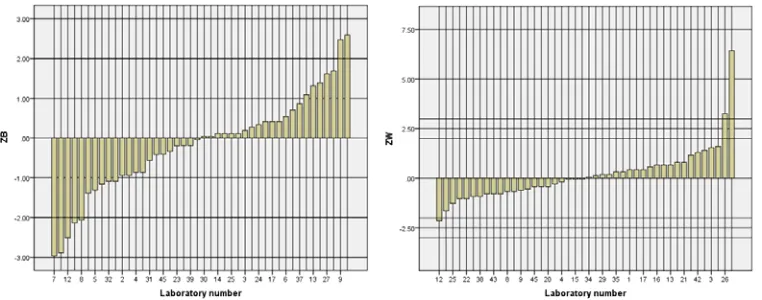
In order to better express the measurement ability of each laboratory participated in the proficiency testing project, this article shows the ability of each lab conditions respectively by drawing out histogram according to the value of Z score between laboratory and Z score in the laboratory, the results are as figure2 and figure3.
[image:6.612.172.421.546.655.2]It is turned out that, for the sandy soil composition detection capability proficiency testing plan, in the measurement results of cu component, the total number is 44, the number of satisfactory value of ZB is 38 which accounting for 86.4% of the total number of results, the number of results including problems is 6,
TABLE II. CALCULATION OF QUARTILES OF S AND D.
Si Di
N Valid 44 44
Missing 0 0
Percentiles
25 22.2739 1.4142
50 23.1577 1.7996
Figure 1. Test data of the proficiency testing.
accounting for 13.6% of the total number of results, the number of results which is not satisfied is 0, the laboratories whose result contains questions are 1, 7, 9, 12, 28. The number of satisfactory value of ZW is 41 which accounting for 93.2% of the total number of results, the number of results including problems is 1, accounting for 2.3% of the total number of results, the number of results which is not satisfied is 2, it accounts for 4.5% of the total number of results, the laboratory whose result contains questions is 12, and the unsatisfactory results come from laboratory 26 and 40.
In this proficiency testing project, there are four test methods are used, they are acid melting ICP-AES, acid melting ICP-MS, acid melting AAS and tableting XRF respectively, The laboratory chosen each test methods are: acid melting ICP-AES: 1,3,7,9,13,14,15,16,17,19,26, 33, 34,37,40,45, acid melting ICP-MS: 2,4,20,43, acid melting AAS:5,6,8,11,21,22,23,24,25,27,36,38,41,42,44, tableting XRF: 12,18,30,39. We do a data difference significance test analysis with each group of data to determine where there exists a significant difference between different test results.
A normal distribution of our data is shown using the normality test through the method of single sample Kolmogorov-Smirnov in SPSS. The results are as table III.
It can be seen that significance level P = 0.816 > 0.05, which indicates that data obey the normal distribution. The table IV is the result of data homogeneity test.
The value of significance level P = 0.835 > 0.05 shows that the data meet the homogeneity of variance, furthermore, an analysis of variance can be done.
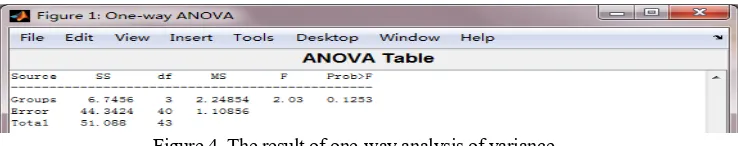
The figure 4 reveals the result of one-way analysis of variance to each group of data by programming inMATLAB.
differences, namely, there does not exist significant differences between results achieved by different means of measurement.
Figure 2. Histogram of ZB sequence. Figure 3. Histogram of ZW sequence.
CONCLUSIONS
[image:8.612.106.487.126.276.2]Laboratory proficiency testing is a kind of technical means that can ensure laboratories to provide effective and reliable laboratory test results continuously, laboratory certificate institution can get to know the laboratory testing level of a certain industry by organizing and implementing proficiency testing activities regularly, at the same time, participants can find the insufficiency in their inspection work and take effective measures promptly to improve the measurement precision of the results measures, it also favors the enhancement of self-confidence and the
TABLE III. ONE-SAMPLE KOLMOGOROV-SMIRMOV TEST.
results
N 44
Normal Parametersa,b Mean 17.6016
Std. Deviation 1.09000
Most Extreme Differences
Absolute .096
Positive .096
Negative -.061
Kolmogorov-Smirnov Z .634
TABLE IV. TEST OF HOMOGENEITY OF VARIANCES.
Levene Statistic df1 df2 Sig.
.287 3 40 .835
industrial competitiveness of a laboratory. The statistical analysis of test results occupies an important position in the process of laboratory proficiency testing plan, this paper used the traditional method of robust statistical Z-Score to analyze the experimental data firstly, and the laboratories have been found out whose test results being satisfactory, questionable or not satisfactory, further, one-way analysis of variance have been done to the test data obtained by different test methods to determine whether there exists a significant difference between different test results, so that a new direction of further analysis for the result data of proficiency testing is formed, which makes senseto a certain degree.
Figure 4. The result of one-way analysis of variance.
REFERENCES
1. CNACL. 1999. GB/T15483.1—1999 Proficiency testing by interlaboratory comparisons Part1: Development and operation of proficiency testing schemes. Standards Press of China. 5-6. 2. Yuepeng Feng. 2007. “Robust statistical techniques and its application on proficiency testing
inter-laboratory comparisons,” Chemical Analysis and Meterage, 2007(02): 55-57.
3. Li Yu. 2014. “The advantages and limitations of the application of robust statistical techniques in laboratory comparison,” presented at National construction and building materials testing laboratory Sustainable Development Summit Forum, April 25, 2014.
4. Huber P.J., Wiley. 2012. “Robust Statistics in BD FACSDiva ™ Software Tech Note,” BD Biosciences.
5. Rousseeuw P.J., Hubert M. 2011. “Robust statistics for outlier detection,” Wiley Interdisciplinary Reviews: Data Mining and Knowledge Discovery, 1(1): 73-79.
6. Xintong Liu, ZunYing Zhou. 2014. Statistical techniques for laboratory quality management. Standards Press of China. 338-341.
7. Zhujing Hu. 2010. “The principle and m of estimating the statistical power and effect size when make Z test,” Psychological Exploration, 2010(01): 68-73..
8. Wei Yong-lin, Ren Yi, Huang Jun. 2008. “Laboratory proficiency testing and robust statistical techniques,” Yunnan Metallurgy, 2008(05): 77-85.
9. Backhaus K., Erichson B. Plinke W., Xuyi Wang, Polf Weiber. 2009. Multivariate statistical analysis. Shanghai People’s Publishing House. 110-115.
10. González-Rodríguez G., Colubi A, Gil M Á. 2012. “Fuzzy data treated as functional data: A one-way ANOVA test approach,” Computational Statistics & Data Analysis, 2012(56).
[image:9.612.119.488.298.371.2]