An Effective Framework for Enhancing Student
Engagement and Performance in Final Year Projects
Usman Naeem
School of Electronic Engineering & Computer Science Queen Mary University of London
London, UK [email protected]
Syed Islam
Department of Computer Science University College London
London, UK [email protected]
Arish Siddiqui
School of Architecture Computing & Engineering University of East London
London, UK [email protected]
Abstract—Over the years, there have been many factors that have influenced the landscape of higher education within the UK. These factors include the rise in tuition fees, the introduction of the Teaching Excellence Framework (TEF) and the formation of Office for Students. Although student performance plays a vital part, another significantly influential key performance indicator that impacts these factors is student experience, which is influenced by positive or negative feedback and engagement. Despite student engagement forming a key part of the learning environment, it is still perceived as one of the weakest aspects when it comes to enhancing the student experience.
In this paper, we present the implementation of an innova-tive, holistic teaching & learning framework for the final year project module trialed within the Department of Engineering and Computing at the University of East London. This project module had been running in different forms since the inception of the undergraduate programmes within the department, however it generally yielded poor and inconsistent evaluation, student experience and engagement. The framework was introduced during the academic year 2015/16, where its evaluation has shown a positive impact on student engagement, performance and experience, compared to the previous year.
Index Terms—Pedagogical issues, Teaching/learning strategies
I. INTRODUCTION
In todays academic climate, being able to effectively engage students is seen as a challenge, where the consequences of not being able to engage students sufficiently can have a negative impact on student experience. This is of key interest to higher education institutions, as they actively move away from traditional methods and are trying different ways to engage and motivate students [10]. With any of the new methods, the challenge lies in constructing educational experiences that do more to trigger the interest of students. One way of achieving this is to increase enjoyment and motivation levels within the students learning activities and milestones [18], [22].
Active learning methods are considered more effective than traditional methods for engaging students as these methods promote positive learning experiences and improve motivation through marked achievements [6]. One way to engage students is to facilitate a learning paradigm that promotes interaction and collaboration between students and academics. This in turn cultivates a sense of belonging and co-operation within the student, which can have a positive impact on student engagement [22]. The work in this paper builds on this
concept, as we present the implementation of an innovative, holistic teaching & learning framework for final year projects which incorporate unstructured learning by nature. Although, we implement the framework in a Computer Science related field, the framework can be generalized to other subject areas. The core objective of the developed framework is to enhance the student experience and increase engagement. To ensure that the framework is based on a theoretical foundation, an extensive literature review of areas that informed unstructured learning, independent research, student engagement & motiva-tion and development of specialist and transferable skills that reflect the full potential of both the student and their achieve-ments is considered. The focus of student engagement revolves around student experience and the learning environment. One major problem that educators face in enhancing the student learning is the recognition of the individuality of the student in the mass education system that is often difficult to measure. Our framework for the final year project provides the ideal platform to measure the student engagement as it encompasses both learning environment and individual learning.
In this paper, we introduce a holistic framework that con-siders overall curriculum contents, progression, coherence, benchmarking and epistemology. The methodology for the development of the framework is based on Technical Action Research [3], with the initial reflection stages constituting Brookfields critical lenses [1] and Pickerings Taxonomy [17] to undertake self-reflection, consult students, consult col-leagues/supervisors and identify prevailing practice at other UK Institutions. We also made use of the Technology Accep-tance Model [9], [11], [12] to validate the introduction and use of technology within our framework.
The remainder of this paper is organized as follows, Sec-tion II provides an overview of the related work, SecSec-tion III describes the development methodology, while Section IV de-scribes the proposed framework. Section V presents empirical validation and threats to validity. Finally, Section VI draws conclusion and identifies future work.
II. RELATEDWORK
broad agreement that student engagement is a multidimen-sional construct that consists of three dimensions; behavioral, cognitive and emotional [5]. Student engagement seems to have evolved with the changes in the teaching & learning environments oscillating from schools to universities and universities to continents [25]. Student engagement can be seen as the interaction between the time, effort and relevant resources spent by both, the students and their institutions, with an intention to optimize the student experience, enhance the learning outcomes, performance, development of student and the reputation of the institution [25]. Measuring and responding to the different dimensions of student engagement is a challenge, as there is a wide variety of issues to consider. For example, attendance, task completion and participation rates are examples of behavioral engagement that are necessary to achieve academic success. While learning experiences, such as students being enthusiastic or bored are just a few examples of emotional engagement [5].
Motivation plays an important role in enhancing student performance and experience. Motivation and engagement have been regarded as the students energy and drive to learn, engage and work effectively towards achieving their potential in their course of study [14]. In addition to various other factors such as learning, focus, persistence, planning and monitoring, students tend to engage more efficiently in each task when they are given the right guidance at the right time.
A Final Year Project (FYP) is a crucial element of a degree programme, as it requires students to pursue a self-learning path that enables them to enhance their problem-solving and research skills, facilitated by close supervision. For this to be effective, student engagement and feedback is vital, as this has a direct impact on the motivation levels of the student, which is crucial when conducting a year-long individual project.
FYPs are generally about getting more involved individually and blending oneself into a learning environment, as a result it reinforces personal and professional competencies of the student [16]. FYP can be challenging for students as this is often the first major individual task that they face that requires integration of skills and attributes gained during their entire programme of study. If the students can establish the relevance of their acquired skills to the chosen project, it can lead to improved learning experience. Students are also more likely to engage in learning when they are supported by the teaching staff who engage with the students, their subject and their learning process [2]. FYPs fall into the category of unstructured learning as it is neither premeditated nor based on the sequential delivery or guided by the textbooks. It is work of independent research blended with the skills and interest of the students. Hence, most of the learning is based around independent research, collaborations, feedback and blended learning [23].
Previous work to enhance student experience by making it more engaging [16] and interactive [12] has been focused on adopting technology within the learning environment. While doing so it is particularly important to assess the acceptance of the technology, especially to understand the perceived
usefulness and the perceived ease from the potential users point of view as described by the Technology Acceptance Model (TAM) [4]. Studies on perception along with behavioral intentions of using the system and has successfully been trialed in various teaching & learning environments includ-ing the FYP [12]. Examples include Moodle questionnaires to measure student engagement [11], and, an implemented system for evaluating project and monitoring progress [9]. Although these approaches provide similar Virtual Learning Environments that are considered informative, they often lack interaction, intervention and collaboration, due to limitations in functionality, that are necessary for managing and guiding the project to improve motivation and engagement [14].
Use of technology in teaching has become a necessity rather than a requirement, as it is not just about delivering content. The use of technology is about engagement, interaction, feed-back and thereby enhancing the overall learning experience [19]. This forms the basis for implementing technology in the FYPs, as they require timely interaction, feedback and a response mechanism between the student and the academic. This can be time consuming for both the parties and prone to errors and miscommunications. Integrating a technology-based system provides the platform to minimize the gap between the supervisor and the student and thereby enhances the student experience.
Our proposed framework takes into account all these various factors and learnings. For example, our framework enables constant support for FYP students from their supervisors and feedback in a constructive and timely manner. We make extensive use of technology to make the learning process more engaging and motivating. In order to implement the appropri-ate technology we not only adopted TAM [4] for evaluation but designed and delivered necessary training programs to equip the students with the required skills so that they have concrete influence on the acceptance and continual use of the implemented technology to ensure the effectiveness [27].
III. DEVELOPMENTMETHODOLOGY
The higher education landscape has changed over the last decade, where government policies have put a strong empha-sis on degree programmes offering students more value [7] regarding aspects such as student experience, engagement, retention and employment prospects. This has been reinforced by the fact that these aspects are being used as metrics to make a judgement on institutional teaching quality through the Teaching Excellence Framework (TEF) [13]. Hence, the role of the final year project has taken on further significance as it is an extensive part of the curriculum that gives students an opportunity to add value to their programme of study.
TABLE I INITIALREFLECTION Pickering Questions
What areas do students struggle with?
What areas are being taught particularly well or badly? What areas do students seem to particularly like or dislike? How well do students perform in these areas?
Brookfields Lenses Self-reflection Student input
Information from colleagues
Theory and practice informing the problem domain.
A. Initial Reflection
For this stage, we used Pickering [17] questions supple-mented by Brookfields lenses [1] to reflect on the issues with the current FYP module to develop a framework that would be able to enhance student engagement and performance. The Pickering questions are a modern take on how to incorporate technology into the curriculum, while Brookfields lenses are a widely adopted and well-established framework to identify the various aspects of a problem. Table I highlights the questions and lenses used for the initial reflection phase. Below is the summary of findings from our study which is similar to previously conducted research [8]:
• There was no mechanism for measuring progress.
• It was difficult to measure levels of engagement.
• Lack of instructional scaffolding throughout the year to
aid the learning process.
• Students found it difficult to manage a year long extensive
piece of assessment (project).
• Lack of feedback during the course of the project.
• Failure to attain constructive alignment, as students were ill-prepared for tasks.
• Need to prepare and assist in managing expectations of students, which can also help improve retention.
B. Planning
The planning stage involved giving due consideration to changing: the module specification & assessment structure, module study guide, validation process, impact on staff and logistics. The purpose of these changes was to improve the quality of teaching & learning during the project module, which in turn would lead to much improved FYPs. Effective pedagogy requires learning to be systematically developed [24], which leads to instructional scaffolding [20]. In order to do this, a series of workshops were organized during both semesters that provided support to students to help them achieve the learning objectives of the project module. Use of Assessment for learning (A4L) [24] ensured that the assessment was congruent with learning. This was an intrinsic consideration during the planning phase, resulting in the proposed framework having a series of formative and summative assessments.
C. Action
The action stage implemented the changes adhering to the institutional change management process, changes to teaching
& learning support, establishing transitional arrangements and holding supervisory and student training workshops. This also included the introduction of individual project sites, that allowed students to manage and showcase their projects in an independent and professional manner.
D. Observation
During the observation phase quantitative and qualitative data was collected to assess the impact of the framework.
IV. FRAMEWORK
The objective of the developed framework is to increase and enhance student engagement during a year-long (8 months to be precise) project that BSc final year Computer Science and Informatics students are expected to carry out as a require-ment for their degree. Student engagerequire-ment is enhanced by incorporating mechanisms for measuring progress and proving feedback checkpoints throughout the lifespan of the project. The proposed framework includes the following:
• Progress tracking through a series of formative and sum-mative assessments.
• Engagement checkpoints with a minimum of 12 supervi-sor meetings during the project.
• Integration of technology (e.g. student project sites) that allows students to develop their project management skills.
FYP provides the students with an opportunity to work on an extensive problem in the area of computing. The project allows the students to apply their range of skills that they acquired over the course of their degree programmes. Hence, the projects involve elements such as software/application development, mathematical modelling, empirical investigation and scientific or engineering methodology. We want to em-phasize that although the initial motivation of the framework was to produce positive results in this particular context, the framework can be easily generalized to other disciplines.
Core considerations of the framework is overall curriculum, progression, coherence, benchmarking and epistemology. In particular, we looked at the parts of the project tasks that stu-dents generally struggled with (e.g. writing literature reviews and project planning). The framework also takes into consid-eration programme & institutional context and benchmarking to the BCS and QAA standards. The proposed teaching & learning framework ensures constructive alignment at both the module and programme-level using Experimental Learning Theory [15] and ensuring assessment that was congruent to the learning goals resulting in the development of knowledge, thinking skills and subject-based practical skills. The right balance of instructional scaffolding [21] is incorporated for students via Assessment for Learning techniques which uses a series of diagnostic, information, continuous formative and summative assessments as tools and key milestones throughout the life cycle of the project.
Formal Lectures and Skills Workshops
Flexible Supervisory Support and Unstructured Independent Learning Weeks
1 36
1 2 3 4 5 6 7
1 - Supervisor Selection and Allocation
2 - Personal Project Site Allocation
3 - Initial Proposal
4 - Project Progress Presentation
5 - Interim Report
6 - Demonstration, Viva and Poster
7- Final Report
F - Feedback
F F F F F
[image:4.612.79.534.49.199.2]Supervisor Engagement Milestone
Fig. 1. Framework Overview for implementation in Computing and Informatics subject area at the University of East London.
contrast, the new framework (Figure 1) has a series of sum-mative (yellow) and forsum-mative assessments (green) as project milestones, which encourage students to work on their projects throughout the year as opposed to starting the project report in the final weeks of the academic year. These milestones ensure that students are covering all the elements that are expected from a good project and provide a mechanism for continuous feedback (orange). The framework is holistic and provides appropriate scaffolding support for individual students. The formal and structured sessions alongside diagnostic phases and flexibility built within the framework results in being able to cater to students with wide ranging capabilities. The level of support (from the supervisors and support staff) could be adjusted to meet exact needs of each student, whether that is in terms of research skills, thinking skills, problem-solving skills, time management skills or subject specific practical skills.
A. Supervisor Selection and Allocation
To initiate the project process, students are given a two-week period to select a supervisor, who remain with the student for the duration of the project. The purpose of supervision is to provide students with academic expertise based on their undertaken project. The supervisor is more akin to a mentor and provides guidance throughout the various steps of the student project.
B. Supervisor Engagement - Feedback Milestones
Conducting a year-long extensive piece assessment can be a daunting task for students. Hence the framework incorporates a mechanism that encourages supervisors and students to have a minimum of 12 engagement meetings that are treated as feedback milestones. These sessions not only allow super-visors to measure the students progress, but also facilitates instructional scaffolding according to the students abilities. These engagement points are also critical in managing student expectations, which in turn can help engage the student with the project and improve retention.
C. Project Proposal
Once supervision allocation is finalized, students are then expected to finalize their initial proposals. This describes the aims of their project and the rationale for their choice and the resources and skills that the project may require.
D. Individual Student Project Site
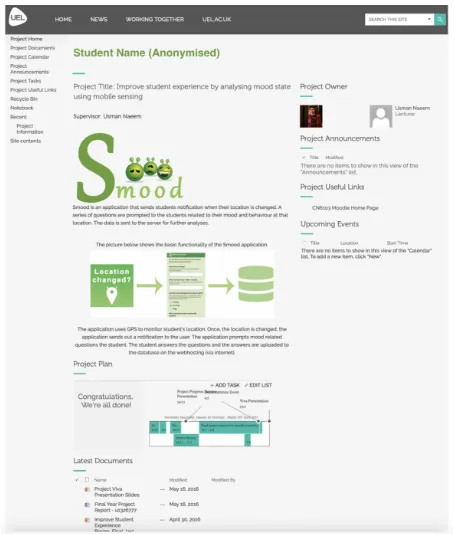
One major aspect employed as part of this new learning and teaching framework is the use of personal SharePoint project sites for each student, motivated by the benefits of using technology to support and enhance learning. The individual sites are used for many aspects such as: having a work space for the individual projects, sharing documents and drafts with supervisors, real-time collaboration, submission of project documents, project management, an integrated notebook for logs and finally showcasing the project work and outcomes publicly. The technology not only supports continuous forma-tive assessment, summaforma-tive assessment but also helps students to develop a technical skill that is highly revered by employers. In addition, the project site provides a comprehensive planning tool that allows students to enhance their project management skills. Figure 2 shows the annonymized homepage of an actual student project site.
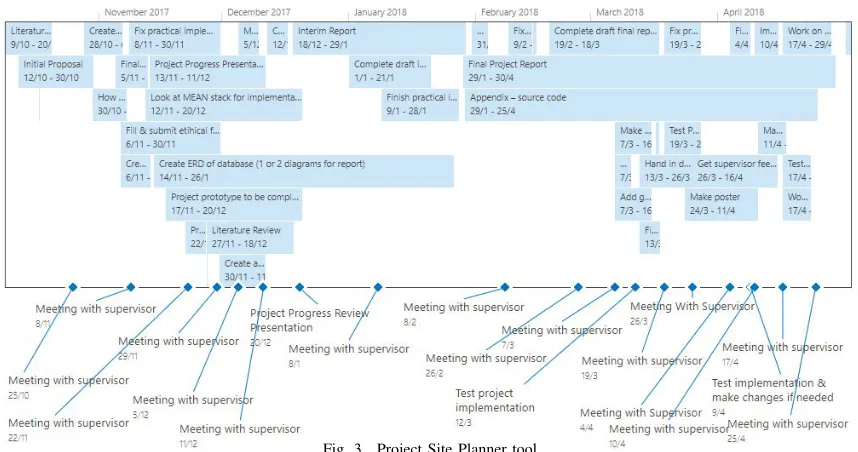
[image:4.612.324.551.441.708.2]Fig. 3. Project Site Planner tool
E. Project Planning
For students to make the most effective use of their time, they are required to draw up a project plan. The plan details the activities that they are going to undertake, when they were going to start them and when they expect to complete them. This plan considers factors such as the workload for the other modules that the students are studying, holiday periods and the various deadlines for the different tasks they need to undertake to complete their project. The plan also takes into account the extra knowledge and skills that the students need to acquire to reach a good outcome for their project. Supervisors help the students establish the project milestones, however, it is up to the student to keep on track, review, adjust and follow the plan. Students are encouraged to create their project plans using the project planner tool on their personal project site (Figure 3). The plan supports continuous diagnostic, formative feedback opportunities during supervision sessions, as well as, carry formative marks.
F. Project Progress Review Presentation
During mid-way through the project module, which in our particular case was teaching week 12, students are expected to take part in a project progress review presentation. This assessment is carried out by a panel of academic staff, which is made up of the students supervisor and an academic marker. Student’s are asked to cover the following:
• their project proposal and progress to date,
• literature review findings,
• design of proposed implementation and
• present their project plan with achieved and future
mile-stones via the planning tool on their project site. By this stage, students would have progressed significantly in terms of literature review, identifying the core and possible solutions to problem, identifying their methodology, tools and technologies required to support their project, an execution plan, and a design of the students proposed implementation.
The panel at this stage are expected to take a keen interest and advise on whether satisfactory progress was made, was the student clear about their project objectives and know what needs to be completed within the allocated time frame.
G. Project Reports
During the FYP, students are expected to produce two reports, where the first report is a subset of the final report. The first report is known as the interim report and includes a substantial amount of the literature review, project plan, and the design of the solution, which the student has to submit in week 19. This report follows on from the previous stage of progress review presentation and affords the students to take into account the feedback that they receive.
The final report is a culmination of the entire project work conducted and is due at the end of the project. The contents of the report include an abstract, problem statement, description of the proposed solution and state a conclusion regarding the success of the solution. In addition to this, the main body of the report would usually cover requirements analysis, design, implementation description, testing, results, validation, evaluation/discussion, conclusion and references.
H. Demonstration & Poster Assessment Event
A crucial element of the project assessment is based on the students participation at the demonstration and poster event. By this time, students have finished all their implementation, and are ready to present and demonstrate their project solution. As part of this assessment component, students are expected to exhibit their project work, both in the form of a poster and live demonstration. The showcasing event is a motivation driver for the students as it gives them the opportunity to openly demonstrate their projects.
TABLE II ASSESSMENTBREAKDOWN
25% 75%
Supporting Project Material Main Project Report Project progress presentation
in-cludes project plan and proof of supervisor engagement.
(25% of this components mark)
Interim report, which includes lit-erature review and project plan. (30% of this components mark)
A working demonstration, poster presentation at the annual demon-stration showcase event and a 15 minutes project viva presentation. (45% of this components mark)
Final project report.
(100% of this components mark)
demonstration event are awarded an automatic fail for the project. This highlights and attaches a significant importance to the practical demonstration which is vital for the computer science discipline.
I. Viva Presentation
The final assessment component for the project is a viva, where students are expected to prepare a presentation to illustrate their project work. The purpose of this viva is to focus on the practical part of the project and show how it is designed, how it works and its limitations. Student are questioned about their overall work. This is also a unique opportunity for the assessors of the work to be able to interact with the student. As such, they can question the student to clarify points that are missing or are not clearly articulated in student’s final report Hence, students can use this as a chance to clarify the points and gain value for their work.
J. Assessment Breakdown
The marks for the project are distributed over two assess-ment components and culminates the various milestones from Figure 1. The breakdown of the components is given in Table II. For our implementation, achieving a threshold mark of 40% is required for each component to pass the module. This is to ensure that students passed both components to pass the overall assessment.
V. EMPIRICALVALIDATION
The aim of this empirical validation is to investigate the impact and effectiveness of the proposed framework on the performance of students undertaking their FYPs within the Department of Engineering and Computing at University of East London. The following research questions are addressed: RQ1 - What impact does the proposed framework have on
performance?
RQ2- What is the performance variance for non-project and project modules for pre- and post- framework introduction? RQ3 - How does the final year project module performance
compare with similar modules from other disciplines? RQ4 - What is the impact of using technology on student
interaction?
RQ5- What were the operational impact and lessons learned from the implementation of the framework?
A. Participants and module structure
The data for students undertaking their final year project during the academic year 2015/16 is presented as part of this
TABLE III
PROJECTMODULE(COMPUTING) STATISTICS2014–2016 Year Enrolled Engaged Passed Average Standard
Students Students Students Marks Deviation
2014/15 135 70 55 57 18
2015/16 122 103 88 65 14
validation. This is the academic year where the framework was deployed for students from the subject area of Computer Science and Informatics at the University of East London. In addition to this, when comparing with other disciplines we also included and compared against project module or similar module results for 464 students across 6 disciplines for the same academic year.
B. Project Module Performance Trends
In this section we present the performance trends for the final year project module and address research questionRQ1. In order to addressRQ1, we look at the trend of student per-formance in their final year project in Computer Science and Informatics for the academic years 2014/15 (pre-framework) and 2015/16 (post-framework).
There are several metrics to determine the effectiveness of the proposed framework and to identify its impact. We consider student performance in terms ofpass rate(P R) as the percentage of engaged students who have passed the module and average marks (AM) of students to be key indicators. Given the recent alarming rate of attrition at UK universities and its impact on future institutional assessments frameworks such as the Teaching Excellence Framework (TEF) [13], we also consider engagement rate (ER) as the percentage of engaged students to be another key measure for the success of the framework.
For a module m, let, mS = {s1...sx}, be the set of enrolled students, mSE ={se1...sey} be the set of students who attempt all required assessments (i.e. engaged with the module),mSP ={sp1...spz} be the set of students who are awarded apassgrade, and,marks(sei)is the marks received by student sei.
We define the following measurement indicators for any modulem:
P R=|mSP|
|mSE|∗100 (Pass Rate)
ER=|mSE|
AM= y P
i=1
marks(sei)
|mSE| (Average mark)
Table III gives us the FYP module related statistics fort the two academic years 2014/15 and 2015/16. Column 2 of the table shows the number of students enrolled, column 3 shows the number of students engaged and column 4 gives the number of students who achieved a pass grade. Columns 5 and 6 reports the average marks and the standard deviation of the marks, respectively.
Looking at the pass rate (P R), it can be seen from Figure 4 that there is an increase in pass rate with the adoption of the framework in 2015/16, where the rate increased by nearly 7% to 85.4% in comparison to the previous year. Another interesting observation is the significantly lower pass rate in 2014/15, specially if we compare it against the total number of students enrolled which would bring the pass rate down to 41.7%. Another metric to measure the effectiveness of the proposed framework is the student engagement rate (ER). This is determined by the number of students who attempt the assessment components given the total number of students who are enrolled on to the project module. According to Figure 4, in 2015/16 the student engagement rate shot up to 84.5%, which is 32.7% higher than the previous year. The final metric we propose to use as a measure of the student performance is the average marks (AM) achieved on the module by the students. From Table III, it can be seen that the average mark obtained during 2015/16 was higher than the previous year. This is further highlighted by the difference, where the average marks achieved by students in 2015/16 was 65 as opposed to an average marks of 57 in 2014/15. We also include the standard deviation, which is smaller in 2015/16 indicating less variance. The reason why we see overall worse performance from students in 2014/15 is likely down to the lack of milestones and the overall module being judged using a single assessment component, which was the end of year project report. One of the main contributions of the proposed framework is the integration of regular assessment milestones both formative and summative, which act as building blocks for the entire project. These milestones also provide students with feedback throughout the year, which help students make improvements on an ongoing basis and in an iterative/agile form to their projects.
Fig. 4. Student performance (ERandP R) in Project Module
TABLE IV
PROJECT MODULE VSNON-PROJECT MODULE PERFORMANCE Cohort Non-project Module Project Module Project Module
Average Mark Average Mark Pass Rate (%)
1 55 57 79
2 51 65 85
Therefore, as an answer to research questionRQ1 in terms of the performance trends, we see that the introduction of the framework shows improved results in all three metrics. The pass rate indicates a healthy increase, student engagement shows a significant improvement and the average marks also show a stark improvements, while stabilizing the variance in the the marks received by the students.
C. Cohort Performance Analysis
The results in the previous section are highly encouraging, however, they do not consider the fact that the cohort for each academic year where the result was presented was different, and could lead to subject bias. That is, the cohort of students in 2015/16 could be academically better than the cohort of 2014/15, producing a skewed result. To study this in further depth, we ask research question RQ2, where we look at the performance of the two cohorts (one pre-framework and one post-framework introduction) in all their academic modules other than the project module and compare to the results of the project module. If there is more variance (improvement) found in the marks for the project module compared to the non-project module, this can then be attributed to the framework and not the cohort.
Therefore, we have classified students that started their three-year BSc programme in 2012/13 and took their final year project in 2014/15 as Cohort 1, while students who started in 2013/14 and took their final year project in 2015/16 have been classified as Cohort 2. Students in Cohort 1 did not carry out their project under the proposed framework, while students in Cohort 2 did. Based on this we have compared the project performance of Cohort 1 and Cohort 2 with other modules that they undertook during those periods, results of which can be seen in Table IV.
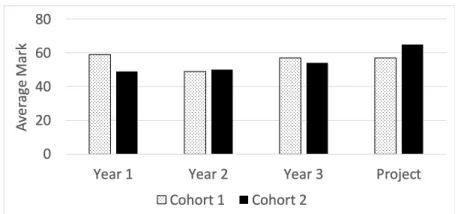
From Table IV, it can be seen that Cohort 1 had average marks of 55 over all the non-project modules, where as Cohort 2 had a lower average of 51. In contradiction, following the introduction of the framework, Cohort 2 obtained an average mark of 65 in the project module as opposed to 57 of Cohort 1. Similarly, the pass rate for Cohort 2 was also 6% higher. These results clearly demonstrate that the proposed project framework had a direct positive impact on student performance.
Fig. 5. Non-project and Project Module Cohort Performance
minimal, whereas, for Cohort 2 we see a sharp increase in average marks for the project module.
In answer toRQ2, we can say that the performance on non-project based module and non-project based modules were very similar for cohorts from pre-framework introduction and post-framework introduction, however, the project pass rate showed a 6% improvement, whereas the average mark increased by 8. Both of these strongly indicate that the positive change was a direct result of the introduction of the proposed framework.
D. Comparison with other disciplines
[image:8.612.321.553.118.239.2]In this section we answer research question RQ3, which asks about how the project module results from Computer Science following the introduction of the framework compares to that of similar project modules from other disciplines. In order perform this comparison and answerRQ3, we considered subject areas in 2015/16 where the project modules were 45 credits and had either a dissertation or report as final tangible output. The purpose of scoping this comparison is to ensure that we are comparing against similar modules and to see if the proposed framework is producing results comparable to other subject areas.
Fig. 6. Engagement Rates for Project modules from various disciplines
Figure 6 shows that other than the projects conducted in Digital Media and Design, the computing projects (post framework implementation) had a higher engagement rate than the other projects conducted across all other disciplines. It is also worth pointing out that the cohort for Digital Media and Design was significantly smaller (26 students) than the Computing cohort (122 students) for the comparison year. Furthermore, the 26 students from the department have been taught by a small number of lectures who run the entire
department, hence, engaging 26 students would be an easier task, as academics have already formed individual bonds and identified support structure for the students. This reinforces the already evident effectiveness of the proposed framework, as it is also able to handle and engage larger cohorts.
Fig. 7. Student Performance on Project modules from various disciplines
In terms of average marks (Figure 7), the Computing projects had a higher average mark than the projects conducted in other disciplines. This is even true for the area of Digital Media and Design which had a higher engagement rate but had an average mark of 52 compared to 65 for Computing. The pass rate (Figure 7) for all project modules ranged between 85% and 100%, with Computing standing at the bottom. It seems despite, strong improvements in results seen post-framework introduction, the pass rate of the discipline is still lacking behind. Although this requires further analysis of the results and methods in other areas, one interesting fact that should be noted is that disciplines with 98% pass rates such as “Psychosocial” and “Music and Performance” both have poor engagement rates, 69% and 64%, respectively, which can be one reason for significantly high pass rate statistics.
Therefore, in answer to RQ3, we find that following the introduction of the framework, the project module in Com-puting had the highest average marks and second highest engagement rate compared to all other disciplines across the various schools at the university. Despite the pass rate for the computing project module being the highest compared to the past few year, it is still lacking behind other disciplines.
E. SharePoint Project Site
In this Section we seek to answer research questionRQ4, which asks about the impact of introducing technology such as the individual SharePoint project sites within the framework. One of the novel aspects of the framework is the introduction of SharePoint Project sites, which provides students with a series of resources and tools to manage and conduct their projects. For engagement, we measured four aspects in terms of the SharePoint sites: inclusion of weekly logs, creation of project plans, making the site information and interaction with the site.
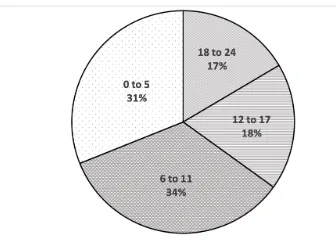
[image:8.612.49.301.447.590.2]Fig. 8. SharePoint Weekly Logs Statistics
only contributed to about 1% of the overall module marks. It can be seen from the data presented in Figure 8 that 17% of the students completed 18 to 24 weekly logs during the project, while 18% of the students completed 12 to 17. However, 34% of the students completed only 6 to 11 weekly logs, while 31% students completed 0 to 5 weekly logs. These results indicate that 35% of the students engaged with the weekly logs for a minimum of a term (12 weeks), which was mainly logs in the first term. This is the period where students were gathering data for their literature reviews, so the weekly logs were a useful tool to capture this information. Additionally this was also the period where the logs were considered as part of the assessment and was allocated summative marks.
Fig. 9. SharePoint Engagement Statistics
In terms of the project planning tool on the SharePoint site, the level of engagement among the students was very good, as 85% of the students had project plan (Figure 9). This is very encouraging, as students made extensive use of this tool, which also equips them with transferable skills that are important for employability. The SharePoint site also provided students with the tools to make their sites informative, so that these sites could then be used to showcase the students project. Additionally, 29% of the sites created were informative, which included information such as project aims, objectives, findings and a diagram that depicted the project. One reason as to why such a low number of students engaged with this aspect of the SharePoint, was due to the fact that it did not have an impact on the students mark, hence it was not compulsory in their view. Whereas, the students are required to include a project plan within their project reports, therefore 85% of the students used the SharePoint tool to carry out their project management and organize their associated learning material. Overall 97% of the students had some form of interaction with their project site (Figure 9).
Therefore, as an answer to research question RQ4 we find that the inclusion of the SharePoint site certainly contributed to improving student engagement and interaction. We find that
85% of the students used the project planning tool on the SharePoint site that strongly correlates to the overall module engagement of 85% for 2015/16. Furthermore, we found that 92% of the students have done some kind of interaction with the SharePoint site which is 6% higher than the module engagement rate. We learned two significant lessons from here. Firstly, that the SharePoint site interaction could be used as a diagnostic tool, that is, it can be used as an early indicator to identify students who are beginning to disengage from the module. Secondly, the aspects of the curriculum that does not provide formative feedback or contribute to the summative assessment is neglected, for example, making the ShaprePoint site informative and interactive.
F. Operational Impact and Lessons Learned
This section of the paper addresses research questionRQ5, and discusses the operational impact, direct student feedback and lessons learned. The implementation of this framework required some additional resources in terms of module plan-ning, delivery of training to the supervisors, configuration of the individual SharePoint sites and delivery of the SharePoint workshops to students. However, this all culminated in a more systematic approach where the supervisors were able to manage interaction with students via the SharePoint site, saving time and effort in the long-term and was acknowledged via positive feedback from colleagues as well as the students. The framework shows improvements in terms of both qual-itative and quantqual-itative results. On the qualqual-itative front, the department had an accreditation visit from BCS in November 2016. The Computer Science and the Computing for Busi-ness programmes were given full accreditation and the new framework for projects was highly praised by the panel. The project module was under intense scrutiny as it was one of the main reasons for losing previous accreditation. In its final report, the panel highly commended the new learning and teaching framework implemented for the project, the quality of the supporting materials, the use of SharePoint project sites for each individual student and the resulting improved project quality. The panel also stated that this should be shared as an example of good practice in the higher education nationally.
[image:9.612.74.278.349.433.2]in to verify our activities for the remainder of the year. The module team have achieved this feat by modernising lecture slides, reaching out to students to ensure full participation and by implementing SharePoint to give each student their own site to upload deliverables, liaise with supervisor, calendar deadlines and so much more... As a student I recognise the positive impact that it will have on my ability to reach my full potential”.
In addition to the quantitative improvements highlighted ear-lier, the framework also had a significant impact on producing outstanding average National Student Survey (NSS) results of 92% in 2015/16 as opposed to 83% in the previous year [26]. This also had a positive impact on increase in destination of higer education leavers (DLHE), which in the computing subject area, is closely linked to the quality of the portfolio-based final project.
G. Threats to Validity
Threats to internal validity concern the factors that may have incorrectly biased conclusions claimed by this study. In our case this is the correctness of the data and the cohort bias. We have used final ratified performance data and have also addressed the cohort bias by comparing the project and non-project results for multiple cohorts. Threats to external validity concern any factor that may limit the extent we can generalize our results. In the future, we are looking to extending this study with further framework implementation and trend analysis data to show improvements with stronger statistical confirmation. Finally, threats to construct validity concern the question of whether the experimental results are based on observation of factors that actually reflect our claims. We have defined each of our observations mathematically to remove any interpretation error and will also make annonymized data available.
VI. CONCLUSIONS ANDFUTUREWORK
In this paper we present an effective framework for enhanc-ing student engagement and performance in final year project module. Our implementation and validation study shows that the student engagement had increased by 33%, additionally, the pass rate on the module also increased by over 6% while the average mark went up by 8% compared to previous years. The framework received excellent qualitative feedback from external bodies, supervisors and students which was reflected in the student feedback and the NSS scores that are now heavily used in institutional rankings.
In the future, we want to make iterative improvements to the framework with lessons learned from the first incarnation to improve results, extend our study with further data to bolster the statistical significance of our claim, provide generalization and look at specific implementations for other subject areas.
ACKNOWLEDGEMENT
This work was supported by the Institute of Coding, which is supported by the Office for Students (OfS).
REFERENCES
[1] S. D. Brookfield. Becoming a critically reflective teacher. John Wiley & Sons, 2017.
[2] C. Bryson and L. Hand. The role of engagement in inspiring teaching and learning. Innovations in education and teaching international, 44(4):349–362, 2007.
[3] L. Cohen, L. Manion, and K. Morrison. Research methods in education, 2007.
[4] F. D. Davis, R. P. Bagozzi, and P. R. Warshaw. User acceptance of com-puter technology: a comparison of two theoretical models.Management science, 35(8):982–1003, 1989.
[5] J. A. Fredricks, P. C. Blumenfeld, and A. H. Paris. School engagement: Potential of the concept, state of the evidence. Review of Educational Research, 74(1):59–109, 2004.
[6] S. Freeman, S. L. Eddy, M. McDonough, M. K. Smith, N. Okoroafor, H. Jordt, and M. P. Wenderoth. Active learning increases student performance in science, engineering, and mathematics. Proceedings of the National Academy of Sciences, 111(23):8410–8415, 2014. [7] L. Gambin, R. Beaven, T. Hogarth, M. May-Gillings, and K. Long.
Methodological issues in estimating the value added of further education, higher education and skills: A review of relevant literature. 2014. [8] N. A. Gordon. Issues in retention and attainment in computer science.
York: Higher Education Academy, 2016.
[9] S. I. Ismail, R. Abdullah, S. A. C. Kar, N. Fadzal, H. Husni, and H. M. Omar. Online project evaluation and supervision system (opens) for final year project proposal development process. InStudent Conference on Research and Development, pages 210–214. IEEE, 2017.
[10] M. Kangas, P. Siklander, J. Randolph, and H. Ruokamo. Teachers’ en-gagement and students’ satisfaction with a playful learning environment. Teaching and Teacher Education, 63:274–284, 2017.
[11] P. Khamaruddin, A. Sauki, N. H. O. Kadri, A. N. C. A. Rahim, and A. Kadri. Technology acceptance model analysis on students’ behavioral intention of using moodle for fyp. In World Engineering Education Forum, pages 724–727. IEEE, 2017.
[12] P. Khamaruddin, A. Sauki, N. H. Othman, and A. Kadri. Using moodle as an integrated final year project management system. InInternational Conference on Engineering Education, pages 238–242. IEEE, 2017. [13] J. LeBihan, C. Hughes, and C. A. Taylor. The teaching excellence
framework: Quality, equality and student engagement in english higher education. InContexts for Diversity and Gender Identities in Higher Education: International Perspectives on Equity and Inclusion, pages 141–154. Emerald Publishing Limited, 2018.
[14] A. J. Martin. The student motivation scale: A tool for measuring and enhancing motivation. Journal of Psychologists and Counsellors in Schools, 11:1–20, 2001.
[15] I. McGill and L. Beaty. Action Learning: a guide for professional, management & educational development. Psychology Press, 2001. [16] I. Ortiz Marcos, ´A. Uruburu Colsa, S. Ortiz Marcos, and R. Caro
Car-retero. Final year project: students and instructors perceptions as a competence-strengthening tool for engineering students. International Journal of Engineering Education, 28(1):83–91, 2012.
[17] J. Pickering. How to start using technology in your teaching. http: //bit.ly/2PVuGQN, 2015. Accessed: 2018-11-25.
[18] K. A. Renninger and J. E. Bachrach. Studying triggers for interest and engagement using observational methods.Educational Psychologist, 50(1):58–69, 2015.
[19] R. S¨alj¨o. Digital tools and challenges to institutional traditions of learning: technologies, social memory and the performative nature of learning. Journal of computer assisted learning, 26(1):53–64, 2010. [20] R. K. Sawyer. The Cambridge handbook of the learning sciences.
Cambridge University Press, 2005.
[21] R. K. Sawyer. The Cambridge Handbook of the Learning Science. Cambridge University Press, 2006.
[22] P. Siklander, M. Kangas, S. Ruhalahti, and S. Korva. Exploring triggers for arousing interest in the online learning. InInternational Technology, Education and Development Conference, pages 9081–9089, 2017. [23] H. Singh. Building effective blended learning programs. Educational
Technology-Saddle Brook, 43(6):51–54, 2003.
[24] TLR. Effective learning and teaching in uk higher education. https: //goo.gl/6C1XUj, 2015. Accessed: 2018-11-25.
[25] V. Trowler. Student engagement literature review.The higher education academy, 11(1):1–15, 2010.
[26] UNISTATS. Unistats - official course data for universities and colleges. https://unistats.ac.uk/, 2015. Accessed: 2018-11-25.