T
he
L
ondon
S
chool of
E
conomics
and
P
olitical
S
cience
Misallocation of State Capacity?
Torsten Figueiredo Walter
Declaration
The copyright of this thesis rests with the author. Quotation from it is permitted, provided that full acknowledgment is made. This thesis may not be reproduced without the prior written consent of the author.
I warrant that this authorisation does not, to the best of my belief, infringe the rights of any third party.
Abstract
Acknowledgments
The completion of this thesis has led to the accumulation of enormous debts, to a great many people, that I will probably never be able to repay. I would like to thank Nava Ashraf, Oriana Bandiera, Gharad Bryan, and Robin Burgess for extensive advice and support. I also thank Shan Aman Rana, Michel Azulai, Clare Balboni, Andres Barrios Fernandez, Kelsey Jack, Niclas Moneke, Sandra Sequeira, Alessandro Sforza, Fred-erik Thenee, Sven Walter, Guo Xu, Celine Zipfel, and seminar participants at LSE for valuable comments. I thank Dylan Knaggs and Anton Heil for excellent research assistance.
In addition, I am thankful for help with data collection to Shan Aman Rana, Michel Azulai, Diego Battiston, Svetlana Chekmasova, Joshua Chipman, Andreas Ek, Luiza Figueiredo Walter, Amgalan Amgaa Gan-bat, Hanwei Huang, Dana Kassem, Ruth Kattumuri, Sevim Kosem, Panos Mavrokonstantis, Niclas Moneke, Chimgee Mongol, Daniel Morales, Abhiroop Mukhopadhyay, Bupe Musonda, Kieu-Trang Nguyen, Vesall Nourani, Tsogsag Nyamdavaa, Thomas O’Keeffe, Ka Phaydanglobriayao, Giulio Schinaia, Alessandro Sforza, Ella Spencer, Yegor Stadny, Junichi Yamasaki, and Celine Zipfel. Special thanks to Benjamin Chibuye, Miljan Sladoje and Twivwe Siwale at IGC Zambia as well as Alberto da Cruz, Novella Maugeri and Jorrit Oppewal at IGC Mozambique for their support of my in-country work. Thanks also to all the helpful employees at the Ministries of Education and Statistical Agencies in the many countries that are part of this thesis, especially to those in Mozambique and Zambia, as well as those at the Zambian Ministry of Health and EQUIP Zambia.
Thanks are also due to the administrative staff at LSE, with special mention to Rhoda Frith, Mark Wilbor, Jane Dickson, Nic Warner and Michael Rose.
Contents
1 Introduction 15
2 Theoretical framework for the analysis of teacher allocation 21
3 Cross-country comparison of the distribution of teachers across
public primary schools 24
3.1 Data . . . 24
3.1.1 Data collection . . . 24
3.1.2 Core data . . . 25
3.1.3 Complementary data . . . 29
3.2 Stylized facts . . . 35
3.2.1 Fact 1 . . . 35
3.2.2 Fact 2 . . . 40
3.2.3 Fact 3 . . . 46
4 Gains from Teacher Reallocation? Model Calibration and Simu-lation 50 4.1 Model calibration . . . 51
4.1.1 The effect of PTR on grade promotion . . . 51
4.1.2 Relative teacher costs . . . 53
4.2 Simulations . . . 56
4.2.1 Model for simulations . . . 56
4.2.2 Data for simulations . . . 57
4.2.3 Smallest achievable maximum PTR rule . . . 58
4.2.4 Optimal allocation . . . 64
4.2.5 Optimal allocation within subnational units . . . 66
5 Causes of PTR variation: A case study from Zambia 71
5.1 Ineffective teacher allocation policy . . . 72
5.2 Non-compliant deployment and transfers . . . 73
5.3 Payroll mismatch . . . 76
5.4 Weaknesses in the budgeting process . . . 77
5.5 Discussion . . . 79
6 Human resource misallocation in other public sectors? Evidence from the staffing of Zambian and English primary care facilities 81 6.1 Background and data . . . 84
6.1.1 Zambian primary care facilities . . . 84
6.1.2 English primary care facilities . . . 85
6.1.3 Complementary data . . . 86
6.2 Estimation of catchment populations . . . 87
6.3 Results . . . 91
6.4 Discussion . . . 95
7 Conclusion 96
References 98
Appendices 107
A Appendix to Chapter 1 108
B Appendix to Chapter 2 112
C Appendix to Chapter 3 115
D Appendix to Chapter 4 144
List of Tables
Chapter 1: Introduction 15
Chapter 2: Theoretical framework for the analysis of teacher
allocation 21
Chapter 3: Cross-country comparison of the distribution of teachers
across public primary schools 24
3.1 Data summary . . . 30
3.1 Data summary . . . 31
3.1 Data summary . . . 32
3.1 Data summary . . . 33
3.1 Data summary . . . 34
3.2 PTR variation and primary schooling outcomes across countries . . . 43
3.3 PTR variation and public primary schooling outcomes across districts . . . 45
Chapter 4: Gains from Teacher Reallocation? Model Calibration and Simulation 50 4.1 Measure of grade promotion by country . . . 57
4.1 Measure of grade promotion by country . . . 58
4.2 Cost of equivalent teacher workforce increases . . . 62
4.3 Correlation with educational attainment . . . 63
4.4 Associated educational attainment gains - Scenario 1 . . . . 63
Chapter 5: Causes of PTR variation: A case study from Zambia 71
Chapter 6: Human resource misallocation in other public sectors? 81
Appendix A: Introduction 108
Appendix B: Theoretical framework for the analysis of teacher
allocation 112
Appendix C: Cross-country comparison of the distribution of
teach-ers across public primary schools 115
C.1 Core data sources . . . 116
C.1 Core data sources . . . 117
C.1 Core data sources . . . 118
C.1 Core data sources . . . 119
C.1 Core data sources . . . 120
C.2 PTR time series data . . . 121
C.3 Regions and subregions . . . 121
C.3 Regions and subregions . . . 122
C.4 GPS coordinates data sources . . . 123
C.4 GPS coordinates data sources . . . 124
C.4 GPS coordinates data sources . . . 125
C.4 GPS coordinates data sources . . . 126
C.5 PTR variation and primary schooling outcomes across countries - full census only . . . 127
C.6 PTR variation and primary schooling outcomes across countries - weighted . . . 128
Appendix D: Gains from Teacher Reallocation? 144 D.1 Data sources: primary school teacher salaries . . . 145
D.2 Subnational units for counterfactual simulation . . . 145
List of Figures
Chapter 1: Introduction 15
Chapter 2: Theoretical framework for the analysis of teacher
allocation 21
Chapter 3: Cross-country comparison of the distribution of teachers
across public primary schools 24
3.1 Data coverage . . . 26 3.2 Distribution of PTRs across public primary schools in
selected countries . . . 37 3.3 National PTR in public primary education and income
across countries . . . 38 3.4 PTR variation in public primary education and income
across countries . . . 39 3.5 Right tail of the cross-school PTR distribution and income
across countries . . . 40 3.6 PTR variation in public primary education and income over
time across countries . . . 41 3.7 PTR heat map Zambia . . . 44 3.8 PTR distribution by quartile of population density (GHS)
in Mozambique . . . 47 3.9 PTRs and population density (GHS) across countries by
Chapter 4: Gains from Teacher Reallocation? Model Calibration
and Simulation 50
4.1 Illustration of calibrated policy function . . . 54 4.2 Distribution of PTRs by hardship allowance category in
Zambia . . . 55 4.3 Distribution of PTRs by quartile of teacher retention rates
in Zambia . . . 56 4.4 Maximum PTR rule under small and large teacher stock . . 59 4.5 Actual and counterfactual PTR distribution under smallest
achievable maximum PTR rule . . . 60 4.6 PTR variation under smallest achievable maximum PTR rule 61 4.7 Promotion gains under smallest achievable maximum PTR
rule . . . 62 4.8 Actual and optimal PTR distribution . . . 65 4.9 Promotion gains under optimal allocation . . . 65 4.10 Actual and counterfactual PTR distribution under optimal
allocation within subnational units . . . 66 4.11 Promotion gains under optimal allocation within
subna-tional units . . . 67 4.12 Promotion gains under smallest achievable maximum PTR
rule - Small β . . . 68 4.13 Promotion gains under smallest achievable maximum PTR
rule - Large β . . . 69
Chapter 5: Causes of PTR variation: A case study from Zambia 71
5.1 Distribution of PTRs across public primary schools in Zambia 72 5.2 Actual versus prescribed number of teachers across public
primary schools . . . 73 5.3 Need for teachers and deployment of teachers in the
following year . . . 74 5.4 Distribution of holding periods (completed years) among
5.6 Actual and sanctioned distribution of PTRs across public primary schools in 2014 . . . 78
Chapter 6: Human resource misallocation in other public sectors? 81
6.1 Doctors, nurses, and midwives per 1000 population across countries by income . . . 82 6.2 Health facility catchment areas in Northern Zambia by
construction method . . . 88 6.3 Comparison of catchment population estimates across
meth-ods and countries . . . 90 6.4 Distribution of PHRs across primary care facilities . . . 92 6.5 Distribution of population per high-skilled health worker
across primary care facilities . . . 93 6.6 Heat maps of PHRs . . . 94 6.7 PHR distribution by quartile of population density in Zambia 95
Appendix A: Introduction 108
A.1 Years of free primary education guaranteed in legal frame-work across countries . . . 109 A.2 Years of compulsory primary education guaranteed in legal
framework across countries . . . 110 A.3 Share of primary school pupils in public institutions and
income across countries . . . 110 A.4 Government expenditure on teacher compensation and
income across countries . . . 111 A.5 National PTR in primary education and per capita income
across countries . . . 111
Appendix B: Theoretical framework for the analysis of teacher
allocation 112
B.1 Primary school enrollment in Africa . . . 113 B.2 Primary school completion and survival across countries
Appendix C: Cross-country comparison of the distribution of
teach-ers across public primary schools 115
C.1 School census return rates among public schools across African countries . . . 129 C.2 Number of countries by year of data . . . 129 C.3 Distribution of primary education entrance age across
sample countries . . . 130 C.4 Distribution of maximum number of grades taught in
included school types . . . 130 C.5 PTR variation in public primary education and income
across countries - weighted . . . 131 C.6 PTR variation in public primary education and income
across countries - full census only . . . 132 C.7 PTR coefficient of variation in public primary education
and income across countries . . . 133 C.8 Right tail of the PTR distribution and income across
countries - weighted . . . 134 C.9 Right tail of the PTR distribution and income across
countries - full census only . . . 135 C.10 Cross-school PTR variation within and between regions of
a country . . . 136 C.11 Cross-school PTR variation within and between subregions
of a country . . . 137 C.12 PTR distribution by quartile of population density (GPW)
in Mozambique . . . 138 C.13 PTR distribution by quartile of nighttime luminosity in
Mozambique . . . 138 C.14 PTR distribution by quartile of travel time to the closest city
in Mozambique . . . 139 C.15 PTRs and population density (GPW) across countries by
C.17 PTRs and travel time to closest city across countries by income . . . 142 C.18 PTR variation within and between rural/urban classification 143 C.19 Actual and counterfactual PTR standard deviation and
national PTR across countries . . . 143
Appendix D: Gains from Teacher Reallocation? 144
D.1 Distribution of PTRs by hardship allowance category in Mozambique . . . 147 D.2 Distribution of PTRs by quartile of teacher retention rates
in Uganda . . . 147
Appendix E: Human resource misallocation in other public sectors?148
E.1 Distribution of PHRs across primary care facilities in Zambia - including facilities without official catchment population counts . . . 149 E.2 PHR distribution by quartile of nighttime luminosity in
Zambia . . . 150 E.3 PHR distribution by quartile of travel time to closest city in
Chapter 1
Introduction
Human capital is key for the delivery of public services. There would be no schools without teachers, no hospitals without doctors, no police stations without officers. However, a growing body of evidence points to inefficient human capital allocation in the public sector of developing countries. Politically driven recruitment and transfer decisions are common and human resource management capacity is limited (Akhtari et al. 2017, Asim et al. 2017, Beteille 2009, Lemos & Scur 2016, Sharma & Ramachandran 2009). This raises the question to what extent human capital is misallocated in developing countries. Echoing the literature on capital misallocation across firms (Hsieh & Klenow 2009)1, this thesis asks whether human capital is misallocated across public institutions.
Focusing on public primary education, I conduct a comparative anal-ysis across 86 countries and ask whether teachers are misallocated across public primary schools within countries. I concentrate on the public primary school sector for four reasons. First, education is paramount for development. Second, public primary schools are arguably one of the most common public institutions worldwide. After all, primary education is nearly universally free and compulsory2, and by and large
1See Restuccia & Rogerson (2017) for a recent review of the literature.
2Figures A.1 and A.2 show that primary education is free in 185 countries and
publicly provided3. Third, teachers are the main input to primary education, as reflected by the large share of government education expenditure going to teacher compensation throughout the world. Across countries, on average 63.5% of total government expenditure for public primary education is spent on teacher compensation4. Finally, teachers typically represent a large share of civil servants in a country, with a majority employed in primary education.
To study the allocation of teachers across public primary schools, I build a new global school-level data set comprising 1.73 million public primary schools in 86 countries across all continents and income levels. This data is largely collected from governmental Education Management Information Systems comprising the universe of public primary schools in 70 countries. It is complemented by data from state-level school censuses in six countries and nationally representative surveys from ten countries. In line with common wisdom, I document a strong negative correlation between school-level pupil-teacher ratios (PTRs) and the level of income of a country5. More strikingly, I find that the within-country variation in PTRs is also higher in lower income countries. For example, the difference between the 90th and the 10th percentile of the cross-school PTR distribution in Mozambique is 69.7. In the UK, the equivalent difference is as small as 10. This negative correlation between PTR variation and per capita income is also found within countries over time. Cross-country regressions and cross-district regressions within developing countries suggest that teachers may be misallocated across schools in developing countries: aggregate educational attainment and PTR variation are negatively correlated - even after controlling for differences in per capita income and aggregate PTR. The conjecture
3Figure A.3 shows the share of primary school pupils enrolled in public institutions
in 128 countries. 88.5% of all primary school pupils in these countries attend public institutions.
4Figure A.4 shows teacher compensation as a share of total government expenditure
on public primary education by country.
5This relationship can also be found in publicly available data from the UNESCO
of misallocation is further supported by a third new stylized fact. School remoteness can only explain a small share of PTR variation in developing countries. Thus, the observed PTR differences are not simply the consequence of differences in teacher labor supply or demand for education between rural and urban areas.
be seriously misallocated across public primary schools in developing countries in South Asia and Sub-Saharan Africa.
I finish by discussing the causes and implications of my findings. Given the large estimated gains from teacher reallocation, one has to ask how large the costs of reallocation would be. In order to understand these costs, the causes of teacher misallocation need to be identified in the first place. Therefore, I conduct a case study in Zambia. In collaboration with the Zambian Ministry of General Education, I examine budgeting, deployment, and transfers of teachers. The resulting evidence points to lack of managerial capacity and weak enforcement of teacher allocation policies as important underlying factors of PTR variation. Evidence from other countries (e.g. Asim et al. 2017, Ramachandran et al. 2018) paints a similar picture.
These causes are unlikely to be confined to the public education sector. Other public sectors in developing countries, such as health, law enforcement, and administration, are likely to be similarly affected and therefore human capital misallocation could be an important issue in these as well. In fact, the documented stylized facts on the distribution of public primary school teachers appear to hold in the public health sector as well. Comparing the distribution of health workers across public primary care facilities in Zambia and England, I find a significantly larger dispersion in population per health worker in Zambia than in England. Additionally, only a very small share of the differences in staffing levels across Zambian facilities can be explained by facility remoteness.
implications and causes in selected countries (Agarwal et al. 2016 and Pelkonen & Fagernas 2017 in India, Asim et al. 2017 in Malawi). This thesis focuses on public primary schools and adds a detailed systematic global cross-country comparison to this literature.
Second, this thesis contributes to a long literature on the supply of education in developing countries. This branch of literature has examined to what extent the lack of specific resources - from flip charts (Glewwe et al. 2004) to teacher knowledge (Bold et al. 2017), school monitoring (Duflo et al. 2012, Muralidharan et al. 2017), management practices (Lemos & Scur 2016), and beyond - hampers educational performance. Rather than focusing on the effect of the lack of a given resource, this thesis points to inefficient resource allocation as a hindrance to better aggregate educational outcomes.
Third, it relates to the literature on the personnel economics of the state. While the focus of this literature has been on the selection of state-employees (Ashraf et al. 2018, Dal Bo et al. 2013) and performance incentives (De Ree et al. 2018, Muralidharan & Sundararaman 2011), the long tail of poorly staffed schools in many developing countries revealed in this thesis serves as a reminder that performance-enhancing selection and incentive schemes can only have a limited effect at such schools -unless they also address the prevailing low staffing levels themselves.
Finally, it contributes to the literature on misallocation of production factors across producers in two ways. First, it extends it into the public sector and second, it looks specifically at human captial. This is unlike most of the existing literature which has focused on the misallocation of capital across firms (e.g. Busso et al. 2013, Hsieh & Klenow 2009).
Chapter 2
Theoretical framework for the
analysis of teacher allocation
In this chapter, I briefly outline a theoretical framework to characterize the notion of teacher misallocation underlying the empirical analysis in chapter 3.
The setup is as follows. A social planner allocates teachers across public primary schools subject to a budget constraint. Teachers are assumed to be homogeneous. This is for two reasons. First, there is typically no subject specialization among primary school teachers. Teachers usually teach all subjects to a given class. Second, differences in teacher quality are not considered due to a lack of available data1. The objective of the social planner is universal primary education2. As the 2018 World Development Report states, ”most children today enroll in primary school” (World Bank 2018), even in low-income countries3. Therefore, I take initial enrollment of pupils as given and focus on school
1Teacher quality is typically estimated through teacher value-added models. These
require rich panel data on teachers and the performance of their pupils which is not available in most developing countries. Teacher qualifications are more easily available, but it is unclear in how far qualifications actually predict teacher performance.
2This is a common goal among policy makers which has been widely promoted by
international organizations. It is part of the fourth UN sustainable development goal to ”ensure that all girls and boys complete free, equitable and quality primary and secondary education”.
completion conditional on initial enrollment4. The planner’s optimization problem can then be written as follows:
max
Ts
∑
sPs
∑jPj
Hs(ts, .)
s.t.
∑
s
wsTs ≤ B
where Ps indicates the number of pupils in school s, Ts the number
of teachers, and ts = Ts/Ps is defined as the number of teachers per
pupil. Hs is the grade promotion rate, i.e. the share of pupils that
advances to the next grade. The grade promotion rate at each school is weighted by the enrollment share of the schoolPs/∑jPj. Hence, the social
planner maximizes the total number of pupils in public primary schools advancing to the next grade. The cost of having a teacher at school s is
ws and the budget constraint says that the total cost for teachers cannot
exceed the budget B.
I assume that the grade promotion rate H is a function of school quality Qeand location-specific demand factors L:
H =hQe,L
e
Q captures school-specific inputs such as the number of teachers per pupil t, learning materials, school infrastructure and school manage-ment. L captures location-specific determinants of demand for primary education, such as location-specific household preferences, returns to education, and opportunity costs. h describes the household education investment decision given Qe and L, and will henceforth be referred to as
the policy function5.
4Figure B.2 shows that there is substantial variation in primary school completion
across countries.
Given this setup, a necessary condition for an interior solution to the social planner’s problem is
∂h
∂t(ti,Qi,Li)
wi
= ∂h
∂t(tj,Qj,Lj)
wj (2.1)
where Qe = {t,Q}. This condition illustrates that in this framework
cross-school variation in three factors can rationalize PTR variation across public primary schools:
1. School quality (ti and Qi)
2. Location-specific demand factors (Li)
3. Teacher costs (wi)
Chapter 3
Cross-country comparison of the
distribution of teachers across
public primary schools
3.1
Data
In order to examine the distribution of teachers across public primary schools, I collected school-level data on pupil-teacher ratios for the universe of public primary schools in 70 countries. This data is supplemented by state-level school censuses from six countries and nationally representative school- and household survey data from an additional ten countries. Below I describe the data collection process and the resulting data set.
3.1.1
Data collection
Data collection was carried out in three steps as detailed below.
This way I found publicly available school census data online for 47 countries.
In a second step, I sent a data request letter to the Ministry of Education and/or Central Statistical Agency of all remaining countries as long as a point of contact (email address or personal contact) could be found. In some countries with decentralized education systems, data requests were sent to state- or province-level authorities. Overall, I sent out more than 250 data requests in five different languages and collected data from 39 countries this way.
Third, for all countries where neither of the two previous approaches had been successful, I checked the availability of nationally representative school survey data with information on school-level PTRs. This way, data for another ten countries was added.
Overall, I obtained data from 86 countries in 14 different languages and many different formats. Finally, I synchronized language and format of the data across countries. Table C.1 gives a detailed overview of the all the data sources and the following subsection provides a description of the resulting data set.
3.1.2
Core data
The final data set contains school-level PTR data from 86 different coun-tries across all continents and income levels. As previously mentioned, countries can be subdivided into three categories. First, for 70 countries, school census data for the national universe of public primary schools was obtained1. Second, for six countries, school census data was only obtained from a subset of states or provinces (covering the universe of public primary schools within those). Third, nationally representative
1It is difficult to assess whether the school census data indeed covers all public
survey data was collected for ten countries. Figure 3.1 provides an overview of the geographical coverage of the data set.
Figure 3.1: Data coverage
The final data set contains information on more than 1.73 million public primary schools attended by a total of approximately 273 million primary school pupils. Given a total world population between the age of 5 and 14 of roughly 1.24 billion in 2015, this means it covers about 22% of all primary school pupils worldwide. The total number of teachers working at these schools adds up to almost 12 million.
For each country, the year of the data corresponds to the latest available year at the time of data collection. The majority of the data is from the time period between 2013 and 2017. Only 7 out of 86 country-level data sets are from before 2013, with the earliest data from Botswana in 20092. Table 3.1 specifies the year of the data for each country and provides basic summary statistics for each country. Further details are documented in table C.1.
PTRs are generally computed as the ratio of pupil headcount over teacher headcount3. While it would be desirable to use full-time equivalents instead of headcounts, such data is rarely available. Hence, for the sake of comparability headcounts are used whenever possible.
2Figure C.2 shows the number of data sets by year.
3Note that school-level teacher headcounts imply that teachers are counted
However, in ten countries teacher headcounts were not available. In seven of these, teacher full-time equivalents could be obtained instead4. In the remaining three countries, the total number of school staff (teachers plus management/administration personnel) was used as the denominator5.
While the data is generally restricted to public primary schools, in five countries the data also contains private primary schools as these cannot be differentiated from public schools in the source data. However, in all of these countries the number of private primary schools is negligibly small6.
The age at which children start primary education varies little across countries, and is always between 5 and 77. Primary education is most commonly provided through primary schools, but in some countries other school types also provide primary education. For example, in Mongolia primary education is mainly provided at comprehensive schools that run from grade 1 to 12. In order to maintain comparability across schools within each country, I restrict the data to the types of school that are the primary providers of primary education. Table 3.1 lists the included types of schools for each country8. The number of grades taught in these schools varies substantially across countries and is also indicated in the table. It reaches from 4 to 12 grades. Primary schools with 6 grades are the most common type9.
4The respective countries where teacher full-time equivalents are used to compute
school-level PTRs are Brazil, Canada, Ireland, Puerto Rico, Sweden, the UK, and the US.
5The respective countries where school staff headcounts were used instead of teacher
headcounts are Belgium (Flanders), Fiji, and France.
6The respective countries where the data also contains private primary schools are
Cape Verde (0.97%), Fiji (0.86%), Saint Vincent and the Grenadines (10.57%), Swaziland (1.55%), and Ukraine (0.58%). The percentage of enrolment in primary education in private institutions in 2015 is given in brackets (source: World Bank International Comparison Program Database). The information for Swaziland is from 2014 as 2015 data was not available.
7Figure C.3 shows the distribution of primary school entrance age across all sample
countries. The underlying data is from 2015 and was extracted from the website of the UNESCO Institute for Statistics on 13/07/2017.
8Apart from the indicated grades, schools may also include pre-primary education.
9Figure C.4 shows the distribution of the maximum number of grades taught at
The survey data used to supplement the school census data comes from two sources. First, data for nine French-speaking countries in West Africa was obtained from PASEC (Programme d’Analyse des Systemes Educatifs de la Conference des ministres de l’Education des Etats et Gouvernements de la Francophonie). In 2014, PASEC carried out nationally representative surveys of primary schools in these nine countries and collected data on the total number of pupils and teachers in each school through interviews with school principals10. I restrict the sample of schools in each country to public primary schools, and use sample weights to construct the distribution of PTRs across public primary schools.
Finally, data for Kenya is from UWEZO 2014. This is a nationally representative household survey to assess learning of children, similar to the well-known ASER survey in India. Households are selected through a three stage sampling process. First, districts are randomly drawn (with equal probability). Then enumeration areas (villages) are picked with selection probability proportional to size, and within each enumeration area households are randomly selected. In addition, a government primary school is surveyed in every sample village. The cross-school PTR distribution is constructed based on the schools contained in the UWEZO sample.
Neither the PASEC nor the UWEZO school surveys were designed to generate a nationally representative picture of the PTR variation across public primary schools in the respective countries. Therefore, the measures of cross-school PTR variation for these ten countries which are derived below should be regarded as tentative. All the subsequent results are robust to dropping these ten countries, and the corresponding results are available in the appendix.
10The sample frame included all schools with at least one class in grade 6. The
3.1.3
Complementary data
Two types of complementary data were collected along with the core data. First, for a subset of 20 countries, not only the latest available school census, but school census data going as far back as possible was obtained. Table C.2 lists those countries and indicates the years for which data was available.
Second, data on the location of schools was collected. For all but three countries with census data, information on the region in which each school is located was gathered. For 51 countries, subregions were also obtained. A region was defined as the highest administrative division available (e.g. state or province) or the statistical division that is closest to it (e.g. NUTS-2). A subregion was analogously defined as the second highest administrative division available (e.g. district) or the statistical division that is closest to it (e.g. NUTS-3). Table C.3 provides further details including the definition of a region and a subregion used throughout this paper for each country.
In addition, for 51 countries GPS coordinates of schools were gathered. These were either downloaded or requested from the corresponding Ministry of Education. For 34 countries, GPS coordinates were available, for 17 countries school addresses were transformed into GPS coordinates using Google Maps Geocoding API. For few countries, coordinates for all schools could be obtained, but overall the coordinate data is fairly complete. The share of schools for which coordinates are available is on average 94%. Table C.4 provides detailed information on the data source for each country and the completeness of the data11.
11Quality of the data varies across countries. In a few countries, a relatively large
Table 3.1: Data summary
Country Data type Year School types (grades) Schools Pupils (K) Teachers (K)
Antigua and Barbuda Census 2010/11 PRIM (1-6) 30 5.1 0.4
Argentina Census 2015 PRIM (1-6, 1-7) 18408 3482.3 273.6
Australia Census 2016 PRIM (1-6) 4735 1437.3 95.6
Austria Census* 2016/17 PRIM (1-4) 1771 176.1 20.0
Belgium Census* 2017 PRIM (1-6) 918 267.4 29.9
Benin Survey 2014 PRIM (1-6) 133 44.1 0.7
Bhutan Census 2015 PRIM (1-6) 413 45.4 2.5
Botswana Census 2009 PRIM (1-7) 707 298.4 11.5
Brazil Census 2015 PRIM (1-8, 1-9) 79805 22132.3 1040.3
Burkina Faso Census 2017 PRIM (1-6) 11537 2429.0 58.4
Burundi Survey 2014 PRIM (1-6) 165 102.8 2.6
Cambodia Census 2014 PRIM (1-6) 6164 1784.0 40.6
Cameroon Survey 2014 PRIM (1-6) 177 47.4 0.9
Canada Census* 2014-16 PRIM (1-5, 1-8) 3471 1326.1 73.7
Cape Verde Census 2014/15 PRIM (1-6) 407 63.6 2.9
Chad Survey 2014 PRIM (1-6) 93 42.9 0.7
Chile Census 2015 PRIM (1-8) 3764 666.2 56.5
Colombia Census 2015 PRIM (1-5) 39953 3488.8 40.0
Congo, Rep. Survey 2014 PRIM (1-6) 81 35.0 0.4
Table 3.1: Data summary
Country Data type Year School types (grades) Schools Pupils (K) Teachers (K)
Costa Rica Census 2016 PRIM (1-6) 3674 538.7 28.6
Cote d’Ivoire Survey 2014 PRIM (1-6) 144 40.9 0.8
Czech Republic Census 2017 PRIM (1-9) 3900 886.8 70.4
Denmark Census 2015/16 COMP (1-10, 1-11) 1204 524.6 55.0
Djibouti Census 2014/15 PRIM (1-5) 132 56.3 1.6
Dominican Republic Census 2016/17 PRIM (1-6) 3936 777.4 40.7
Ecuador Census 2015/16 PRIM (1-7) 9245 790.1 33.1
El Salvador Census 2013 PRIM (1-9) 4224 912.1 30.1
Estonia Census 2016 PRIM (1-3, 1-6) 415 79.7 10.5
Fiji Census 2017 PRIM (1-6) 691 142.3 5.7
France Census 2015/16 PRIM (1-5) 29550 3930.9 189.4
Georgia Census 2016 COMP (1-12) 1587 486.7 53.1
Germany Census* 2014/15 PRIM (1-4) 2017 389.8 28.5
Guatemala Census 2015 PRIM (1-3, 1-6, 4-6) 19448 2453.2 108.4
Guinea-Bissau Census 2014 PRIM (1-4, 1-6) 694 170.7 5.7
Honduras Census 2012 PRIM (1-6, 1-9) 11440 1192.8 79.4
Hungary Census 2015/16 PRIM (1-8) 2952 629.4 65.0
India Census 2015 PRIM (1-5, 6-8, 1-8) 981351 97279.2 3825.0
Ireland Census 2015/16 PRIM (1-6) 3124 541.0 31.8
Table 3.1: Data summary
Country Data type Year School types (grades) Schools Pupils (K) Teachers (K)
Jamaica Census 2015 PRIM (1-6) 377 136.0 4.7
Kenya Survey 2014 PRIM (1-8) 4135 2373.6 68.6
Kiribati Census 2011 PRIM (1-6) 94 15.5 0.6
Kyrgyzstan Census 2015 COMP (1-11) 1674 822.8 60.6
Laos Census 2016/17 PRIM (1-5) 8606 807.4 38.1
Latvia Census 2016 PRIM (1-6) & BAS (1-9) 369 51.0 7.4
Liberia Census 2015 PRIM (1-6) & BAS (1-9) 2486 335.7 12.2
Libya Census 2012 PRIM (1-6) & BAS (1-9) 3194 1005.4 175.9
Lithuania Census 2016 PRIM (1-4) & BAS (1-10) 555 57.3 4.5
Madagascar Census 2016 PRIM (1-5) 24447 3857.8 89.8
Malawi Census 2016 PRIM (1-8) 5404 4703.5 68.4
Marshall Islands Census 2013/14 PRIM (1-8) 80 9.7 0.7
Mexico Census 2015/16 PRIM (1-6) 88991 12969.9 514.0
Moldova Census 2016 PRIM (1-4) & BAS (1-9) 906 69.3 4.4
Mongolia Census 2016 BAS (1-9) & COMP (1-12) 614 272.1 8.9
Mozambique Census 2016 PRIM (1-5, 6-7, 1-7) 12386 5815.3 108.2
Netherlands Census 2015/16 PRIM (1-8) 2059 437.1 36.2
New Zealand Census 2015 PRIM (1-5, 1-7, 6-7) 1691 405.1 26.1
Niger Survey 2014 PRIM (1-6) 166 61.8 1.5
Table 3.1: Data summary
Country Data type Year School types (grades) Schools Pupils (K) Teachers (K)
Norway Census 2016/17 PRIM (1-7) 2114 429.4 40.6
Pakistan Census* 2013-16 PRIM (1-5) 80593 7044.5 206.6
Palau Census 2016 PRIM (1-6) 18 1.8 0.2
Papua New Guinea Census 2016 PRIM (1-6) 4264 732.9 19.8
Paraguay Census 2013/14 PRIM (1-6, 1-9) 5176 676.2 62.3
Peru Census 2016 PRIM (1-6) 29141 2563.5 140.6
Philippines Census 2013/14 PRIM (1-6) 37948 14952.8 377.5
Poland Census 2017 PRIM (1-6) 9577 2675.3 331.1
Puerto Rico Census 2014/15 PRIM (1-5, 1-6, 1-7, 1-8) 771 180.8 14.0
St Kitts and Nevis Census 2013/14 PRIM (1-6) 24 4.3 0.3
St Lucia Census 2014/15 PRIM (1-9) 74 15.8 1.0
St Vincent and the Grenadines Census 2014/15 PRIM (1-6) 68 13.4 0.9
Samoa Census 2015 PRIM (1-8) 143 33.7 1.1
Senegal Survey 2014 PRIM (1-6) 134 68.6 1.4
Seychelles Census 2012 PRIM (1-6) 24 10.4 0.9
South Africa Census 2015 PRIM (1-7) 13781 6497.8 190.8
South Sudan Census 2015 PRIM (1-8) 2409 884.7 20.2
Sudan Census* 2012 PRIM (1-8) 1309 498.0 17.1
Suriname Census 2016 PRIM (1-7) 333 69.6 5.9
Table 3.1: Data summary
Country Data type Year School types (grades) Schools Pupils (K) Teachers (K)
Swaziland Census 2013 PRIM (1-7) 591 235.2 8.2
Sweden Census 2015/16 PRIM (1-9) 3982 838.4 68.8
Tanzania Census 2016 PRIM (1-7) 14598 7489.3 172.5
Togo Survey 2014 PRIM (1-6) 141 35.9 0.7
UK Census 2015/16 PRIM (1-4) 20118 5289.6 255.1
US Census 2014/15 PRIM (1-5, 1-6, 1-7, 1-8) 51732 24046.2 1471.0
Uganda Census 2016 PRIM (1-7) 11357 6702.4 122.4
Ukraine Census 2013/14 COMP (1-10, 1-11) 16370 3771.4 443.0
Uruguay Census 2015 PRIM (1-6) 1953 247.8 11.4
Zambia Census 2015 PRIM (1-7) & BAS (1-9) 5790 2864.1 62.0
The table indicates three different types of data: census, census*, and survey. Census means that data for the universe public primary schools was collected. Census* indicates that data for the universe of public primary schools was collected from a subset of the highest administrative divisions in the country. See table C.1 for details. Survey indicates that the collected data is from a nationally representative school or household survey. Column (4) lists the included school types for each country and the typical grade range at these schools. PRIM stands for primary, BAS for basic, and COMP for comprehensive. Apart from the indicated grades, schools may also include pre-primary education. The last three columns provide information on the total number of schools, pupils and teachers contained in the data. Totals are computed after dropping schools for which PTR information was not available. See table C.1 for details on the share of public primary schools without PTR information.
3.2
Stylized facts
In this section, I compare the distribution of teachers across public primary schools between and within countries based on the assembled data. I document three new stylized facts that are jointly suggestive of teacher misallocation across public primary schools in developing countries. These facts are:
1. PTR variation is negatively correlated with per capita income, both across countries and within countries across time.
2. PTR variation is negatively correlated with aggregate education outcomes even after controlling for differences in income and aggregate PTRs.
3. In low- and lower-middle-income countries, PTRs are larger in remote schools, but remoteness can only explain a small share of overall PTR variation.
The first two facts on their own are suggestive of misallocation. The third fact rules out that PTR variation in developing countries can be rationalized by spatial variation in teacher labor supply or demand for education between rural and urban areas.
3.2.1
Fact 1
PTR variation is negatively correlated with per capita income, both across countries and within countries across time.
Figure 3.2 shows the PTR distribution across public primary schools in four different countries - a low-income country (Mozambique), a lower-middle-income country (India), an upper-middle income country (Peru) and a high-income country (UK) - in black12. Grey dashed lines represent
12The data for each country are trimmed at bottom and the top. The 1st and the 99th
the enrollment-weighted PTR distribution across public primary schools. A comparison of these four distributions yields three observations. First, average PTR in the low-income country Mozambique is substantially higher than in the other countries. While the mean PTR is 59.8 in Mozambique, it is only 24.9 in India, 14.2 in Peru and 20.4 in the UK. Second, cross-school PTR variation is large in the lower income countries, but small in the higher income countries. The cross-school PTR standard deviation amounts to 27.4 and 18.2, respectively, in Mozambique and India, but it measures only 6.8 and 3.8, respectively, in Peru and the UK13. Third, the poorer a country, the longer is the right tail of schools with high PTRs. These three cross-country observations hold independently of whether schools are weighted by their enrollment or not. They also hold across countries more generally and I document this below.
As outlined in the introduction, it is known that aggregate PTRs in primary education are higher in low income-countries14. Since the large majority of primary education is publicly provided, it is not surprising that figure 3.3 confirms this relationship for the public primary education sector15.
Figure 3.4 illustrates the negative relationship between cross-school PTR variation in the public primary education sector and per capita income across countries. It plots the cross-school PTR standard deviation within each country against per capita income. Note that the negative association between PTR dispersion and per capita income is not simply a consequence of high aggregate PTRs in low-income countries. While it can be shown through simulations that the indivisibility of teachers causes PTR variation to increase in aggregate PTR even if the objective is
13All figures are based on the unweighted distributions illustrated in black. 14See figure A.5.
15For a given country, the national aggregate PTR is computed as the total number
0
.01
.02
.03
0 50 100 150 200 250
Pupil-Teacher Ratio
(a) Mozambique
0
.01
.02
.03
.04
0 50 100 150 200 250
Pupil-Teacher Ratio
(b) India
0
.02
.04
.06
0 50 100 150 200 250
Pupil-Teacher Ratio
(c) Peru
0
.05
.1
.15
0 50 100 150 200 250
Pupil-Teacher Ratio
[image:38.595.115.481.131.448.2](d) UK
Figure 3.2: Distribution of PTRs across public primary schools in selected countries
MOZ
IND
PER
UK
0
20
40
60
80
National PTR
7 8 9 10 11
log GDP per capita in PPP (2015)
Figure 3.3: National PTR in public primary education and income across countries
The national PTR in public primary education is defined as the total number of pupils in public primary schools over the total number of teachers in these schools. Since these totals are not available for the ten countries with survey data, these countries are not included in the figure. Marker size indicates the size of the primary school-aged population (ages 5 to 14) in a country. GDP per capita and population data are from the World Bank International Comparison Program database.
to equalize PTRs across schools, this effect is quantitatively small relative to the PTR variation observed in low- and middle-income countries16. Moreover, the relationship between PTR variation and per capita income remains significantly negative when the coefficient of variation is used as an alternative measure of PTR variation17.
Finally, figure 3.5 confirms the earlier observation that there is a long right tail of schools with high PTRs in lower income countries which does not exist in higher income countries. The length of the tail of the distribution is measured by the difference between the 90th and the 50th percentile of the cross-school PTR distribution. The long right tail in many developing countries implies that a lot of children attend schools with few teachers - even in countries where national PTRs in the public
MOZ
IND
PER UK
0
10
20
30
PTR Standard Deviation
7 8 9 10 11
log GDP per capita in PPP (2015)
Figure 3.4: PTR variation in public primary education and income across countries
The PTR standard deviation is defined as the standard deviation in PTRs across all public primary schools within a country. The grey line is a linear regression line. Marker size indicates the size of the primary school-aged population (ages 5 to 14) in a country. GDP per capita and population data are from the World Bank International Comparison Program database.
primary education sector are not extremely high. In India, for example, 34.2% of public primary education pupils attend schools with a PTR above 40 despite a national PTR of 24.9. Across all sample countries with census data, 5.6% of children (about 15 million) are enrolled in schools with PTRs above 80 while this share could be reduced to zero if teachers were more evenly distributed across public primary schools within countries.
MOZ
IND
PER UK
0
20
40
60
PTR 90-50 Difference
7 8 9 10 11
log GDP per capita in PPP (2015)
Figure 3.5: Right tail of the cross-school PTR distribution and income across countries
The PTR 90-50 difference is defined as the difference between the 90th percentile and the median of the PTR distribution across all public primary schools within a country. Marker size indicates the size of the primary school-aged population (ages 5 to 14) in a country. GDP per capita and population data are from the World Bank International Comparison Program database.
of GDP per capita there is a strong negative relationship between per capita income and PTR variation whereas there is hardly any relationship at high income levels.
3.2.2
Fact 2
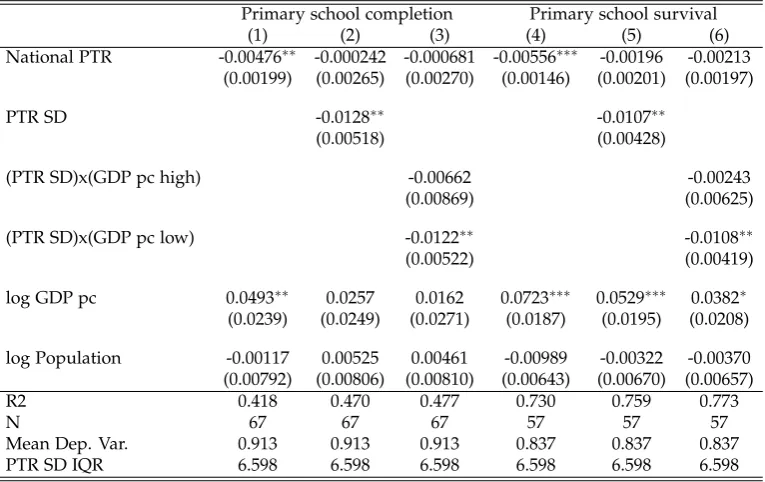
PTR variation is negatively correlated with aggregate education outcomes even after controlling for differences in income and aggregate PTRs.
Figure 3.6: PTR variation in public primary education and income over time across countries
(survival) rate18. Moreover, columns (3) and (6) indicate that the negative partial correlation between the PTR standard deviation and primary schooling outcomes is driven by lower income countries whereas there is no significant correlation for higher income countries.
While these correlations are intriguing, they could entirely be driven by omitted country characteristics, such as institutional quality. To alleviate this concern to a certain extent, I replicate the above cross-country analysis comparing subregions (districts) within specific low-and middle-income countries. This is feasible because a substantial share of PTR variation in developing countries is within subregions. Figure 3.7 shows the spatial variation of PTRs across public primary schools in Zambia. The map indicates areas around schools with high PTRs in increasingly dark shades of red and areas around school with low PTRs with increasingly dark shades of green. It stands out that the heat map is relatively spotty, i.e. there is a lot of variation even within districts. A similar pattern can be observed in other developing countries19. A PTR variance decomposition shows that both between- and within-region and -subregion variation are larger in lower income countries. But while within- and between-variation are of similar magnitude in high-income countries, in lower income countries the within-variation is substantially larger than the between-variation20.
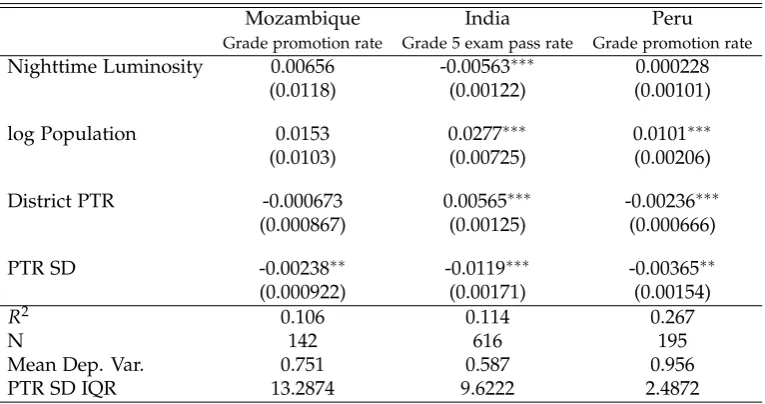
Cross-district regressions in Mozambique, India, and Peru reveal a similar pattern as the above cross-country reression (see table 3.3). In all three countries, there is a significant negative correlation between public primary schooling outcomes and cross-school PTR variation within
18The primary school survival rate is defined as the survival rate until the last
grade of primary education. Outcome variables are from the UNESCO Institute
for Statistics and World Bank International Comparison Program Database. See
http://data.uis.unesco.org/ for details. For each country the most recent available data
as of 06/05/2017 is used. Note that data is not available for all sample countries. In addition, countries with survey data are excluded from the regression because the national aggregate PTR is not available for these countries.
19PTR heat maps from other countries where school coordinates were obtained are
available upon request.
Table 3.2: PTR variation and primary schooling outcomes across countries
Primary school completion Primary school survival
(1) (2) (3) (4) (5) (6)
National PTR -0.00476∗∗ -0.000242 -0.000681 -0.00556∗∗∗ -0.00196 -0.00213 (0.00199) (0.00265) (0.00270) (0.00146) (0.00201) (0.00197)
PTR SD -0.0128∗∗ -0.0107∗∗
(0.00518) (0.00428)
(PTR SD)x(GDP pc high) -0.00662 -0.00243
(0.00869) (0.00625)
(PTR SD)x(GDP pc low) -0.0122∗∗ -0.0108∗∗
(0.00522) (0.00419)
log GDP pc 0.0493∗∗ 0.0257 0.0162 0.0723∗∗∗ 0.0529∗∗∗ 0.0382∗ (0.0239) (0.0249) (0.0271) (0.0187) (0.0195) (0.0208) log Population -0.00117 0.00525 0.00461 -0.00989 -0.00322 -0.00370 (0.00792) (0.00806) (0.00810) (0.00643) (0.00670) (0.00657)
R2 0.418 0.470 0.477 0.730 0.759 0.773
N 67 67 67 57 57 57
Mean Dep. Var. 0.913 0.913 0.913 0.837 0.837 0.837
PTR SD IQR 6.598 6.598 6.598 6.598 6.598 6.598
Standard errors in parentheses
∗p<0.10,∗∗p<0.05,∗∗∗p<0.01
District borders PTR
<20 20-40 40-60 60-80 80-100 >100
Legend 0 100 200 300 km
[image:45.595.154.431.137.368.2]Zambia
Figure 3.7: PTR heat map Zambia
The heat map shows the spatial variation in PTRs across public primary schools in Zambia. The map indicates areas around schools with high PTRs in increasingly dark shades of red and areas around school with low PTRs with increasingly dark shades of green. The map is based on all public primary schools for which school coordinates were available (see table C.4).
districts21, even after controlling for differences in income as proxied by nighttime luminosity, population, and aggregate PTR. In Mozambique an increase in the within-district PTR standard deviation from the 25th to the 75th percentile of the cross-district PTR standard deviation distribution is associated with a 3.2 percentage point decrease in the annual grade promotion rate in public primary education. Over 5 years of primary education, this accumulates to a difference of 14 percentage points in completion rates. In India, the pass rate at the national grade 5 exams in the district at the 75th percentile of the PTR standard deviation distribution is 11.5 percentage points lower than the one of the district at the 25th percentile. And even in Peru where PTR dispersion varies
relatively little across districts and grade completion rates are high, there is a difference in annual grade promotion rates of 0.9 percentage points between the districts at the 75th and the 25th percentile. As in the case of Mozambique, this implies a substantially larger gap in completion rates after 5 years, namely of about 3.8 percentage points.
Table 3.3: PTR variation and public primary schooling outcomes across districts
Mozambique India Peru
Grade promotion rate Grade 5 exam pass rate Grade promotion rate
Nighttime Luminosity 0.00656 -0.00563∗∗∗ 0.000228
(0.0118) (0.00122) (0.00101)
log Population 0.0153 0.0277∗∗∗ 0.0101∗∗∗
(0.0103) (0.00725) (0.00206)
District PTR -0.000673 0.00565∗∗∗ -0.00236∗∗∗
(0.000867) (0.00125) (0.000666)
PTR SD -0.00238∗∗ -0.0119∗∗∗ -0.00365∗∗
(0.000922) (0.00171) (0.00154)
R2 0.106 0.114 0.267
N 142 616 195
Mean Dep. Var. 0.751 0.587 0.956
PTR SD IQR 13.2874 9.6222 2.4872
3.2.3
Fact 3
In low- and lower-middle-income countries, PTRs are larger in remote schools, but remoteness can only explain a small share of overall PTR variation.
To assess to what extent school remoteness can explain variation in PTRs in developing countries, I construct four distinct measures of school remoteness for all schools for which coordinates were obtained:
1. Population density within a circle of 3km radius around the school based on Global Human Settlement (GHS) data
2. Population density within a circle of 3km radius around the school based on data from the Gridded Population of the World (v4)
3. Nighttime luminosity within a circle of 3km radius around the school based on 2015 data from the Earth Observation Group, NOAA National Geophysical Data Center
4. Travel time to closest city based on the accessibility to cities dataset from the Malaria Atlas Project at Oxford University (Weiss et al. 2018)
Figure 3.8 shows kernel density estimates of the PTR distribution by quartile of school remoteness as measured by population density (GHS) in Mozambique22. The figure makes clear how much variation in PTRs there is within each quartile and how little of the variation is explained by remoteness.
To test whether this is also the case in other countries, I run a separate regression of the following form for each country with available school coordinates:
PTRs =αr+βremotes
where αr stands for a set of region fixed effects and remotes for the
remoteness of school s as measured by one of the four measures listed
22Results look very similar for the other three measures of remoteness. See figures
0
.005
.01
.015
.02
.025
Kernel density
0 50 100 150 200 250
PTR
Q1 Q2 Q3 Q4
Figure 3.8: PTR distribution by quartile of population density (GHS) in Mozambique
Population density at each public primary school is measured as the density within a circle of 3km radius around the school according to data from the Global Human Settlement project.
above. Figure 3.9 plots the estimated regression coefficients and the adjusted within-region R2 for each country against per capita income. I find that remoteness is weakly positively correlated with PTRs in developing countries, but it can only explain a very small share of the overall variation in PTRs as indicated by the low R2 in these countries23.
The presented evidence suggests that there could be sizable gains from distributing teachers more equally across schools. Additionally, the fact that a large share of cross-school PTR variation is within subregions means that teacher re-allocation within these could go a long way towards a more balanced distribution. In order to assess how large gains in aggregate education could actually be I proceed by further developing the
23The remoteness measure underlying the figure is population density as given by
VCT FJI KHM URY SSD WSM LCA KNA PRI NLD MNG MHL LTU
LBY ATG CAN
ZMB USA UGA TZA ZAF POL PHL PER PRY PAK NOR NZL MOZ MEX MWI LBR LVA JAM IRL HUN GNB
GTM FRADEU
EST SLV ECUDOM DNK CZE CHL BELAUT GBR -.005 0 .005 .01 beta
7 8 9 10 11
log GDP pc PPP
(a) Regression coefficient
VCT FJI KHM URY SSD WSM LCA KNA PRI NLD MNG MHL LTU LBY CAN ATG ZMB USA UGA TZA ZAF POL PHL PER PRY PAK NOR NZL MOZ MEX MWI LBR LVA JAM IRL HUN GNB GTM DEU FRA EST
SLV ECUDOM DNK CZE CHL BELAUT GBR -.05 0 .05 .1 .15 Adjusted Within-R²
7 8 9 10 11
log GDP pc PPP
[image:49.595.161.441.128.592.2](b) Within-regionR2
Figure 3.9: PTRs and population density (GHS) across countries by income
Beta is the regression coefficient from a country-specific school-level regression of PTR on population density within a circle of 3km around the school as given by Global Human Settlement
data, controlling for region fixed effects. The adjusted within-region R2 is from the same
Chapter 4
Gains from Teacher Reallocation?
Model Calibration and
Simulation
In order to gain an understanding of the potential gains from teacher re-allocation and thereby the extent of current misre-allocation, I simulate three distinct counterfactual scenarios across 20 countries:
1. Smallest achievable maximum PTR rule 2. Optimal allocation
3. Optimal allocation within subnational units
4.1
Model calibration
In chapter 2, the social planner’s problem was formalized as follows:
max
Ts
∑
sPs
∑jPj
h(ts,Qs,Ls)
s.t.
∑
s
wsTs ≤ B
In order to take this framework to the data, two key elements need to be modelled and calibrated:
1. The effect of school-level PTR on grade promotion ∂h
∂PTR(PTRs,Qs,Ls)
2. Relative teacher costswi/wj
Ideally, one would like to understand the precise functional form of
∂h
∂PTR(PTRs,Qs,Ls). As I argue in the next subsection, this is not possible
given the limited available empirical evidence. Therefore, I parameterize the policy function h with two parameters. Additionally, I argue that teacher costs are approximately equal between schools.
4.1.1
The effect of PTR on grade promotion
The school-level PTR is likely to affect pupil achievement through at least three channels. The first and most studied one of these is class size. A smaller number of teachers at a given school is likely to go hand in hand with larger class sizes. The second channel is multigrade teaching. Especially in small schools, a lack of teachers is frequently accompanied by multigrade teachhing. The third channel is instruction time. If the number of teachers in a school is not sufficient, multiple shifts can be introduced to avoid overcrowded classrooms. In such cases, instruction time is reduced as the working time of teachers is distributed across shifts. Below I briefly discuss the available empirical evidence on each of these three channels.
Krueger 1999), others find no significant effects (e.g. Hoxby 2000, Angrist et al. 2017). It also has to be noticed that most studies are based in developed countries where class sizes rarely exceed 40. Therefore, it is unclear in how far their findings apply to developing country settings. The only existing study from a developing country with large class sizes reports small positive effects from class size reductions (Duflo et al. 2015). However, the authors of this study stress the importance of complementary inputs, especially teacher incentives, for the effectiveness of class size reductions.
Evidence on the other two channels is more clear-cut. Evidence on the effects of multi-grade teaching is limited, but the available research suggests that it is harmful to student performance (Checchi & De Paola 2017, Jacob et al. 2008). The literature on the effects of instruction time on pupil performance finds largely positive effects (e.g. Lavy 2015). However, it also points out that magnitudes depend on the quality of instruction and children’s alternative time use (e.g. Rivkin and Schiman 2015)1.
There is only one paper that directly investigates the effect of school-level PTRs on pupil performance. Muralidharan & Sundararaman (2013) conducted a randomized control trial across public primary schools in rural Andhra Pradesh, India. Treatment schools obtained an extra contract teacher. This induced an average PTR reduction by 10.814 (after two years). The authors show that a one unit reduction in PTR led to an increase in standardized test scores by 0.0144 standard deviations. They do not find any evidence of heterogeneous effects with respect to student and household characteristics2.
In order to translate these effects on standardized test scores into effects on grade promotion rates, I assume that test scores are normally distributed. In this case, standardized test scores are standard normally distributed. Given that only pupils with sufficiently high test scores are
1See the literature section Barrios & Bovini (2017) for a short summary of the
literature.
2Chin (2005) also finds positive effects from adding teachers to small schools in India
promoted to the next grade, I parameterize the policy function as follows:
Hs =1−Φ
αs−βPs
Ts
where αs indicates the productivity level of school s and Φ indicates
the standard normal cumulative distribution function. Given the current promotion rate cs and PTR rs as well as β, I back out αs:
αs =Φ−1(1−cs) +βrs
Muralidharan and Sundararaman (2013) estimate the average effect of treatment-induced PTR reduction after one and two years. After one year the effect amounts to 0.0099, after two years to 0.0144. It is unknown whether the effect increases further in subsequent periods. To understand the long-run effects of teacher reallocation, it would be desirable to set
beta to its long-run value. But in absence of empirical evidence, I set β = 0.0144 assuming no further increases in the effect after the second year. Figure 4.1 illustrates the resulting policy functions for a low- and a high-productivity school.
4.1.2
Relative teacher costs
0 50 100 150 200 250
PTR
0 0.1 0.2 0.3 0.4 0.5 0.6 0.7 0.8 0.9 1
Promotion rate
[image:55.595.159.439.125.355.2]High productivity Low productivity
Figure 4.1: Illustration of calibrated policy function
The policy function of the low-productivity school corresponds to the case of a school with a current completion rate of 75% at a PTR of 40. The high-productivity school achieves the same completion rate at a PTR of 80.
I also consider two alternative proxies of teacher costs: actual hardship allowance payments and teacher retention rates. I find that also these can only explain a small share of PTR variation. Figure 4.2 shows the distribution of PTRs by hardship allowance category in Zambia. Teachers working at schools categorized as rural receive a rural hardship allowance that amounts to 20% of their basic salary. At so-called remote schools the allowance is 25%. The figure illustrates that there is substantial variation within each hardship allowance category and a regression of PTR on hardship allowance category confirms that only 9.8% (adjusted R2) of PTR variation can be explained by the allowance category3.
3Results for Mozambique are similar and available in the appendix. See figure D.1.
0
.005
.01
.015
.02
.025
Kernel density
0 50 100 150 200 250
PTR
Urban Rural Remote
Figure 4.2: Distribution of PTRs by hardship allowance category in Zambia
Data sources: Education Management Information System, Ministry of General Education, Zambia (2014) and government payroll system, Public Service Management Division, Zambia (2014).
The second alternative proxy, teacher retention rates, explains even less of the overall PTR variation in Zambia as shown in figure 4.3. It can only explain 1.3% (adjusted R2)4.
4Results for Uganda are similar and available in the appendix. See figure D.2. Data
0
.005
.01
.015
.02
Kernel density
0 50 100 150 200 250
PTR
Q1 Q2 Q3 Q4
Figure 4.3: Distribution of PTRs by quartile of teacher retention rates in Zambia
Data source: Education Management Information System, Ministry of General Education, Zambia (2015).
4.2
Simulations
4.2.1
Model for simulations
The model resulting from the calibration described in the previous section can be summarized as follows:
max
Ts
∑
sPs
∑jPj
Hs(Ts)
subject to
Hs =1−Φ
Φ−1(1−c s) +β
rs− Ps
Ts
∑
s
Ts =T¯
This is the model used for simulation. The notation is the same as in chapter 2. ¯T stands for the total number of teachers. Notice that the model requires that every school is allocated at least one teacher.
4.2.2
Data for simulations
[image:58.595.110.488.424.729.2]To simulate the effect of alternative teacher distributions on grade promotion in public primary schools, I construct measures of grade promotion for 20 countries. I do not observe grade promotion itself in all countries. In some countries, I only observe the grade repetition rate and in others only the pass rate at a national primary school exam. In the former case, I assume dropout is zero and compute grade promotion as one minus the grade repetition rate. In the latter case, I assume that the grade promotion rate equals the exam pass rate. Table 4.1 gives an overview of the data.
Table 4.1: Measure of grade promotion by country
Country Measure of grade promotion Missing data
Argentina Grade promotion rate <1%
Cambodia Grade promotion rate 6%
Cape Verde 1-grade repetition rate 7%
Chile Grade promotion rate <1%
Colombia Grade promotion rate 14%
Djibouti 1-grade repetition rate 0%
El Salvador Grade promotion rate 0%
Guinea-Bissau Grade promotion rate 0%
Honduras 1-grade repetition rate 0%
India National lower PSLE pass rate 34%
Laos 1-grade repetition rate 0%
Malawi Grade promotion rate <1%
Mozambique Grade promotion rate 3%
Peru Grade promotion rate 0%
Table 4.1: Measure of grade promotion by country
Country Measure of grade promotion Missing data
Saint Vincent 1-grade repetition rate 0% Sweden National grade 6 examination pass rate 50%
Tanzania National PSLE pass rate 4%
UK (England) National grade 6 examination pass rate 14%
Zambia Grade promotion rate <1%
This table lists the measure of grade promotion used in each of the 20 simulation countries. PSLE stands for Primary School Leaving Examination. The third column (missing data) indicates the share of public primary schools for which the measure was not available. Reasons for missing data are country specific.
4.2.3
Smallest achievable maximum PTR rule
In many countries the allocation of teachers to schools is rule-based. These rules can be internal guidelines of Ministries of Education or formal laws. Typically they set a maximum school-level PTR that cannot be exceeded at any school (e.g. Right to Education Act in India) or a maximum class size (e.g. Malmonides’ rule in Israel).
In this subsection, I simulate the distribution of teachers under the smallest achievable maximum PTR rule in each country. First, I compute the smallest threshold x that can be satisfied given the current stock of teachers and the distribution of enrolment across schools such that the PTR does not exceed x at any school. Then, I distribute teachers based on this allocation rule. Finally, I estimate the aggregate promotion gains from this counterfactual distribution using the policy function displayed in subsection 4.2.1.
0
10
20
30
40
50
PTR
0 200 400 600 800 1000
Number of pupils
Max PTR 25 Max PTR 50
Figure 4.4: Maximum PTR rule under small and large teacher stock
paribus PTR variation will be larger than in the first case. It is evident that PTR variation mechanically depends on the overall stock of teachers and the school size (enrolment) distribution when a maximum PTR rule is used to allocate teachers. In this case, PTR variation is larger in countries with higher aggregate PTRs and smaller schools.
Figure 4.5 shows the actual and the counterfactual PTR distribution in the four example countries. It can be observed that counterfactual PTR variation is substantially smaller than actual variation in Mozambique and India, but relatively close to actual variation in Peru and the UK. At the same time, counterfactual variation is larger in the former two than in the latter two countries. This pattern is borne out across all sample countries as illustrated by the actual and counterfactual PTR standard deviations displayed in figure 4.6.
0
.05
.1
.15
Kernel density
0 50 100 150 200 250
Pupil-Teacher Ratio
Actual Counterfactual