2017 2nd International Conference on Information Technology and Industrial Automation (ICITIA 2017) ISBN: 978-1-60595-469-1
Statistical Analysis of the User Viewing Pay
Channels Behavior Based on RFML Model
Yan Jin, Yunpeng Chen, Jingjing Han and Yan Wang
ABSTRACT
Based on the two-way digital cable set-top box return real-time data acquisition, pay channels on Xi'an 27966 users viewing data and analyze the users’ data. First of all, pay channels to build RFML model user viewing behavior. Then, using descriptive statistical analysis and RFM model to analyze and build the user behavior index calculation model. Finally, according to the analysis results, the study could give the conclusion that the score of CCTV the first theatre channel is highest and the Laughter theatre channel and charming music channel have the lowest score.
INTRODUCTION
With the rapid development of digital cable TV, premium channels constantly enrich the content. Pay channels from 2004 to 2011 have the development of a dozen sets of 130 or more. At the same time, the number of users has grown from premium channels over 30 thousand to more than 900 million [1]. Pay channels combined scheme will directly affect customer satisfaction and the company's earnings. Scientific and reasonable pay channel package needs to consider the user viewing behavior, user group characteristics, program characteristics and attributes. Two-way digital cable set-top boxes achieve a network-wide real-time acquisition of data and large user ratings return for a comprehensive analysis of user behavior to provide effective support and analysis of data. In this study, we use some methods to study the policy premium channel package [2]. Throughout the study in three parts: First, the user viewing pay channels based data, using descriptive statistical analysis and RFM models and other methods to analyze and model the user viewing behavior index calculation. Secondly, backpack model theory and data indicators, build a RFML model to analyze the data of users viewing behavior. Finally, results of the pay channels for the results of CCTV channels’ scores.
________________________
Researchers on the pay channel promotional combinatorial optimization are fresh for rare confined to the domestic marketing range based on a sample survey and foreign study focused on user behavior analysis model including McCarthy model, Kotler model and the RFM model [3], of which the most widely used RFM.
MODEL
RFML Model Introduction
RFM analysis method is a widely used method in the market of product response and value analysis. Its analysis mainly based on three important indicators, which refers to the ‘the last time of products purchasing’ R, ‘product purchasing number/frequency’ F and ‘the total amount of the product consumption’ M [4].
Introduction of the three important indicators:
R: the user who buys products more lately has more possibility to buy again than those who buy long before.
F: Over a period of time, the user who buys more (frequency) has more possibility to buy again than those who buy fewer.
M: The user who spends more on purchasing has more possibility to buy again than those who spend less.
Because TV users’ behavior and common goods customer behavior is not exactly the same, it is necessary to consider the viewing time L based on the RFM customer analysis mode [5], that is, our research analyses four dimension index R (recently viewing time index), F (watching frequency index), M (consumption amount index) and L (watching duration index) according to original ratings library data analysis. Total index RFML can reflect not only the TV viewing behavior characteristic, but also the value of each user to each paid channel.
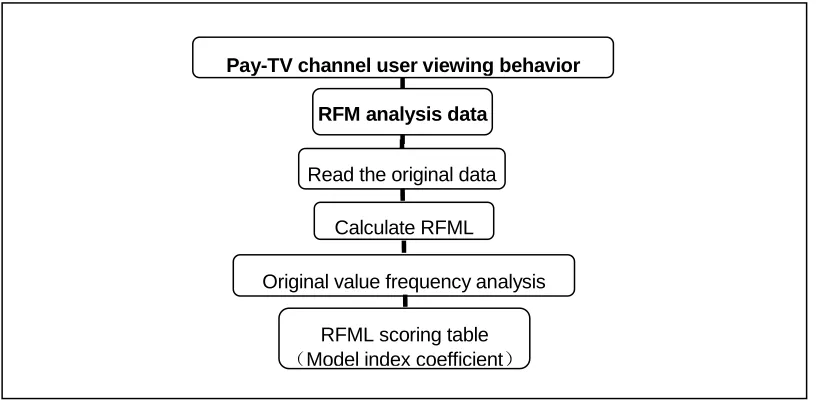
Research Framework
Pay-TV channel user viewing behavior analysis
RFM analysis data
Read the original data
Calculate RFML value
Original value frequency analysis
[image:2.612.95.504.482.684.2]TABLE I. RECENT VIEWING TIME INDEX SCORING CRITERIA.
R score Recent viewing time User level Number of users
1 20140115 00:00:21~20140124 00
:04:45 Extreme inactive TV users 20%
2 20140124 00:04:45~20140131 22
:57:52 Less active TV users 20%
3 20140131 22:57:52~20140206 13
:10:19 Ordinary active TV users 20%
4 20140206 13:10:19~20140211 17
:55:13 More active TV users 20%
5 20140211 17:55:13~20140215 23
:56:24 Extreme active TV users 20%
The research framework figure is shown in Figure 1.
RESULTS AND DISCUSSION
TV Users Viewing Behavior Index Based on RFML Model
Based on RFML model data and SAS [6][7], the scoring results of the recent viewing time are in TABLE I, frequency in TABLE II, transaction money in TABLE III, length in TABLE IV.
For the TABLE I, it could easily found that there are 5 score-levels and 5 user levels. The recent viewing time between 00:00:21~00:04:45 is extreme inactive TV users who account 20% to all users. The recent viewing time between 17:55:13~23:56:24 is the closing time of most TV users, that users are defined as extreme active TV users.
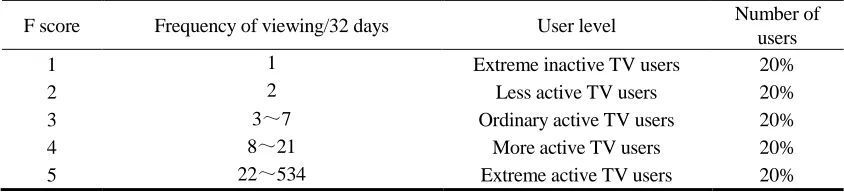
For the TABLE II, frequency of viewing index scoring criteria, it could easily found that there are 5 levels of frequency of viewing every 32 days. And corresponding to the 5 levels, it has 5 TV users’ levels: extreme inactive TV users, less active TV users, ordinary active TV users, more active TV users and extreme active TV users.
Pay-TV Channels’ Situation of Viewing
TABLE II. FREQUENCY OF VIEWING INDEX SCORING CRITERIA.
[image:3.612.86.508.570.666.2]TABLE III. TRANSACTION MONEY INDEX SCORING CRITERIA.
M score Transaction money (RMB/month) User level Number of users 1 5 Extreme inactive TV users 20% 2 8 Less active TV users 20% 3 10,15 Ordinary active TV users 20% 4 38,50 More active TV users 20% 5 80,188 Extreme active TV users 20%
Output datetime format data in best12 format to calculate RFML value. There are 42 Independent RFML value data sets for each program. Calculate to get RFML scoring table, with 27966 samples and 42 variables.
RFML main index = 2R+F+M+2L.
RFML main index weighted by the importance of R, F, M and L, which shows the TV users viewing behavior.
For TV users, recent viewing time index and total length of viewing index (R and L) better reflect users’ enthusiasm for this channel. Without time guarantee, frequency has little effect. Because only use the data of the price of pay-TV channel, the amount of consumption accounted for a small part in total score. Get the RFML mean score of each premium channels by SPSS frequency analysis, it is shown in TABLE V.
It could be found that there are 42 channels and their mean scores. For this, the results of TV users viewing behavior index based on RFML model could be analyzed, meantime, the Pay-TV channels’ situation of viewing could be shown clearly.
For the overall analysis of the index, the RFML mean scores of 42 channels are quite small. The score of CCTV the first theatre channel is highest (5.99 points).
The lowest score is Laughter theatre channel and charming music channel (0.3 points). Among 42 pay-TV channels, 23 channels’ scores are less than 1 point, and only 4 channels’ scores are more than 3 points. Generally, the situation of viewing of pay-TV channels is poor, compared to 30 points, the total index RFML full marks.
TABLE IV. LENGTH OF VIEWING INDEX SCORING CRITERIA.
[image:4.612.86.508.501.595.2]TABLE V. RFML MEAN SCORES OF EACH CHANNELS.
Channel Mean score Channel Mean score CCTV the first theatre 5.99 Happy fishing 0.97 CCTV fengyun theatre 4.76 DOXTV 0.95
CCTV nostalgic theatre 4.08 CCTV national defense
military 0.91 CCTV fengyun football 3.22 Baby family 0.88 CCTV culture high-quality
goods 2.74 English tutoring 0.73 CCTV fengyun music 2.24 Chniese cuisine 0.68 CCTV old story 2.15 Yoyo baby 0.65 CCTV travel of discover 1.96 Global tourism 0.62 Liyuan 1.77 World wonders 0.59 Vanguard records 1.74 CCTV billiards 0.58 The exam online 1.45 Tianyuan go 0.57 Car fans 1.36 Game wind and cloud 0.22 New entertainment 1.35 Anime show 0.2
Basketball 1.23 Explosive sports 0.14 The calligraphy and painting 1.21 The city theatre 0.13
CCTV world geography 1.07 Dongfang finance and
economics 0.12 The four seas fishing 1.06 Colorful drama 0.12 European football 1.03 The lifestyle 0.05 Pioneer pingyu 1.01 the law world 0.04 The documentary 0.99 Laughter theatre 0.03 Photography 0.98 Charming music 0.03
REFERENCES
1. Zhao Fei. 2011. “The development of Chinese digital pay TV channel research”. Shandong: Shandong University, 2003-2010.
2. Sun Liang, Guan Na. 2007. “Premium channel packaging and marketing strategy research”.
Radio and television information, (10).
3. Zhao Xiaoyu, Huang Xiaoyuan, Sun Fuquan.2005. “Promotion mix strategy based on RFM analysis optimization model”. Chinese management science.
4. Klaus Backhaus. 2009. Multivariate statistical analysis methods: using SPSS tools.Shanghai People's Press, pp. 22-34.
5. Wang Xiaoyin, Zhou Baoping. 2010. Mathematical modeling and mathematical experiment. Beijing: Science Press, pp.33-46.
6. Huixin Ke, Hao Shen. 2005. Statistical Analysis Method in the Investigation. Communication University of China Press, pp. 193-220.