© 2015, IRJET ISO 9001:2008 Certified Journal Page 440
PLACING AND SIZING OF DG IN RADIAL DISTRIBUTION SYSTEM AND
IDENTIFYING FAULT LOCATION IN DISTRIBUTION SYSTEM
INTEGRATED WITH DISTRIBUTED GENERATION
K.Divya
1, S.Srinivasan
21PG student, Department of Electrical and Electronics engineering, K.S.Rangasamy College of Technology,
Tamilnadu, india
2Associate Professor, Department of Electrical and Electronics Engineering, K.S.Rangasamy College of Technology,
Tamilnadu, india
---***---Abstract
— The Distribution Companies (DISCOs)encourage the electricity market by introducing Distributed Generators (DGs) as the ancillary service for its significant benefits in loss reduction. The major issue in this process is the selection of appropriate size and location of DG in improving the performance of distribution systems. This means that the improper sizing and placing may reverse the beneficial factor of DG. Thus, the paper is proposed with a methodology to determine the optimal size and location of DG with an objective of reducing energy loss. The major contribution of this paper revolves with identifying location for DG based on Voltage Stability Index (VSI), impact of placing DG with random size in locations identified by VSI, identifying optimal DG size with feasible location using Particle Swarm Optimization (PSO) algorithm. Faults in the power distribution systems are considered to be the main contributor to the supply interruption and are responsible for poor service continuity indices. A methodology based on IMPEDANCE-BASED METHOD is presented for exact fault location. This proposed technique is tested and verified on IEEE 12 bus Radial Distribution System (RDS). The result shows the substantial reduction of total energy and importance of identifying optimal size and location for placing DG and also identifies the exact fault location.
Keywords—Distributed Generation (DG), Optimal
Placement, Particle Swarm Optimization (PSO), Radial Distribution System (RDS), Fault Location (FL).
1. INTRODUCTION
Distribution Systems can be defined as the sequential flow of procedures, systems, and activities which are designed and linked to facilitate and monitor the movement of goods and services from the source to the consumer. Essentially, distribution is about making products and services available to the end user when and where they need them. The main function of an electrical power distribution system is to provide power to individual consumer premises. Distribution of electric power to different consumers is done with much low voltage level. Distribution of electric power is done by distribution networks [1].
© 2015, IRJET ISO 9001:2008 Certified Journal Page 441 demand centre. This type of generation system is
known as Distributed Generation (DG)[3]-[4].
DG are small scale power generating generators (typically say 10 kW to 10000 kW), that are connected near to the load. With the increasing penetration of wind power, photovoltaic power generation and other renewable energy technologies, distributed generation (DG) technology. In order to improve the network benefits and reliability, the location and size of DGs need to be planned optimally in the planning [8]-[10].
The deregulation and privatization of power systems have forced electrical utilities to keep the supply and the service continuity indices within the required standards, albeit credible fault and contingencies continue to happen. Faults in power distribution systems are considered the main contributor to the supply interruption and responsible for poor service continuity indices [11]-[12]. The most effective way to improve these indices is by employing efficient Fault Location (FL) techniques that can minimize the inspection and service restoration times, and thus, reduce outage time and improve the service continuity [2]. Moreover, locating temporary fault can also help in preventing future permanent fault that could bring more damage to equipment [6]-[7].
In This paper, the optimal sizing and sitting of DG and identification of fault location is discussed. Proposed techniques for optimal siting are covered in Section 2. Proposed techniques for optimal sizing are covered in Section 3. Proposed techniques for exact fault location 4. Analysis of results in 5.
2. PROPOSED PSO TECHNIQUES: SITING OF DG There are several issues concerning the integration of DGs with existing power system networks. The integration of DG changes the system from passive to active networks, which affects the reliability and operation of a power system network. Furthermore, the non-optimal placement of DG can result in an increase of the system losses and thus making the voltage profile lower than the allowable limit. Since
utilities are already facing technical and non-technical issues, they cannot tolerate such additional issues. Hence an optimum placement of DG is needed in order to minimize overall system losses and therefore improve voltage profiles
2.1 Basic Concept of PSO
PSO is a robust stochastic optimization technique based on the movement and intelligence of swarm. It simulates the behaviors of bird flocking and fish schooling. Naturally, a flock of animals don’t have any leaders in their group or swarm for searching food source. So, they randomly follow one of the members of the group that has closest position with a food source. The bird who reached its better solution will inform others, to follow that particular direction in order to get its solution optimally. Each particle is treated as a point in a in the N-dimensional search space by changing its velocity according to own flying experience and experience from the neighboring particles. PSO belongs to the class of swarm intelligence techniques that are used to solve optimization problems.
Each particle keeps track of its coordinates in the solution space which are associated with the best solution (fitness) that has achieved so far by that particle. This value is called personal best or Pbest.
Another best value that is tracked by the PSO is that best value obtained so far by any particle in the neighborhood of that particle. This value is called global best or Gbest. The Gbestvalue only changes when
any particle’s Pbest value comes closer to the target
than current Gbest. Through the iteration of the
algorithm, Gbest gradually moves closer and closer to
the target until one of the particles reaches the target.
2.2 Parameter Selection in PSO
There are two parameters to be selected in PSO. They are, inertia weight and acceleration constant.
© 2015, IRJET ISO 9001:2008 Certified Journal Page 442 inertia weighting function leads to greater search
ability. Hence, a suitable selection of inertia weighting is important. Therefore, it is wise to choose large weight factor for initial iterations and gradually reduce weight factor in successive iterations. This can be done by using,
iter
iter
w
w
w
w
max min max
max (1)
ACCELERATION CONSTANT: The constants C1 and C2
represent the weighing factor and are turned in the process. The constants are the acceleration terms that pull each particle towards the Pbest and Gbest.
2.3 Flowchart
Basically PSO applies the concept of social interaction to the problem solving techniques. It might sound complicated, but it’s really a simple algorithm to implement. In PSO each individual makes his decision using his own experience together with other individuals.
Fig.1: Flowchart for Proposed PSO Technique
3. PROPOSED VSI TECHNIQUES: SIZING OF DG Power flow or load flow studies are performed for the determination of the steady state operating condition of a power system. This is the most frequently carried out study by power utilities and is required to be performed for power system planning, operation, optimization and control.
Listed below summarize major steps of the proposed solution algorithm with appropriate equations.
1) Assume rated voltages at end nodes only for 1st iteration and equals the value computed in the forward sweep in the subsequent iteration.
2) Start with end node and compute the node current using equation (2). Apply the KCL to determine the current flowing from node i towards node i+1 using equation (3), start from end nodes.
(2)
(3)
3).Compute with this current the voltage at ith node
using equation (4). Continue this step till the junction node is reached. At junction node the voltage computed is stored.
(4)
(4.4)
4) Start with another end node of the system and compute voltage and current as in step 2 and 3.
5) Compute with the most recent voltage at junction node, the current using equation (1).
*
)
(
i i i
V
S
I
1 )
1 ,
(ii
I
i
I
iI
) 1 , ( ) 1 , (
1
*
i ii iii
V
I
Z
© 2015, IRJET ISO 9001:2008 Certified Journal Page 443 6) Similarly compute till the reference node.
7) Compare the calculated magnitude of the rated voltage at reference node with specified source voltage.
3.1 Flowchart
This method includes two steps: the backward sweep and the forward sweep. In backward sweep, voltage and currents are computed using KVL and KCL from the farthest node from the source node. In forward sweep, the downstream voltage is calculated starting from source node.
Fig.2: Flowchart for Proposed VSI Technique
The input data of this algorithm is given by node-branch oriented data.
3.2 Voltage Stability Index
VSI is used to find the optimal location of DG in distribution system using formula
(5)
(4.Where, X=Reactance between line.
PR=Real power at receiving end.
QR=Reactive power at receiving end.
VS=Voltage at sending end.
Under normal operating conditions, VSI value should be less than unity. If the value of VSI is closer to zero, then the system will be more stable. If the value of VSI is high, then the system is vulnerable to stability.
4. PROPOSED IMPEDANCE-BASED METHOD: FAULT LOCATION
The deregulation and privatization of power systems have forced electrical utilities to keep the supply and the service continuity indices within the required standards, albeit credible fault and contingencies continue to happen. Faults in power distribution systems are considered the main contributor to the supply interruption and responsible for poor service continuity indices. The most effective way to improve these indices is by employing efficient Fault Location (FL) techniques that can minimize the inspection and service restoration times.
4.1 Fault Location Equation
Consider a simple distribution system with DG units, as shown in Figure 3, which shows a faulty line
RR R
S
Q
Q
P
V
X
VSI
2
2
© 2015, IRJET ISO 9001:2008 Certified Journal Page 444 section between buses i and j. The fault at point F can
be of any possible shunt fault type.
[VF ] [d( ) ][Vs p ] [b( ) ][I s p]
(6)
where;
[d( ) ] [U ] 0.5 2[Z ][Ysh ] (7)
[b( ) ][Z ] (8)
[Z ] line series impedance matrix (in ohms)
[Ysh ] line shunt admittance matrix (in ohms-1)
[U ] 3×3 unit matrix.
per-unit fault distance
Equation (4) represents a general FL equation that can be used for all possible shunt fault types in a three-phase, two- phase and single-phase distribution line section.
Fig.3: Simple Distribution System with DG
X0 X1 X 2 2 0 (9) X 0 Im{[Vs p ]t [ I F ]} (10)
X 1 Im{[ I s p ]t [Z ][I F ]} (11)
X 2 Im{0.5 [Vs p ]t [Z ][Ysh ][ I F ]} (12)
Moreover, shunt fault types can be single-fault types such as a single- phase-to-ground, phase-to-phase, double-phase-to-ground, three-phase and three-phase-to-ground faults, or compound-fault types such as a single-phase-to-ground fault combined.
4.2 Voltage and Current Estimation
The sending-end voltages of the line section-k can then be calculated using (5.15):
[V ]i [d(1) ][Vs ]u [b(1) ][I s ]u (13) [Vs ]k [T ]k [V ]i (14) [ I s ]k [T ]k ([d(1) ][ I s ]u [C(1) ][Vs ]u [Z d ]i [Vi ] [ I G ]i [Z d ]i (15)
Equations (14) and (15) are used to estimate the voltages and currents at the sending-end of the line section-k, respectively.
4.3 Impedance Based Fault Location Algorithm Step 1) Start from the first line section (k = 1).
Step 2) If k 1, determine the sending end voltage and current of the kth line section using (14) and (15), respectively.
Step 3) Determine an initial fault current using (1):
[I F ] [I s p ] [I s p ] (16)
where [Is-p] and [I′s-p] are the measured currents at the sending- end of the segment-p during the fault and before the fault, respectively.
Step 4) Solve the FL equation to determine the per-unit fault distances (1) and () respectively, using (17) and (18):
© 2015, IRJET ISO 9001:2008 Certified Journal Page 445 (18)
Where,
X0, X1 and X2 are determined by using (9), (10) and (11), respectively.
Step 5) Check the convergence of1 andby using (19) and (20) , respectively:
1(i)1(i 1) (19)
2 (i) 2 (i 1)
(20)
Where δ and i are a threshold value and the iteration number, respectively.
Step 6) If1 and converge, go to step 7. Otherwise, update the fault current by using the determined per- unit fault distances (1 ) and (), respectively, in (18), and return to Step 4.
Step 7) If1 oris not within the analyzed line section length, go to Step 8. Otherwise, save the correct per- unit fault distance and save the corresponding fault current and the number of analyzed line section.
Step 8) If the analyzed section is not the last section, update k (k = k +1) and return to Step 2.
Step 9) If multiple candidate locations are obtained, determine the exact fault.
5. ANALYSIS OF RESULTS
MATLAB (MATrixLABoratory) is an interactive system for numerical computation. Numerical analysis Clever Moler wrote the initial FORTRAN version of MATLAB in the laten 1970s as a teaching aid. It becomes for both teaching, research, and
evolved into a commercial software package written in C. For many years now, MATLAB has been widely used in universities. MATLAB has several advantages over more traditional means of numerical computing.
5.1 IEEE-12 Bus System Data
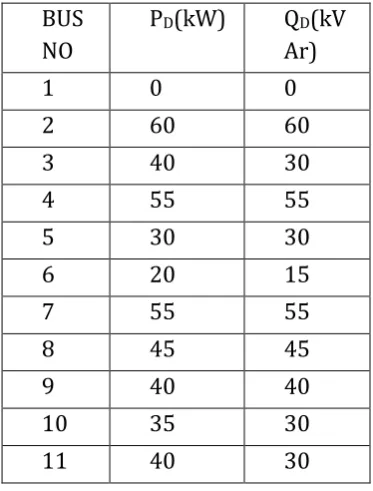
The bus data and line data for 12-bus Radial distribution system is given. Figure 4 shows thee single line diagram for 12 bus radial distribution system. The Table 1 describes the bus data for 12-bus radial distribution system.
[image:6.595.318.525.288.345.2]Fig.4: 12-Bus Radial Distribution System
Table .1: Bus Data for 12-Bus Radial Distribution System
BUS
NO
P
D(kW)
Q
D(kV
Ar)
1
0
0
2
60
60
3
40
30
4
55
55
5
30
30
6
20
15
7
55
55
8
45
45
9
40
40
10
35
30
[image:6.595.348.535.463.709.2]© 2015, IRJET ISO 9001:2008 Certified Journal Page 446 The fault location, optimal location and size of the DG
for a radial distribution system is identified by programming in MATLAB 13.0 environment.
5.2 Optimal Placement and Sizing of DG
The 12 bus RDS test system has a base of100 MVA and 11 kV.
0.9 0.95 1 1.05
1 5 9
vol
ta
ge
in
p.
u
Bus
without dg
Fig.5: Voltage Profile(p.u) in 12 Bus System
-500 -400 -300 -200 -100 0
1 3 5 7 9 11
po
w
e
r
in
kw
branches
reactive power flow
Fig.6: Reactive Power Flow in 12 Bus System
0 1 2 3 4 5
1 3 5 7 9 11
po
w
e
r
in
kw
branches
real power loss
Fig.7: Real Power Loss in 12 Bus System
0 0.002 0.004 0.006
2 4 6 8 10 12
V
SI
Bus
VSI
Fig.8: VSI Value of 12 Bus System
In base case load flow without installation of DG, real and reactive power injected from the substation is 455.7135 kW and 413.041 KVAr respectively, whereas thereal and reactive power losses are 20.7135 kW and 8.041KVAr respectively.
5.3 Power loss convergence graph obtained by PSO technique for 3 senstivity bus:
© 2015, IRJET ISO 9001:2008 Certified Journal Page 447 Fig.9: Power Loss Covergence Graph for DG at 9th Bus
Fig.10: Power Loss Covergence Graph for DG at 8th Bus
Fig.11: Power Loss Covergence Graph for DG at 4th Bus
From Figure 9 it has been shown that power loss is reduced to 10.82 kW at iteration no 4.while placing a DG at 2nd highest senstivity bus.From Figure 10 it has been shown that power loss is reduced to 14.664
kW at iteration no 4 while placing a DG at 3rd highest senstivity bus.
5.4 Fault Location
The simulation is carried out by using impedance-based method. Under no fault condition the values obtained are shown below
NO Fault occured: 0.8653
NO Fault occured: 0.9410
NO Fault occured: 1.1520
NO Fault occured: 0.3418
NO Fault occured: 0.2833
The simulation is carried out by using impedance-based method. Under fault condition the values obtained are:
NO Fault occured: 0.8653
NO Fault occured: 0.9410
NO Fault occured: 1.1520
NO Fault occured: 0.3418
NO Fault occured: 0.2833
NO Fault occured: 0.7718
NO Fault occured: 0.6188
NO Fault occured: 0.1454
NO Fault occured in bus no: 9 19.532
NO Fault occured: 0.0276
NO Fault occured: in bus no: 9 12.473
NO Fault occured: 0.0276
© 2015, IRJET ISO 9001:2008 Certified Journal Page 448 6. CONCLUSION
This research work provides a methodology for optimal placement and sizing of DG in radial distribution system using VSI and PSO technique. The result of this study is compared for top three sensitivity buses identified by VSI and it is proved that the bus with higher VSI is the optimal location for DG. Therefore, the proposed method provides a feasible solution for improving the performance of electricity network in the distribution system. Further, the proposed work is extended for future load power increase and for placement of DG capable of supplying both real and reactive power. The major advantage in this method is that the power loss is reduced. Using impedance-based method the exact fault location is identified. This scheme identifies the FL using two steps. In the first step, a new impedance-based method is utilized to identify all possible fault locations using a novel FL equation, which is applicable for all single and compound faults types. The balanced and unbalanced laterals and the capacitive effect of distribution line are also considered. In the second step, the exact FL among the multiple candidate locations is determined based on matching the measured voltage at the substation bus and each DG unit bus with calculated ones. The new formulation overcomes the requirement of fault type identification by using only one fault location equation. This technique is carried out and tested in 12-bus Radial Distribution System (RDS).
REFERENCES
[1] Basics of DG connected with distribution system [online], Available: http://europa.eu.int/eur-lex, https://en.m.wikipedia.org.
[2] Biswarup Das (2006) “Fuzzy Logic-Based Fault- Type Identification in Unbalanced Radial Power Distribution System” IEEE Power Delivery, Vol. 21, Iss. 1, pp. 278-285.
[3] Dias B. H., L. W. Oliveira, F. V. Gomes, I. C. Silva Junior, E. J. Oliveira (2012) “Hybrid
Heuristic Optimization Approach for Optimal
Distributed Placement and Sizing” IEEE Transactions On Power Delivery, pp. 1-6.
[4] Gianni Celli, Emilio Ghiani, Susanna Mocci, Fabrizio Pilo (2005) “A Multi objective Evolutionary Algorithm for the Sizing and Siting of Distributed Generation”
IEEE Transactions On Power Systems, Vol. 20, Iss.2, pp.750-757.
[5] Grainger J. J., and W. D. Stevenson, Power system analysis. New York: McGraw-Hill,
1994.
[6] Hadi Zayandehroodi, Azah Mohamed, Hussain Shareef, Marjan Mohammadjafari (2011) “Determining Exact Fault Location in a Distribution Network in Presence of DGs Using RBF Neural Networks” IEEE IRI, Vol. 50, pp. 434- 438.
[7] Javadian S.A.M., A.M. Nasrabadi, M.-R. Haghifam, J. Rezvantalab (2009) “Determining Fault’s Type and Accurate Location in Distribution Systems with DG Using MLP Neural
Networks” IEEE Transactions On Power Delivery, pp. 284- 289.
[8] Ke-yan Liu, Wanxing Sheng, Yuan Liu, Xiaoli Meng, Yongmei Liu (2015) “Optimal sitting and sizing of DGs in distribution system
considering time sequence characteristics of loads and DGs” Electrical Power and Energy Systems, Vol. 69, pp. 430–440.
[9] Sevya Naik Gopiya Naik, Dheeraj Kumar Khatod, Mahendra Pal Sharma (2015) “Analytical approach for optimal siting and sizing of distributed generation in radial distribution networks” IET Generation, Transmission & Distribution, Vol. 9, Iss. 3, pp. 209–220.
© 2015, IRJET ISO 9001:2008 Certified Journal Page 449 swam optimization for optimal DG location and
sizing in distribution systems” Electrical Power and Energy Systems, Vol. 34, pp.66-74.
[11] Sukumar M. Brahma (2011) “Fault Location in Power Distribution System With Penetration of Distributed Generation” IEEE Transactions On Power Delivery, Vol. 26, Iss. 3, pp. 1545– 1553.
[12] Mora-Florez J., J. Melendez, G. Carrillo- Caicedo (2008) “Comparison of impedance based fault location methods for power