A Monthly Double-Blind Peer Reviewed Refereed Open Access International e-Journal - Included in the International Serial Directories.
International Research Journal of Natural and Applied Sciences (IRJNAS) ISSN: (2349-4077)
99 | P a g e International Research Journal of Natural and Applied Sciences Vol. 2, Issue 10, Oct 2015 IF- 2.818 ISSN: (2349-4077)
© Associated Asia Research Foundation (AARF)
Website: www.aarf.asia Email : [email protected] , [email protected]
ASSESSMENT OF DYNAMIC MORPHOLOGICAL IMPACT ON
BALARI BAR USING GEOINFORMATICS
Subhanil Guha1 , Anindita Dey2 1
Department of Geography, Dinabandhu Andrews College, Kolkata, West Bengal 2
Assistant Teacher, Nazrul Balika Vidyalaya, Guma, West Bengal
ABSTRACT
Balari Bar of Hugli estuary, located in the north-east of the Nayachara Island is one
of the important geomorphological features at the northern extent of the Bay of Bengal. It is a
small land, have accreted from the unconsolidated alluvium. Because of the proximity to the
coast, it is vulnerable to the tidal effects. During the last few years it has gained some
landmass due to heavy deposition. The present study has analyzed the erosional as well as
the depositional changes in and around the Balari Bar through a series of multi-temporal
satellite images. IRS 1C 28/11/99, IRS 1C 27/03/2000, IRS 1D 19/02/2001, IRS P6
20/11/2005 and IRS P6 28/02/2008 satellite imageries have been used for the present study.
The final result shows that the land area of the study is gradually increasing which depicts
that heavy deposition has been taken place during the recent years.
KEYWORDS: ALLUVIUM, ESTUARY, MULTI-TEMPORAL, TIDAL, VULNERABLE
INTRODUCTION
The Hugly estuary being a highly dynamic zone requires continuous monitoring and
updated information. Traditional methods are time-consuming and involves lots of manpower
and cost. Satellite image interpretation has the capability to monitor this dynamic
environment and record changes. The gradually increasing study area is located in the West
Bengal state covering parts of Purba Medinipur and South 24 Parganas districts. The
latitudinal extent of the study area is from 22001'00" North to 22005'00" North and
longitudinal extent of the study area is from 88007'00" East to 88011'00" East.
Several works have been done earlier on this context. An assessment was made on
A Monthly Double-Blind Peer Reviewed Refereed Open Access International e-Journal - Included in the International Serial Directories.
International Research Journal of Natural and Applied Sciences (IRJNAS) ISSN: (2349-4077)
100 | P a g e An estimation was done on the erosional action of the coast of Sagar Island [2]. A research
was performed on space and time related changes of land surface parameters in the Red river
of the north basin [3]. Apart from these, an evaluation was made on the coastal erosion due to
wave dynamics operative in Sundarban delta [4]. Moreover, Landsat TM data was used in
order to design coastal morphological mapping around the Gulf of Khambhat [5].
GENERAL DESCRIPTION OF THE STUDY AREA
Balari Bar is situated almost in the middle part of the river Hugli, virtually divides the
river into two sub-channels. In the early phase of eighties, the Jellingham-Haldia channel was
navigable up to the Kolkata Dock. But because of the reduced flow, sediments started getting
deposited further up stream instead of compensating erosion in the sea-facing islands. As the
riverbed at Balari became gradually more shallow, the main downward flow of the river
captured the Rangafalla channel on the eastern side of Nayachara, thereby eroding the islands
of Lohachara, Bedford and Ghoramara. The details regarding the depositional growth of
Balari Bar have been minutely analysed through the multi-temporal satellite Image Analysis.
A Monthly Double-Blind Peer Reviewed Refereed Open Access International e-Journal - Included in the International Serial Directories.
International Research Journal of Natural and Applied Sciences (IRJNAS) ISSN: (2349-4077)
101 | P a g e OBJECTIVE OF THE STUDY AREA
The main objective of the present study is to monitor the morphological changes
observed in and around the Balari Bar and its extended part using time series satellite images.
Remote Sensing techniques (viz. interpretation of satellite data) are applied to the study area
over the year 1999-2008. The visual interpretation as well as the digital image processing
techniques is applied for understanding the recent morphological changes arising out for
rapid growth of the Balari Bar and presentation of some hydrological parameters adjacent to
the study area are also needed for evaluation.
IMAGE INTERPRETATION
The morphological condition of the estuary is overviewed from the satellite images
covering the Balari Bar between the periods 1999 to 2008. The images considered for
comparison are IRS 1C 28/11/99, IRS 1C 27/03/2000, IRS 1D 19/02/2001, IRS P6
20/11/2005 and IRS P6 28/02/2008. The following results have been derived through the
analysis of the images-
The overall health of the estuary was good in 1999.
Balari Bar has been developed gradually since 1999.
From 2005 image, depositional activity near Balari Bar is clearly visible.
From 2008 image, it is clear that heavy deposition has been taken place in and
around the Balari Bar.
BALARI BAR DURING 1999 -2008
The images are processed to extract maximum information regarding the (i) growth of
the bar, extension of the sand tail both at upslope and downslope of the bar, (ii) adverse
growth of western edge of Nayachara (opposite to Haldi river confluence) and (iii) any other
erosion and/or deposition in the Haldia-Balari compartment.
Between 1999 and 2000 very small deposition has been taken place in west-central
part of Balari bar and small portion of central and southern part is eroded. From 2000 to 2001
a thin sheet of deposition has been seen in the total western part. A small sand bar is also
developed in the north-east side due to accretional activity. Between 2001 and 2005 the
southern portion of Balari bar was completely eroded and heavy accretion was seen along the
north-east part of the bar and two bars were completely joined. Some changes have been
taken place during 2005 and 2008. Erosional activities are seen only along the north-east
A Monthly Double-Blind Peer Reviewed Refereed Open Access International e-Journal - Included in the International Serial Directories.
International Research Journal of Natural and Applied Sciences (IRJNAS) ISSN: (2349-4077)
102 | P a g e The formation of a knuckle in the western edge of Nayachara further restricts the flow
through Haldia-Balari region. The region encompassed by lower sand of Balari and
Guidewall not conducive to improve flow phenomena. The bed slope seems to be not
favourable for inducing flow from 2nd Oil Jetty.
Fig.2 Multi-temporal Satellite Imageries of the Study Area
A Monthly Double-Blind Peer Reviewed Refereed Open Access International e-Journal - Included in the International Serial Directories.
International Research Journal of Natural and Applied Sciences (IRJNAS) ISSN: (2349-4077)
103 | P a g e RESULTS AND DISCUSSION
Remotely sensed data of different years have examined and interpreted through
logical process of detect, identify, measure and evaluate the significance of environmental
objects, pattern and spatial relationship. In addition to the inherent characteristics of objects
itself the following factors influence the image quality:- (a) Sensor characteristics, (b) Season
of the year and time of the day, (c) Atmospheric effects, (d) Resolution of the imaging system
and scale, (e) Image motion, (f) Stereoscopic parallax, (g) Exposure and processing Besides,
the following image interpretation keys are used for the study –shape, size, tone, shadow,
pattern, texture, site, resolution and association.
A Monthly Double-Blind Peer Reviewed Refereed Open Access International e-Journal - Included in the International Serial Directories.
International Research Journal of Natural and Applied Sciences (IRJNAS) ISSN: (2349-4077)
104 | P a g e Table-1
Area of Balari Bar in Different Years
Table-2
Tidal Information synchronous with satellite passes
Fig.4 Overall erosion-accretion scenario of the study area during the full time-period
Year Balari bar-
Area(sq km)
1999 1.19
2000 1.1
2001 1.38
2005 3.9
2008 6.72
Serial Number
Date Name of
the satellite product with details Time of pass Tide in metre At Balari
1.
28-Nov-1999 IRS 1C LISS-III 10.30 AM 1.9
2.
27-Mar-2000 IRS 1C LISS-III 10.30 AM 2.12
3.
19-Feb-2001 IRS 1D LISS-III 10.30 AM 3.65
4.
20-Nov-2005 IRS P6 LISS-III 10.30 AM 3.68
5.
A Monthly Double-Blind Peer Reviewed Refereed Open Access International e-Journal - Included in the International Serial Directories.
International Research Journal of Natural and Applied Sciences (IRJNAS) ISSN: (2349-4077)
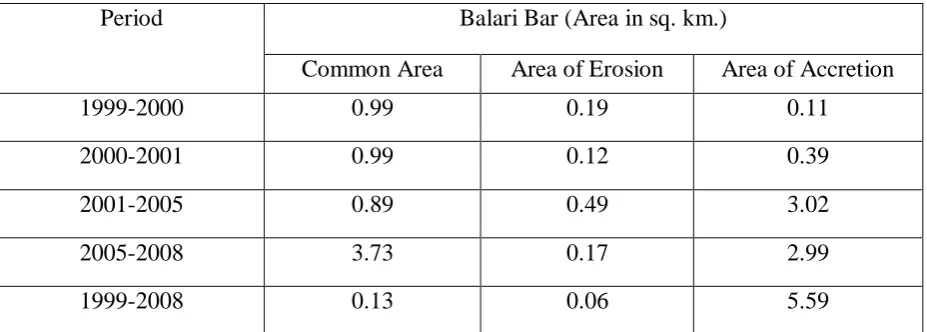
105 | P a g e Table-3
[image:7.595.67.531.107.273.2]Erosion-Accretion area of Balari Bar during the different time-periods
Table-1 shows the change of the entire study area from 1999 to 2008. In 1999 the area of the
Balari Bar was almost 1.19 sq km which become 1.38 sq km in 2001. At that time-period the
rate of deposition was comparatively slow than the later years. But, from 2001 to 2008 a huge
deposition has been taken place as the overall area becomes 6.72 sq km. The above
qualitative interpretations and analyses are provided on the basis of Software based satellite
data processing and calculation.
Table-2 reveals the tidal information synchronous with satellite passes throughout the
time-period. In 2001 and 2005 high tides ranges between 3.60 and 3.70 m has been recorded.
Hence, some land area may be invisible due to the submergence by tidal effect.
Table-3 depicts the relative comparison between the common area and also the area
under erosion and accretion during the different successive time-spans It is clear from the
table that the overall area under erosion is just 0.06 sq km in comparison to the 5.59 sq km of
area under accretion.
CONCLUSION
Balari Bar is a newly formed geomorphological feature in Hugli estuary and also a
very significant evidence to determine the complex morphological and tidal nature of the
area. It is a dynamic mixing zone of fresh water and saline water. The Bar is gradually
developed due to the high rate of deposition and hence because of the rapid areal growth of
the Balari Bar the Hugli river channel is deteriorating at very fast rate.
Period Balari Bar (Area in sq. km.)
Common Area Area of Erosion Area of Accretion
1999-2000 0.99 0.19 0.11
2000-2001 0.99 0.12 0.39
2001-2005 0.89 0.49 3.02
2005-2008 3.73 0.17 2.99
A Monthly Double-Blind Peer Reviewed Refereed Open Access International e-Journal - Included in the International Serial Directories.
International Research Journal of Natural and Applied Sciences (IRJNAS) ISSN: (2349-4077)
106 | P a g e ACKNOWLEDGEMENT
The authors, thankfully acknowledges the Global Land Cover Facility (GLCF) centre,
National Remote Sensing Centre, Balanagar and Survey of India, Dehradun for providing
quality satellite image and topographical maps. The authors are also grateful to their guide
Prof. S.C. Mukhopadhyay, UGC Emeritus Fellow and Former Head of the Department of
Geography, Calcutta University for his guidance, mental support and valuable suggestions.
REFERENCES
1. T. Ghosh, B. Gopinath and S. Hazra, Assessment of landuse/landcover dynamics and
shoreline changes of Sagar Island through remote sensing, 22nd Asian Conference on
Remote Sensing, Singapore, 2001, 5–9.
2. G. Gopinath and P. Seralathan, Rapid erosion of the coast of Sagar Island, West
Bengal, India, Env. Geol.,48, 2005, 1058–1067.
3. A. M. Melesse, Spatiotemporal dynamics of land surface parameters in the Red river
of the north basin, Physics and Chemistry of the Earth, 29, 2004, 795-810.
4. B. Purkait, Coastal erosion in response to wave dynamics operative in Sagar Island,
Sundarban delta, India, Frontiers in Earth Sci., 3(1), 2008, 21–33.
5. M. G. Shaikh, S. R. Nayak, P. N. Shah and B. B. Jambusaria, Coastal landforms
mapping around the Gulf of Khambhat using Landsat TM data, Journal of the Indian
society of Remote Sensing. 17(1), 1989, 41-48.
6. J. R. Jensen, Introductory digital image processing: A remote sensing perspective,
(Upper Saddle River, Prentice Hall, 2005).
7. D. M. McDowell and B. A. O’Connor, Hydraulic behaviour of estuaries, (Macmillan,
London, 1977).
8. D. Pritchard, Estuarine Hydrology, Advances in Geophysics, 1, 1952, 243-280.