2018 International Conference on Computer, Communications and Mechatronics Engineering (CCME 2018) ISBN: 978-1-60595-611-4
Approach Based on Improved Interval D-S Theory for
Target Identification
Hai-jun LIU
*, Zhi-wei LI, Hong-qi YU
and Jie-tao DIAO
College of Electronic Science, National University of Defense Technology, Changsha, China
*Corresponding author
Keywords: Identification, Data fusion, D-S theory, Interval value, Scalar value.
Abstract. In traditional multi-sensor based target identification, problems of sensor reliability and identification confidences would generate significant influence on practical implications. Therefore, a new identification algorithm based on Improved Interval Dempster-Shafer Theory (IIDST) is proposed in this paper. Specifically, this algorithm models reliability of sensors and identification outputs from sensors as interval values, and then combines practical interval outputs through interval evidence combination rules. Finally, the capability of the IIDST algorithm is evaluated via theoretical simulations with results demonstrating the effectively of the proposed algorithm.
Introduction
The data fusion technology is an effective solution for dealing with the uncertain information from multi-sensors. Until now, a large number of techniques for data fusion have already been reported, including probability theory [1], fuzzy sets theory[2], Dempster-Shafer (D-S) theory [3, 4] and etc. Considering the effectivity of disposing missing information and uncertainty, the D-S theory is a promising choice to solve the problem of target identification.
The D-S theory was initially proposed by Dempster, who tried to utilise the upper and lower probabilities to represent the practical uncertainty [3]. Shafer expanded this theory to process uncertain information [4]. Afterwards, the D-S theory becomes popular in many areas [5,6]. Wang proposed a fingerprints and face multi-biometrics features recognition method based on D-S evidence theory[7]. Zhu et al. utilized an improved D-S theory based on an improved particle swarm optimization (PSO) for data fusion, in which the evidence weight value can be obtained by an improved PSO [8]. However, the previous studies mainly focused on the expansions and applications of the D-S theory. Considering the conflicting evidence is interval, these methods are helpless. Chang and Kashyap presented a geometric model based method for dealing with interval conflicting evidence [9]. Liu et al. proposed an interval D-S theory (IDST) algorithm, which is modified for dealing with the target identification problem caused by the achieved reliability of multi-sensors and the measurement uncertainty of the target features [10]. But this method is powerless when the achieved reliability confidences of multi sensors themselves are interval.
In this paper, an improved interval D-S theory (IIDST) is proposed. This algorithm, which models reliability of sensors and identification outputs from sensors as interval values, can process the interval and scalar identification confidences of the target from multi-sensors with considering the reliability of multi-sensors.
Algorithm Based on Improved Interval D-S Theory
Problem Formulation
“uncertainty” indicates identification credibility degrees of the measured targets, and these degrees can be represented as interval values; (2) distinct sensors themselves have distinctive reliability confidences for data fusion, which can also be described as interval credibility. The identification problem is modelled as bellow:
Supposing that there exist m targets T jj( 1, 2,..., )m and n sensors S ii( 1, 2,..., )n , the interval
identification confidence of the jth target Tj from the ith sensor Si is bij, and the interval reliability
confidence of the ith sensor Si itself is pij. The actual interval identification confidence ˆbij of the jth
target Tj from the ith sensor Si is calculated as
L
L U L L U U
U
ˆi i i [ , ] ij [ , ]
j j j ij ij ij ij ij ij ij
b
p p p b p b
b
b p b (1)
where 0 pijL pijU1 and
L U
0bij bij 1. The superscripts Land U represent the lower limit and upper limit respectively. The actual interval identification confidences B of all targets from each sensor are depicted as below
L L U U L L U U
1 11 11 11 11 1 1 1 1
L L U U L L U U
2 21 21 21 21 2 2 2 2
L L U U L L U U
1 1 1 1
ˆ , , , ,
ˆ , , , ,
ˆ , , , ,
m m m m
m m m m
n n n n n nm nm nm nm
p b p b p b p b
p b p b p b p b
p b p b p b p b
b b B b (2)
where ˆbi(i1, 2,..., )n , each element of which is interval, denotes the actual interval identification confidences of all m targets from the ith sensor.
Improved Interval D-S Theory Algorithm
The IIDST algorithm is put forward based on the IDST algorithm [10, 11], and the difference lies in the fact that the IIDST algorithm considers and models the effect of each sensor’s reliability as interval value. The implementation of the IIDST algorithm also includes three steps: normalization,
combination and reconstruction.
Supposing that there are m targets T jj( 1, 2,..., )m and n sensors S ii( 1, 2,..., )n . The actual
interval identification confidences of each target from all sensors are given in (2).Compared with the specific realization of the IDST algorithm [10, 11], the main difference of the IIDST algorithm is reflected in the first step, namely normalization, which is described detailedly as below:
Normalization: Normalize the upper and lower bound of the actual interval confidences of each target from all sensors separately. The normalization of actual interval confidences bˆLi and bˆiU from the ith sensor is computed as below
L L L L
1 2
ˆ ˆ ˆ
ˆ , , ,
i bi bi bim
b (3)
where
L L L
L L
1
ˆ ij ij
ij m ij ij j p b b p b
, andL 1 ˆ 1 m ij j b
U U U U
1 2
ˆ ˆ ˆ
ˆ , , ,
i bi bi bim
where
U U
U
U U
1
ˆ ij ij
ij m ij ij j p b b p b
, andU 1 ˆ 1 m ij j b
So (2) can be re-described as (5) and (6), which have the same expression as that in [10, 11].
L L L L
1 11 12 1
L L L L
2 21 22 2
L
L L L L
1 2
ˆ ˆ ˆ
ˆ , , ,
ˆ ˆ ˆ
ˆ , , ,
ˆ
ˆ ˆ ˆ
ˆ , , ,
m
m
n n n nm
b b b
b b b
b b b
b b B b (5)
U U U U
1 11 12 1
U U U U
2 21 22 2
U
U U U U
1 2
ˆ ˆ ˆ
ˆ , , ,
ˆ ˆ ˆ
ˆ , , ,
ˆ
ˆ ˆ ˆ
ˆ , , ,
m
m
n n n nm
b b b
b b b
b b b
b b B b (6)
where BˆLdenotes the normalized lower identification confidences and BˆU represents the normalized upper identification confidences. It is noticed that each element of bˆLi and bˆUi are scalar.
The particular realization of combination and reconstruction step, as well as the decision-making rule, can be seen in [10, 11].
Simulations
Two experiments are given to demonstrate and analyse the identification performance of the IIDST algorithm in this section. Assume that four types of warships are observed by two sensors (an electronic support measure (ESM) system and an optical imagery reconnaissance (OIR) system) in two periods.
[image:3.595.72.237.150.346.2]Performance Evaluation of Experiment 1
Table 1. Interval identification confidences from two sensors and interval reliability confidences of each sensor in two measurement periods.
Sensor Warship Type
t1 t2 t3 t4
ICInt RCInt ICInt RCInt ICInt RCInt ICInt RCInt
b11(·) [0.35,0.45] [0.70,0.75] [0.40,0.45] [0.65,0.75] [0.15,0.20] [0.60,0.65] [0.10,0.20] [0.50,0.65]
b12(·) [0.55,0.70] [0.80,0.90] [0.25,0.35] [0.45,0.50] [0.30,0.35] [0.55,0.70] [0.15,0.20] [0.60,0.70]
b21(·) [0.75,0.85] [0.70,0.85] [0.25,0.30] [0.50,0.65] [0.10,0.20] [0.65,0.70] [0.10,0.25] [0.65,0.75]
b22(·) [0.65,0.75] [0.70,0.85] [0.20,0.35] [0.70,0.75] [0.25,0.30] [0.70,0.75] [0.15,0.20] [0.60,0.70] This section is utilised to examine whether the IIDST algorithm can solve the interval identification confidences from two sensors in two measurement periods with considering the interval reliability confidences of each sensor itself. The confidences are listed in Table 1, where b1i represent confidences from the ESM system in the ith measurement period while b2j describing confidences
By applying the decision-making rule in [10, 11], it can be concluded that t1 represents the identification result, which is obvious to be seen in Figure 1. From Figure 1, it can also get that the IIDST algorithm can deal with the interval identification confidences from two sensors with considering the interval reliability confidences of each sensor.
Figure 1. Identification performance of the IIDST algorithm for experiment 1.
Performance Evaluation of Experiment 2
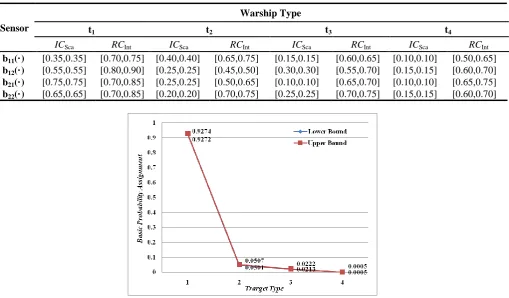
This section is used to examine whether the IIDST algorithm can deal with the scalar-value identification confidences from two sensors in two measurement periods with considering the interval reliability confidences of each sensor. The confidences are listed in Table 2, where ICScadenote the
identification confidence scalar-values of each target from each sensor and RCInt describe the
[image:4.595.45.555.467.765.2]reliability confidence intervals of each sensor.
Table 2. Scalar-value identification confidences from two sensors and interval reliability confidences of each sensor in two measurement periods.
Sensor
Warship Type
t1 t2 t3 t4
ICSca RCInt ICSca RCInt ICSca RCInt ICSca RCInt
b11(·) [0.35,0.35] [0.70,0.75] [0.40,0.40] [0.65,0.75] [0.15,0.15] [0.60,0.65] [0.10,0.10] [0.50,0.65]
b12(·) [0.55,0.55] [0.80,0.90] [0.25,0.25] [0.45,0.50] [0.30,0.30] [0.55,0.70] [0.15,0.15] [0.60,0.70]
b21(·) [0.75,0.75] [0.70,0.85] [0.25,0.25] [0.50,0.65] [0.10,0.10] [0.65,0.70] [0.10,0.10] [0.65,0.75]
b22(·) [0.65,0.65] [0.70,0.85] [0.20,0.20] [0.70,0.75] [0.25,0.25] [0.70,0.75] [0.15,0.15] [0.60,0.70]
[image:4.595.42.555.468.768.2]The identification performance is shown in Figure 2, it is also obvious to conclude that t1
represents the identification result. From Figure 2, we can see that the IIDST algorithm can successfully process the scalar-value identification confidences from two sensors and interval reliability confidences of each sensor in two measurement periods.
Conclusions
In this paper, we proposed a new identification algorithm based on IIDST, which models reliability of sensors themselves and identification outputs from sensors as interval values, and these intervals can be further processed by using interval evidence combination rules. Simulation results demonstrate that the proposed IIDST algorithm can process the interval identification confidences from sensors with considering the achieved reliability of multi sensors themselves.
Acknowledgement
This work was supported by the National Natural Science Foundation of China (No. 61471377, 61604177, 61704191 and 61701509).
References
[1] Pertile M., De Cecco M., Baglivo L.: ‘Uncertainty Evaluation in Two-Dimensional Indirect Measurement by Evidence and Probability Theories’, IEEE Trans. Instrum. Meas., 2012, 59, (11), pp. 2816–2824.
[2] Liu J., Deng X.-Y., Wei D.-J., Li Y., Deng Y., ‘Multi-attribute decision-making method based on interval-valued intuitionistic fuzzy sets and D-S theory of evidence’, Proc. Chin. Control Decis. Conf. (CCDC 2012), Taiyuan, China, May 2012, pp. 2651-2654.
[3] Dempster A. P.: ‘Upper and Lower Probabilities Induced by a Multivalued Mapping’, Ann. Math. Statist., 1967, 38, (2), pp. 325-329.
[4] Shafer G.: ‘A Mathematical Theory of Evidence’, Princeton, NJ, USA: Princeton University Press, 1976.
[5] Inagaki T.: ‘Interdependence between Safety-Control Policy and Multiple-Sensor Schemes Via Dempster-Shafer Theory’, IEEE Trans Relia, 1991, 40, (2), pp. 182-188.
[6] Yager R. R.: ‘Cumulative Distribution Functions From Dempster-Shafer Belief Structures’, IEEE Transactions on Systems, Man, and Cybernetics-Part B: Cybernetics, 2004, 34, (5), pp. 2080-2087.
[7] Wang F.: ‘Fusion fingerprint and face multi-biometrics recognition based on D-S evidence theory’, Advanced Materials Research, 2012, 459, pp. 644-648.
[8] Zhu P.Y., Xiong W.L., Qin N.N., Xu B.G.: ‘D-S theory based on an improved PSO for data fusion’, J. Netw., 2012, 7, (2), pp. 370-376.
[9] Chang L.W., Kashyap R.L.: ‘Study of interval-valued belief combination with conflicting evidence’, Proceedings of the 2nd International IEEE Conference on Tools for Artificial Intelligence, Herndon, VA, USA, November 1990, pp. 725-730.
[10] Liu H.J., Wang B., Liu Z., Zhou Y.Y.: ‘Data Fusion Based on Interval Dempster-Shafer Theory for Emitter Platform Identification’, Proc. - Int. Conf. Inf. Eng. Comput. Sci. (ICIECS 2009), Wuhan, China, December 2009, pp. 3063-3066.