2019 2nd International Conference on Informatics, Control and Automation (ICA 2019) ISBN: 978-1-60595-637-4
Grey Correlation Analysis of Factors Affecting Nitrogen Oxide
Concentration in Cement Production Process
Yi-chao LI
1, Shi-zeng LU
2and Hong-liang YU
3,*School of Electrical Engineering, University of Jinan, Jinan, China
*Corresponding author
Keywords: Grey correlation, NOx, Decomposition furnace, Rotary kiln.
Abstract. Nitrogen oxides (hereinafter referred to as NOx) is one of the main pollutants produced in cement production. There have been many studies on the mechanism of NOx formation, but there is little research on the relationship between production control factors and NOx concentration. In this paper, several parameters of the formation of nitrogen oxides (decomposition furnace link and rotary kiln link) were selected by the gray correlation analysis method as the comparison sequence, and the NOx concentration was selected as the reference sequence for correlation analysis. The final results show that the parameters of the kiln tail chamber, the temperature of the decomposition furnace, and the amount of raw material discharged have the most significant effect on the NOx concentration. The research results can provide theoretical guidance for the coordinated control of cement production in the later stage, and reduce the NOx concentration under the premise of ensuring the quality of cement clinker, so as to reduce the denitration cost of enterprises by reducing the amount of ammonia water used, so as to achieve the ultimate goal of energy saving.
Introduction
The grey relational analysis method can find the main characteristics and main influencing factors by finding certain correlations among the random factor sequences in certain incomplete information through certain data processing. The grey relational analysis method [4] is an analysis method based on the microscopic and macroscopic approach of the sequence of behavioral factors to analyze and determine the degree of influence between factors or the contribution of factors to the main behavior. Li Ailian [5] and others used MATLAB software to analyze the correlation of twelve variables affecting blast furnace temperature, and obtained the main factors affecting blast furnace temperature, and abandoned the secondary factors affecting blast furnace temperature. Huang Jindi [6] and others used gray correlation analysis method, with the post-calcined true density and powder resistivity as the reference sequence, the control factors of the downstream 24 cans of 8-layer fire-channel calciner as the comparison sequence, the correlation degree The results show that the grey correlation value of selected control factors are all >0.5, which indicates that each control factor has a significant effect on the quality of calcined coke, which provides effective theoretical support for the rational control of various control parameters.
Based on the grey correlation analysis method, this paper analyzes the parameters of the two main links of NOx production in the cement production process, and analyzes the correlation between the main parameters of the rotary kiln and the decomposition furnace and the NOx concentration [7], and obtains the key factors affecting the NOx concentration. Provides effective theoretical support for reducing NOx concentration from the perspective of process control in cement production.
Basic Principles of Grey Relational Analysis
Determining Comparison and Reference Sequences and Dimensionless Processing
For the t-group measurement data in the production process, each group of data contains m control indicators, which can be expressed as:
X
1,
X
2, ,
X
m
1 2
1 2
1 2
1 1 ... 1
2 2 ... 2
...
m m
m
t t t
x
x
x
x
x
x
x
x
x
(1)
1 , 2 , ,
Ti xi xi xi t
X ;i1, 2, ,m;
x
i t is the ith correlation factor data measured for group t.Taking the NOx concentration as a reference sequence, it can be expressed by the formula (2):
0 0
1 ,
02 , ,
0T
t
x
x
x
X
(2)Because the physical meanings of various factors in the system are different, the dimension of the data is not necessarily the same. For example, the fluctuation range of NOx concentration is 100~300mg/m3, and the outlet temperature of the decomposition furnace is 850~900°C. If the data is not pretreated, It is not possible to perform data analysis on the same metric scale, or it is difficult to get a correct conclusion when comparing. Therefore, in the gray correlation analysis, non-dimensional data processing and raw data processing are generally performed. This article uses the mean method:
There is a primitive sequence
1 , 2 , ,
T i xi xi xi tX ;i0,1, 2, ,m, Let its mean, Xi .
1
1
i i
t
k
X
k
t
x
1, 2, ,
k t; Then, the
i
X is averaged, and
Y
i is:i i i x Y X (k)
(k) (4)
Find the Grey Correlation Coefficient between the Reference Series and the Comparison Series
Tables. The degree of association is essentially the degree of difference in geometry between curves. Therefore, the difference between the curves can be used as a measure of the degree of association. For a reference sequence
0
X
, there are several comparison series,X
1,X
2, …,X
m,and the correlation coefficient R of each comparison sequence and the reference sequence at each moment (each point in the curve) can be calculated by the following formula:
min max 0 0 max ( ) ( ) i i k k
(5) Where Δ0i(k) represents the absolute value of the two sequences at time k:
0i k
x
0 k x
i k
,
max ,min
, is the maximum and minimum of the absolute value difference at each time.is the resolution coefficient, generally between 0 and 1, usually 0.5, in order to improve the significance of the difference between the gray correlation coefficients.Find the Gray Correlation Degree ij
r
Because the correlation coefficient is the degree of correlation between the comparison series and the reference sequence at each moment (ie, each point in the curve), it has more than one number, and the information is too scattered to facilitate the overall comparison. Therefore, it is necessary to concentrate the correlation coefficient at each moment (each point in the curve) to a value, that is, to obtain the average value thereof, as the quantity indicating the degree of association between the NOx concentration and each influencing factor, and the correlation degree formula is as follows:
0 0 1
1
( )
N i i kk
N
r
(6)In the formula,
0i
r
is the gray correlation degree between the subsequence and the parent sequence0
X
, and N is the length of the sequence, that is, the number of data. If there are n comparisonsequences, mreference sequences, the correlation degree of each comparison sequence j to the reference sequence i is
ij
r
, Then the gray correlation matrix is:11 12 1
21 22 2
1 2
...
...
...
m mn n nm
R
r
r
r
r
r
r
r
r
r
(7)Ranking of Relevance
The
0i
Grey Correlation Analysis of Factors Affecting NOx Concentration
A large amount of exhaust gas will be generated in the cement production process. If the NOx is directly discharged into the air, it will cause serious pollution to the environment. This paper will control the two main links of NOx production (decomposition furnace link and rotary kiln link) from the process. Angle analysis of influencing factors.
Decomposition Furnace Link
[image:4.595.76.517.369.422.2]According to the actual production experience of the industrial site, it is preliminarily determined that the factors affecting the NOx concentration in the decomposition furnace section are the coal injection amount at the kiln tail, the raw material discharge amount, the decomposition furnace outlet temperature, the tertiary air temperature, and the lower temperature of the decomposition furnace. Since these data are detected once in one second, the influence of these factors on NOx in actual production is a cumulative process. Therefore, the average value of a period of time should be selected. The average value in one minute is selected as the data of one point. . Taking the NOx concentration as the reference sequence X0, the coal injection amount X1 at the kiln tail, the raw material discharge amount X2, the decomposition furnace outlet temperature X3, the tertiary air temperature X4, and the lower temperature of the decomposition furnace X5 are used as a comparison sequence. 1000 sets of typical sample data are selected from the historical database, and the sample statistical indicators are shown in Table 1.
Table 1. Statistical data of sample data of NOx concentration and its influencing factors.
statistical indicators X0 X1 X2 X3 X4 X5
average value 183.2835 6.3369 171.7616 884.3397 856.1657 805.5840 Minimum value 134.7462 5.704193 167.1823 878.1774 824.9531 783.6273 Maximum value 249.8968 6.85486 175.5214 895.7031 895.3815 827.0237
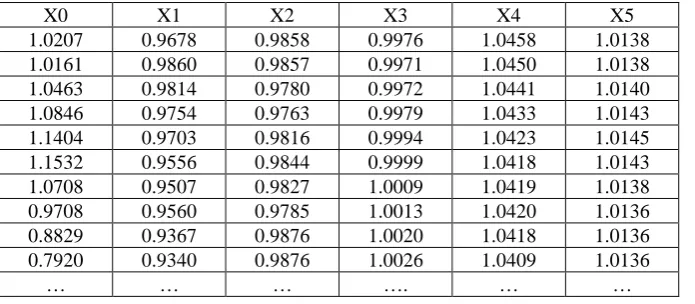
The data is dimensionlessly processed according to the formula (3) (4) based on the grey correlation analysis method. The calculation results are shown in Table 2. Table 2 lists the mean-valued dimensionless data of the NOx concentration in the decomposition furnace and its influencing factors. These data are all on the same measurement scale, which is convenient for subsequent use.
Table 2. NOx concentration and its influencing factors mean non-dimensional data.
X0 X1 X2 X3 X4 X5
1.0207 0.9678 0.9858 0.9976 1.0458 1.0138 1.0161 0.9860 0.9857 0.9971 1.0450 1.0138 1.0463 0.9814 0.9780 0.9972 1.0441 1.0140 1.0846 0.9754 0.9763 0.9979 1.0433 1.0143 1.1404 0.9703 0.9816 0.9994 1.0423 1.0145 1.1532 0.9556 0.9844 0.9999 1.0418 1.0143 1.0708 0.9507 0.9827 1.0009 1.0419 1.0138 0.9708 0.9560 0.9785 1.0013 1.0420 1.0136 0.8829 0.9367 0.9876 1.0020 1.0418 1.0136 0.7920 0.9340 0.9876 1.0026 1.0409 1.0136
… … … …. … …
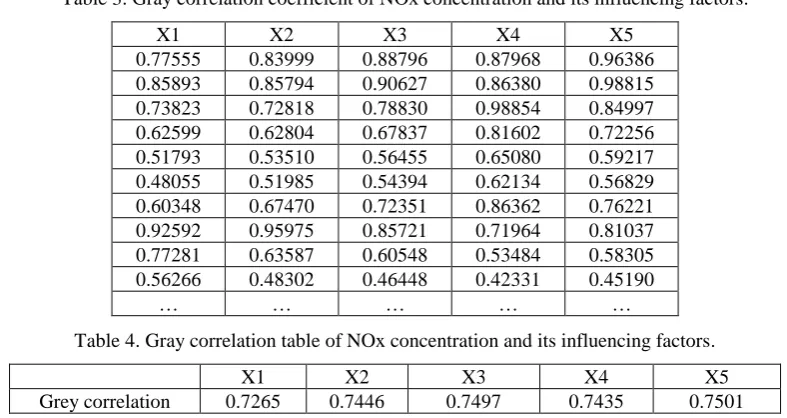
[image:4.595.128.476.519.671.2]Table 3. Gray correlation coefficient of NOx concentration and its influencing factors.
X1 X2 X3 X4 X5
0.77555 0.83999 0.88796 0.87968 0.96386 0.85893 0.85794 0.90627 0.86380 0.98815 0.73823 0.72818 0.78830 0.98854 0.84997 0.62599 0.62804 0.67837 0.81602 0.72256 0.51793 0.53510 0.56455 0.65080 0.59217 0.48055 0.51985 0.54394 0.62134 0.56829 0.60348 0.67470 0.72351 0.86362 0.76221 0.92592 0.95975 0.85721 0.71964 0.81037 0.77281 0.63587 0.60548 0.53484 0.58305 0.56266 0.48302 0.46448 0.42331 0.45190
… … … … …
Table 4. Gray correlation table of NOx concentration and its influencing factors.
X1 X2 X3 X4 X5
Grey correlation 0.7265 0.7446 0.7497 0.7435 0.7501
The gray correlation degree is sorted as follows: lower temperature of the decomposition furnace> outlet temperature of the decomposition furnace> raw material discharge amount> tertiary air temperature> coal injection amount at the kiln tail, namely:
X5>X3>X2>X4>X1
Then the temperature of the lower part of the decomposition furnace can be determined, and the outlet temperature of the decomposition furnace has the greatest influence. Followed by raw material discharge, tertiary air temperature, coal injection at the end of the kiln. Since the gray correlation degree is >0.5, it indicates that these five variables have significant effects on the NOx concentration.
Rotary Kiln Link
[image:5.595.68.529.578.637.2]According to the actual production experience of the industrial site, the factors that determine the NOx concentration in the rotary kiln are preliminarily determined, including secondary air temperature, kiln head coal injection amount, raw material discharge amount, kiln head negative pressure, and kiln tail gas chamber temperature. Taking the NOx concentration as the reference sequence X0, the secondary air temperature X1, the kiln head coal injection amount X2, the raw material discharge amount X3, the kiln head negative pressure X4, and the kiln tail chamber temperature X5 are used as a comparison sequence. 1000 sets of typical sample data are selected from the historical database. The sample statistical indicators are shown in Table 5.
Table 5. Statistical data of sample data of NOx concentration and its influencing factors.
statistical indicators X0 X1 X2 X3 X4 X5
average value 183.2835 1140.0616 3.3518 171.7616 -57.8786 1087.6914 Minimum value 134.7462 1070.1927 3.2937 167.1823 -77.2118 1126.9062 Maximum value 249.8968 1253.1750 3.4084 175.5214 -36.4049 1055.0167
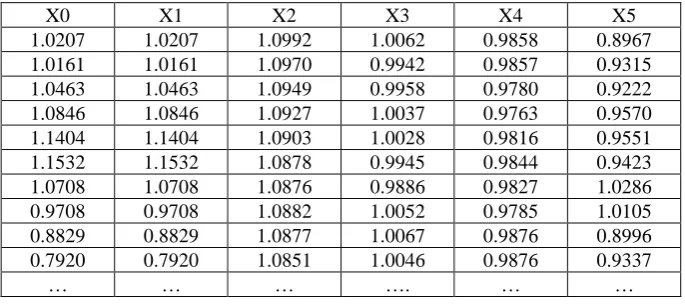
Table 6. NOx concentration and its influencing factors mean non-dimensional data.
X0 X1 X2 X3 X4 X5
1.0207 1.0207 1.0992 1.0062 0.9858 0.8967 1.0161 1.0161 1.0970 0.9942 0.9857 0.9315 1.0463 1.0463 1.0949 0.9958 0.9780 0.9222 1.0846 1.0846 1.0927 1.0037 0.9763 0.9570 1.1404 1.1404 1.0903 1.0028 0.9816 0.9551 1.1532 1.1532 1.0878 0.9945 0.9844 0.9423 1.0708 1.0708 1.0876 0.9886 0.9827 1.0286 0.9708 0.9708 1.0882 1.0052 0.9785 1.0105 0.8829 0.8829 1.0877 1.0067 0.9876 0.8996 0.7920 0.7920 1.0851 1.0046 0.9876 0.9337
… … … …. … …
[image:6.595.98.492.302.515.2]According to formula (5), the specific data of the gray correlation coefficient between the NOx concentration and various factors in the rotary kiln is shown in Table (7); according to formula (6),the gray correlation degree is shown in Table (8).
Table 7. Grey correlation coefficient of NOx concentration and its influencing factors.
X1 X2 X3 X4 X5
0.76040 0.94510 0.87717 0.66765 0.95264 0.75469 0.91957 0.89146 0.74660 0.93747 0.83691 0.83157 0.78488 0.66741 0.94522 0.96869 0.75490 0.69702 0.66137 0.82157 0.83249 0.64420 0.61069 0.57341 0.69354 0.79207 0.61086 0.59606 0.54148 0.66858 0.93707 0.75179 0.73859 0.85491 0.85752 0.67952 0.87846 0.96985 0.86235 0.81097 0.54875 0.66785 0.70408 0.93695 0.63212 0.45934 0.53952 0.56014 0.63727 0.51430
… … … … …
Table 8. Gray correlation table of NOx concentration and its influencing factors.
X1 X2 X3 X4 X5
Grey correlation 0.7854 0.7982 0.7937 0.7105 0.8041
The gray correlation degree is sorted as follows: kiln tail chamber temperature > kiln head coal injection amount > raw material discharge amount > secondary air temperature > kiln head negative pressure, namely:
X5>X2>X3>X1>X4
It can be determined that the temperature of the kiln tail chamber and the coal injection volume of the kiln head have the greatest influence, followed by the raw material discharge amount, the secondary air temperature and the kiln head negative pressure. Since the gray correlation degree is >0.5, it indicates that these five variables have significant effects on the NOx concentration.
Conclusion
control the temperature of the decomposition furnace and the temperature of the rotary kiln exhaust chamber to provide a theoretical basis for the coordinated control of the overall process of cement production to reduce NOx concentration, thereby achieving energy saving and emission reduction. The ultimate goal.
Acknowledgement
This research was financially supported by Shandong Province Major R&D Plan (2017CXGC0614).
References
[1] Nie Jing etc. Analysis of Cement SNCR Denitration Technology and Its Influencing Factors [J]. Environmental protection, 2012, 30(5): 46-48.
[2] Jia Shi Chang. Analysis of SNCR Denitration Technology in Cement Kiln [J]. Environmental technology, 2012, 25(2): 34-37.
[3] Cai Xin. Numerical Simulation of Flow Field and SNCR Denitration Process in Cement Decomposing Furnace [D]. Beijing: Tsinghua University, 2014, 19-49.
[4] Liu Chunjing, Tang Dunbing, He Hua, etc. Multi-objective optimization of turning machining based on grey correlation and principal component analysis[J].Transaction Machine of Agricultural Machinery, 2013, 44(4): 293-298, 292.
[5] Li Ailian, Zhao Yongming, Cui Guimei. The Temperature Prediction Model of ELM Blast Furnace Based on Grey Correlation Analysis[J].Journal of Iron and Steel Research, 2015, 27(11):33-37.
[6] Golden Dyke, Li Jing, Xiao Jin, etc. Grey Correlation Analysis of Factors Affecting Quality of Calcined Petroleum Coke[J].Nonferrous Metals Engineering, 2018, 8(3):82-85.