Article
1
Flow behavior characteristics and processing map of
2
Fe-6.5wt.%Si alloys during hot compression
3
Shibo Wen, Chaoyu Han, Bao Zhang, Yongfeng Liang, Feng Ye* and Junpin Lin
4
State Key Laboratory for Advanced Metals and Materials, University of Science and Technology Beijing,
5
Beijing, 100083, China; [email protected] (S. B. Wen); [email protected] (C. Y. Han);
6
[email protected] (B. Zhang); [email protected] (Y. F. Liang); [email protected] (F. Ye);
7
[email protected] (J. P. Lin)
8
* Correspondence: [email protected]; Tel.: +86-10-6233-3899
9
Abstract: The flow behavior of Fe-6.5wt.%Si alloys during hot compression was investigated at
10
temperatures 650–950 °C and strain rates 0.01–10 s-1. The results showed that the flow stress
11
depended distinctly on the deformation temperatures and strain rates. The flow stress and work
12
hardening rate increased with the decrease of temperature and the increase of strain rate. The
13
activation energy under all the deformation conditions was calculated to be 410 kJ/mol. The
14
constitutive equation with hyperbolic sine function and Zener–Hollomon parameter was
15
developed. The peak stress, critical stress, and steady-state stress could be represented as
16
σ=A+Bln(Z/A). Dynamic recrystallization occurred under the deformation conditions where the
17
values of Z were lower than 1020. Processing maps were established to optimize the processing
18
parameters. The power dissipation efficiency decreased in the high temperature and low strain rate
19
region, increased in the high temperature and high strain rate region, and remained unchanged in
20
other regions with the increase of true strain. Furthermore, the unstable area expanded. The true
21
strain of 0.7 was the optimum reduction according to the processing map. Based on the analysis of
22
surface quality, microstructures, and ordered structures, the optimized processing parameters for
23
the Fe-6.5wt.%Si alloys were the temperature and strain rate of higher than 900 °C and 0.01–10 s-1,
24
respectively, or 800–900 °C and lower than 0.4 s-1, respectively.
25
Keywords: Fe-6.5wt.%Si alloy; hot compression; processing map; microstructure; optimized
26
processing parameter27
28
1. Introduction29
Fe-6.5wt.%Si alloy has been considered as a potential material for application in high-frequency
30
fields, such as transformers, power generators, and electric relays, as it is an excellent soft magnetic
31
material with high electrical resistance, high relative permeability, nearly zero magnetostriction, low
32
coercive force, and low iron loss [1-3]. However, ordered structures such as B2 (Pm3m) and D03 (Fm3m)
33
are formed in this alloy [4, 5], which result in the strengthening of lattice resistance and formation of
34
anti-phase boundary. These lead to room-temperature fragility of the alloy. In order to avoid
35
room-temperature embrittlement, various techniques have been developed, such as chemical vapor
36
deposition [6], hot dipping [7], spray forming [8-10], rapid solidification [11-13], and direct powder
37
rolling [14]. Moreover, a hot-warm-cold rolling method combined with proper heat treatments was
38
reported for the fabrication of sheets of thickness 0.03–0.05 mm [15-17]. As indicated in previous
39
reports, the rolling parameters, including temperature, rolling reduction, and strain rate, control the
40
flow behavior [18] and microstructural evolution [19]. Moreover, other factors such as the degree of
41
ordering [20] are important in the rolling process. These factors determine the deformation
42
mechanisms of the alloy during the rolling process.
43
Generally, softening mechanisms such as dynamic recovery (DRV) and dynamic
44
recrystallization (DRX) often occur during hot deformation such as rolling. Recently, Niu et al. [21]
45
reported that the softening mechanisms of the Fe-6.5wt.%Si alloy were DRV and DRX during hot
46
compression. Liang et al. [22] observed that DRX was the main softening mechanism above 900 °C,
47
whereas DRV was the main softening mechanism below 700 °C. However, the correlation between
48
the deformation mechanisms and rolling process should be clarified via further experiments. The
49
processing map (PM) technique based on the dynamic materials model (DMM) could be one of the
50
choices. PMs have been considered a useful approach to distinguish the feasibility of rolling process,
51
investigate the transformation of microstructures, and observe the formation of textures. Therefore,
52
these techniques can be used to optimize the rolling parameters and control the microstructures and
53
textures. PMs have been employed to evaluate the processing technology of various alloys, e.g.,
54
austenitic steels and Al–Cu–Mg–Ag alloys [23, 24]. However, there are no researches about the
55
processing map of the Fe-6.5wt.%Si alloys for simulating the rolling parameters. Thus, it is necessary
56
to analyze the flow behavior characteristics and processing map and to simulate the rolling
57
parameters to ensure the rolling stability for the industrialized production of the Fe-6.5wt.%Si alloys.
58
In this study, the effect of deformation conditions on the flow behavior and microstructural
59
evolution of the Fe-6.5wt.%Si alloy during compression was investigated. The constitutive equations
60
were established. PMs were generated to investigate the feasibility of the rolling process and observe
61
the microstructure corresponding to each region of the PM. Based on the analysis of the surface
62
quality, microstructures, and ordered structures, the optimized processing parameters were
63
obtained.
64
2. Materials and Methods
65
Fe-6.5wt.%Si alloy ingots were cast in a vacuum medium-frequency induction furnace by
66
melting pure iron (Fe=99.5 wt.%) and metallic silicon (Si=99 wt.%) above 1500 °C. The chemical
67
composition is presented in Table 1. After homogenization at 1050 °C for 50 h, the ingots were
68
die-forged into square billets with a cross-section of 24×24 mm2 at 800–1100 °C.
69
Table 1. Chemical composition of Fe-6.5wt.%Si alloy (wt.%).
70
C Si Mn S P Ti B Fe 0.009 6.510 0.015 0.0009 0.054 0.005 0.0004 Bal
71
Cylindrical specimens of Ф6 mm×12 mm were machined from the square billets with equiaxed
72
grains. Isothermal compression tests were conducted using a GleebleTM thermo-mechanical test
73
frame (Gleeble-1500) at temperatures ranging from 650–950 °C and strain rates ranging from 0.01–10
74
s-1. The height reductions were 50% and 80%, and hence, the corresponding true stains were 0.7 and
75
1.6, respectively. The specimens were heated to the required temperature at 20 °C/s, maintained for
76
180 s, compressed at a specified temperature, and finally quenched in water.
77
The compressed specimens were polished and etched with a solution of 5% HNO3 in deionized
78
water. The microstructures of these specimens were observed using an Ernst Leitz Wetzlar optical
79
microscope.
80
The ordered structures of the specimens after deformation were observed using X-ray
81
diffraction (XRD, D/max2550HB+/PC). An electron backscattered diffraction detector (EBSD)
82
mounted on a ZEISS SUPRA 55 scanning electron microscope was used to detect recrystallization
83
fractions of the specimens. HKL Channel 5 programs were used for processing the data.
84
3. Results and Discussion
85
3.1. Flow behavior characteristics
86
The true stress–true strain curves of the Fe-6.5wt.%Si alloy at a total true strain of 1.6 under
87
various deformation conditions are shown in Figure 1. It can be observed that the flow stress
88
increased rapidly at the beginning of deformation, reached a steady state after a stress peak, and
89
temperature of 750 °C and strain rate of 0.01 s-1 (Figure 1a). It is also observed that the flow stress
91
depended distinctly on the temperature, strain rate, and strain. The flow stress decreased with the
92
increase of deformation temperature, and increased with the increase of strain rate. A peak stress
93
was evident in most of the curves e.g., in the curve indicating deformation at the temperature of 650
94
°C and strain rate of 0.1 s-1 (Figure 1b).
95
96
Figure 1. True stress–true strain curves of the Fe-6.5wt.%Si alloy under various deformation
97
conditions: (a) 0.01 s-1; (b) 0.1 s-1; (c) 1 s-1; (d) 10 s-1.
98
Hot compressive deformation is influenced by work hardening and dynamic softening. At the
99
beginning of the deformation, dislocation multiplication leads to work hardening. It exceeds
100
dynamic softening, which causes the increase of the flow stress. DRX begins when the strain reaches
101
a critical value. This leads to dynamic softening and causes the decrease of the flow stress. As the
102
deformation progresses, the dynamic softening offsets the work hardening, and consequently, the
103
flow stress remains stable. This is called the DRX mold, as observed in the curve indicating
104
deformation at the temperature of 750 °C and the strain rate of 0.01 s-1. However, as the deformation
105
progresses, the flow stress increases slowly or is in the steady state, and DRV but not DRX occurs,
106
which is called the DRV mold, as observed in the case of the deformation at the temperature of 950
107
°C and the strain rate of 0.01 s-1. In contrast, the flow stress continues to decrease beyond peak stress,
108
as in the case of the deformation at the temperature of 650 °C. The reason for this phenomenon is
109
that the degree of ordering decreases gradually with deformation, and a disordered alloy is finally
110
obtained. The deformation-induced disordering and DRV are the main softening mechanisms [20].
111
The work hardening rate during compression can be calculated using the equation (θ = , )
112
plastic deformation, and it is necessary to remove the elastic stage of the flow curves [26]. Figure 2
114
shows the θ–ε and θ–σ curves of the Fe-6.5wt.%Si alloy at the true strain of 0–0.6.
115
116
Figure 2. θ–ε and θ–σ curves of the Fe-6.5wt.%Si alloy: (a) θ–ε; (b) θ–σ.
117
The positive values of θ indicate that the work hardening exceeds the dynamic softening. The
118
peak stress and corresponding strain can be obtained from the flow curve, whereas the true peak
119
stress (σ ) and strain (ε ) can be calculated from the θ–ε and θ–σ curves when θ=0 [26], as presented
120
in Table 2.
121
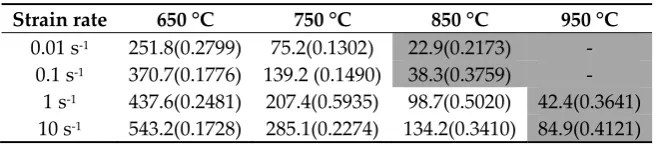
Table 2. Peak stress (MPa) and corresponding strain of the Fe-6.5wt.%Si alloy.
122
Strain rate 650 °C 750 °C 850 °C 950 °C
0.01 s-1 251.8(0.2799) 75.2(0.1302) 22.9(0.2173) - 0.1 s-1 370.7(0.1776) 139.2 (0.1490) 38.3(0.3759) -
1 s-1 437.6(0.2481) 207.4(0.5935) 98.7(0.5020) 42.4(0.3641) 10 s-1 543.2(0.1728) 285.1(0.2274) 134.2(0.3410) 84.9(0.4121)
123
It can be observed that the work hardening rate increased with the decrease of temperature and
124
increase of strain rate, as shown in Figure 2 (a). Similarly, the peak stress increased with the decrease
125
of temperature and increase of strain rate, as shown in Figure 2 (b).
126
The DRX was initiated before the flow stress reached a peak. The critical stress (σ ) and
127
corresponding strain (ε ) could satisfy the condition − = 0 [27]. The critical stress and
128
corresponding strain are listed in Table 3.
129
Table 3. Critical stress (MPa) and corresponding strain of the Fe-6.5wt.%Si alloy.
130
Strain rate 650 °C 750 °C 850 °C 950 °C
0.01 s-1 250.4(0.2022) 75.2(0.1302) 22.5(0.1490) 4.1(0.3072) 0.1 s-1 370.7(0.1776) 139.2 (0.1490) 35.7(0.1256) 17.9(0.3819)
1 s-1 430.5(0.1302) 188.3(0.2123) 73.9(0.1073) 35.5(0.1209) 10 s-1 542.7(0.1584) 270.8(0.0983) 120.9(0.1073) 70.8(0.1119)
3.2. Constitutive equation
131
A constitutive equation is usually used to describe the relationship among the flow stress,
132
strain rate, and temperature.
133
ε = A σ exp − , (1)
ε = A exp(βσ)exp − , (2)
135
ε = A sinh(ασ) exp − , (3)
136
where ε is the strain rate, σ is the flow stress, A1, A2, A, n1, β, α (= ), and n are constants, R is the gas
137
constant (8.314 Jmol-1K-1), T is the deformation temperature, and Q is the activation energy of the
138
deformation. The value of Q reflects the relationship between the work hardening and dynamic
139
softening during the hot compressive deformation, and it also describes the formability of the alloy.
140
The above three constitutive equations correspond to various conditions, i.e., the power
141
function (1) corresponds to low stress, the exponential function (2) corresponds to high stress, and
142
the hyperbolic sine function (3) corresponds to a wide range of flow stresses [28-30].
143
In addition, the relationship between the strain rate and temperature during compression can
144
be represented by the Zener–Hollomon parameter [31].
145
Z = εexp = A sinh(ασ) . (4)
146
These constants and the activation energy are calculated using the peak stress, steady-state
147
stress, or another stress at a certain strain. The peak stress is usually favored, because it is useful in
148
industrial production [32]. In this study, not all the peak stresses could be obtained. Therefore, the
149
steady-state stress was also used. Applying logarithm on both sides of Equations (1), (2), (3), and (4),
150
the new equations can be derived as follows:
151
lnε = n lnσ + lnA − , (5)
152
lnε = βσ + lnA − , (6)
153
lnε = nln sinh(ασ) + lnA − , (7)
154
ln sinh(ασ) = + lnε − . (8)
155
The slopes of curves of lnε vs. lnσ and σ represent the values of n and β, respectively, as
156
shown in Figure 3 (a) and (b). The value of α (= ) can also be calculated. The slope of curve of
157
ln sinh(ασ) vs. lnε is the value of n, as shown in Figure 3 (c). The slope of curve of ln sinh(ασ) vs.
158
is , and the intercept is lnε − , as shown in Figure 3 (d). Therefore, the values of Q and A can
159
161
Figure 3. Plots of (a) lnε vs. lnσ; (b) lnε vs. σ; (c) ln sinh(ασ) vs. lnε; (d) ln sinh(ασ) vs. .
162
Table 4. Constants and activation energy of the Fe-6.5wt.%Si alloy.
163
Parameter Value
α (MPa-1) 0.01
N 3.02
A (s-1) 8.24×10¹⁹
Q (kJ/mol) 410
The value of Q was 410 kJ/mol in the present study. Liang [22] reported that the activation
164
energy of the Fe-6.5wt.%Si alloy varies from 211 kJ/mol (at 800–1100 °C) to 478 kJ/mol (at 500–700
165
°C), depending on the crystalline structure and deformation temperature. Therefore, the constitutive
166
equation with the hyperbolic sine function, Equation (3), and Zener–Hollomon parameter, Equation
167
(4), is written as
168
ε = 8.24 × 10 sinh(0.01σ) . exp − , (9)
169
Z = εexp = 8.24 × 10 sinh 0.01σ . . (10)
170
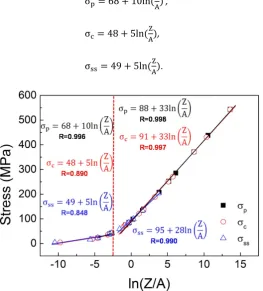
However, Kim [33] indicated that the peak stress could be expressed better as a function of
171
than as a function of Z. Moreover, the critical stress (σc) for DRX [34] and the steady-state stress (σss)
172
[33] could be also expressed as functions of . Figure 4 shows the relationship between stresses and
173
ln( ) of the Fe-6.5wt.%Si alloy. The stresses are expressed as a function of ln( ), and the
relationships can be expressed using linear equations. When the value of ln( ) is higher than ‒2.5,
175
the relationship between these stresses and the value of ln( ) can be written as
176
σ = 88 + 33ln( ), (11)
177
σ = 91 + 33ln( ), (12)
178
σ = 95 + 28ln( ). (13)
179
When the value of ln( ) is lower than −2.5, the equations can be written as
180
σ = 68 + 10ln( ) , (14)
181
σ = 48 + 5ln( ), (15)
182
σ = 49 + 5ln( ). (16)
183
184
Figure 4. Linear form of compression stress as functions of ln( ) for the Fe-6.5wt.%Si alloy.
185
When the value of ln( ) was lower than −2.5 (the shadowed areas of Tables 2 and 3), the
186
dynamic softening offset the work hardening, and the flow stress remained stable without a peak,
187
i.e., in the DRV mold, as observed in the curve indicating deformation at the temperature of 950 °C
188
and strain rates of 0.01 s-1 and 0.1 s-1, as shown in Figure 1 (a-b) and Table 2. According to Equations
189
(11)–(16), σc and σss could be expressed using σp as σ = σ = 0.7σ (ln < −2.5), or σ = σ ≈
190
σ (ln > −2.5).
191
3.3. Relationship between microstructures and Z parameters
192
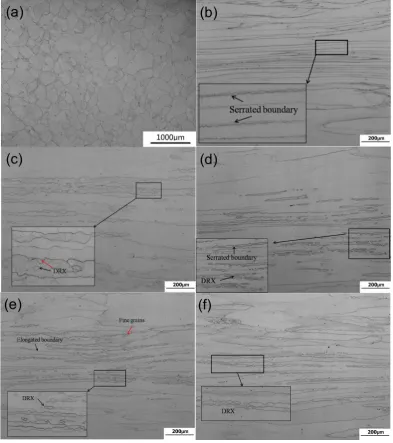
Figure 5 shows the microstructures before and after the deformation at the true strain of 1.6
193
under various deformation conditions. The original grains were equiaxed with the grain size of 400
194
of 650 °C, and strain rate of 0.01 s-1, a few serrated boundaries (indicated by a black arrow) appeared
196
in the deformation zones, and fibril-shaped vimineous grains also appeared. The elongated grains
197
were spread across all the deformation areas, as shown in the inset of Figure 5 (b). With the increase
198
of temperature to 750 °C, the content of the fibrous grains decreased. Some dynamically
199
recrystallized grains appeared inside the elongated grains (indicated by a red arrow) and along the
200
serrated boundaries (indicated by the black arrow) after deformation at the strain rate of 0.01 s-1, as
201
shown in Figure 5 (c). With the increase of strain rate to 0.1 s-1 at 750 °C, the degree of DRX
202
decreased, and the grain sizes of the dynamically recrystallized grains became refined. Moreover,
203
the elongation grains and serrated boundaries remained unchanged, as shown in Figure 5 (d). The
204
specimen was deformed at the temperature of 850 °C and strain rate of 1 s-1, some fibrous grains
205
disappeared, and irregular grain boundaries emerged, which indicated the initial stages of DRX
206
[35]. The nucleated fine grains (indicated by the red arrow) appeared, and some dynamically
207
recrystallized grains could be observed as shown in the inset of Figure 5 (e). Moreover, a few
208
elongated grains still existed in the Fe-6.5wt.%Si alloy. Figure 5 (f) shows the microstructure of the
209
specimen deformed at the temperature of 950 °C and strain rate of 10 s-1, which is similar to that
210
deformed at the temperature of 850 °C and strain rate of 1 s-1. The elongated grains and dynamically
211
recrystallized grains co-existed in the specimen. The serrated boundaries and straight boundaries
212
simultaneously existed in the deformation areas. In summary, higher temperature and lower strain
213
215
Figure 5. Microstructures of the Fe-6.5wt.%Si alloy (a) before and after deformation at the true strain
216
of 1.6 under various deformation conditions: (b) 650 °C and 0.01 s-1; (c) 750 °C and 0.01 s-1; (d) 750 °C
217
and 0.1 s-1; (e) 850 °C and 1 s-1; (f) 950 °C and 10 s-1.
218
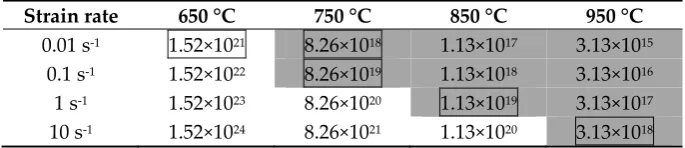
The Z parameters under various deformation conditions are listed in Table 5, which are
219
obtained from Equation (10). The values of Z in the frames correspond to the deformation conditions
220
discussed above (in the box in Table 5) and demonstrate that DRX occurs under certain conditions.
221
The dynamically recrystallized grains grow in the gray areas, which are zones of low Z values. It can
222
be concluded that, when the values of Z are lower than 1020 (the shadowed area in Table 5), DRX
223
occurs in the deformation areas. Especially, a lower value of Z usually corresponds to a higher
224
degree of DRX.
225
Table 5. Z parameters under various deformation conditions.
227
Strain rate 650 °C 750 °C 850 °C 950 °C
0.01 s-1 1.52×10²¹ 8.26×10¹⁸ 1.13×10¹⁷ 3.13×10¹⁵ 0.1 s-1 1.52×10²² 8.26×10¹⁹ 1.13×10¹⁸ 3.13×10¹⁶ 1 s-1 1.52×10²³ 8.26×10²⁰ 1.13×10¹⁹ 3.13×10¹⁷ 10 s-1 1.52×1024 8.26×10²¹ 1.13×10²⁰ 3.13×10¹⁸
3.4. Processing map
228
A PM based on the DMM is a very useful technique to investigate the deformation
229
characteristics of metallic materials and alloys. PMs combined with microstructure evolution are
230
beneficial to investigate the deformation mechanism, optimize the processing parameters, and
231
control the microstructures. PMs are created with a power dissipation map and an instability map.
232
The power dissipation map is drawn based on the value of power dissipation efficiency (η) at
233
various deformation temperatures and strain rates. The value of η can indicate the deformation
234
mechanism, such as DRV and DRX [36]. It can be calculated using the following equation:
235
η = , (17)
236
where m is the strain rate sensitivity parameter and is given as
237
m =
, . (18)
238
Generally, the microstructure transformation become more stable and secure and the
239
workability is improved with the increase of the value of η. Therefore, the deformation condition
240
with the maximum value of η is usually adopted in the processing. Processing instability may
241
become increasing during hot deformation. Prasad’s criterion [37] is an effective method to
242
distinguish whether an unstable flow occurs, and is given by
243
ξ(ε) = /( ) + m < 0. (19)
244
If ξ<0, the unstable flow occurs during the hot deformation, which is harmful to the material
245
processing. Depending on the value of ξ at various deformation temperatures and strain rates, the
246
instability map can be obtained. The optimized deformation temperature and strain rate can be
247
derived from the PMs based on the power dissipation map and instability map. The PMs at various
248
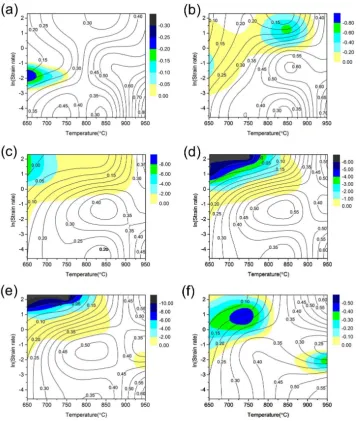
true strains are shown in Figure 6. The power dissipation efficiency is represented by the black line,
249
251
Figure 6. PMs of the Fe-6.5wt.%Si alloy at various true strains: (a) 0.2; (b) 0.4; (c) 0.6; (d) 0.7; (e) 0.8; (f)
252
1.0. The contour lines represent the values of the power dissipation efficiency. The colored areas and
253
bar charts represent the instability levels.
254
A high value of η is observed in the regions with high temperatures, and the unstable area lies
255
in the regions with low temperatures and high strain rates (Figure 6a). With the increase of strain
256
from 0.2 to 1.0, as indicated from Figure 6 (a) to (f), the value of η decreased in the region with high
257
temperatures and low strain rates, increased in the region with high temperatures and high strain
258
rates, and remained unchanged in the other regions. Furthermore, the unstable areas expanded, and
259
the unstable flow occurred even in the region with high temperature and low strain rate (Figure 6f),
260
when the reduction ratio increased. Notably, the unstable areas were relatively smaller in the PM at
261
the true strain of 0.7, and the values of η were between 0.4 and 0.6 in the stable regions, which can
262
be adopted in the rolling processing. The true strain of 0.7 corresponds to the reduction ratio of
263
approximately 50%, which is usually adopted in our rolling Fe-6.5wt.%Si alloy sheet because it
264
theoretically prove that the rolling reduction of 50% is favorable to the rolling stability of the
266
Fe-6.5wt.%Si alloy.
267
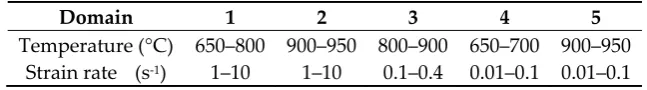
The PM at the true strain of 0.7 can be divided into five domains, as shown in Figure 7. The
268
deformation temperatures and strain rates corresponding to the five domains are presented in Table
269
6. The hot deformation is unstable (ξ<0) below 800 °C and above 1 s-1 (Domain 1), and the
270
representative sample was compressed at the temperature of 650 °C and strain rate of 10 s-1.
271
Conversely, some regions above 900 °C and below 0.1 s-1 are stable (ξ>0), where the values of η are
272
the highest, i.e., less than 0.6 (Domain 2, 5). These regions are considered as reasonable regions for
273
processing. The typical samples were deformed at the temperature of 950 °C and strain rate of 10 s-1
274
(Domain 2) and the temperature of 950 °C and strain rate of 0.01 s-1 (Domain 5). The values of η also
275
exhibited a peak in the temperature range of 800–900 °C and the strain rate range of 0.1–0.4 s-1
276
(Domain 3), and reached 0.55; further, the typical sample was compressed at the temperature of 850
277
°C and strain rate of 0.2 s-1. Other regions (Domain 4) below 800 °C and below 0.1 s-1 were also
278
stable, but the power dissipation efficiency was lower (η<0.35), and the specimen was deformed at
279
the temperature of 650 °C and strain rate of 0.01 s-1.
280
281
Figure 7. Labeled PMs of the Fe-6.5wt.%Si alloy at the true strain of 0.7.
282
Table 6. Temperatures and strain rates corresponding to the five domains.
283
Domain 1 2 3 4 5
Temperature (°C) 650–800 900–950 800–900 650–700 900–950 Strain rate (s-1) 1–10 1–10 0.1–0.4 0.01–0.1 0.01–0.1
3.5. Optimization of processing parameters
284
The optimized processing parameters can be obtained depending on the PM. The processing
285
parameters are chosen from the region with high power dissipation efficiency and stability.
286
However, micro-cracking often occurs when the power dissipation efficiency is excessively high
287
(η>0.6). In general, DRX is the best choice for hot deformation in order to acquire good mechanical
288
properties and proper microstructure. As the power dissipation efficiency is suitable (0.5≤η≤0.55, for
289
high stacking fault energy materials), and hot deformation is stable [37], the deformation conditions
290
in Domains 2, 3, and 5 are the theoretically optimized processing parameters for the Fe-6.5wt.%Si
291
0.01–10 s-1, respectively, or 800–900 °C and below 0.4 s-1, respectively. However, the ordered
293
structures and ordering degree also influence the mechanical property [38]. Therefore, the surface
294
quality, microstructures, and ordered structures should be investigated to verify the validity of the
295
theoretical parameters.
296
Figure 8 shows the specimens before and after deformation at the true strain of 0.7 under
297
various deformation conditions (corresponding to the five domains). It is observed that the
298
specimen was distinctly unstable during hot deformation at the temperature of 650 °C and strain
299
rate of 10 s-1 (Domain 1, the unstable region). The shape of the specimen was barreled after
300
deformation at the temperature of 650 °C and strain rate of 0.01 s-1 (Domain 4, the region with low
301
power dissipation efficiency), but the compression surfaces were non-parallel. Others (Domains 2, 3,
302
and 5; the region with high power dissipation efficiency and stability) deformed stably, and no crack
303
or deformation instability appeared.
304
305
Figure 8. Specimens before and after deformation at the true strain of 0.7 under various deformation
306
conditions.
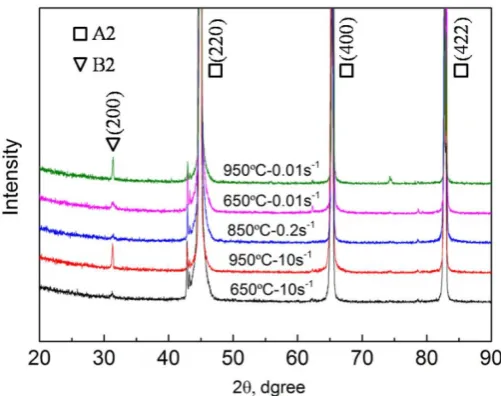
307
Figure 9 shows the XRD patterns of the specimens after deformation at the true strain of 0.7
308
under various conditions. The peak corresponding to (200) is a characteristic reflection peak of the
309
B2 structure. It is observed in Figure 9 that the B2 ordered phase and A2 disordered phase were
310
present in all the specimens, whereas the D03 ordered phase was not formed. Li [39, 40] reported
311
that the D03 ordered phase is extremely harmful to the mechanical property of the Fe-6.5wt.%Si
312
alloy. However, the B2 structures have little effect on the mechanical property. Therefore, the five
313
kinds of deformation conditions are considered feasible from the analysis of surface quality and
314
ordered phases.
315
316
The Z parameters corresponding to the five domains are listed in Table 7. As the previous
318
discussion and conclusion indicated, with the values of Z lower than 1020, DRX occurs in the
319
deformation areas. A lower value of Z often indicates a higher degree of DRX. Theoretically, very
320
few dynamically recrystallized grains would appear in Domains 1 and 4, according to Table 7.
321
Owing to the values of Z lower than 1020, DRX occurs in Domains 2, 3, and 5. The investigation of
322
each domain is described in detail as follows.
323
Table 7. Z values corresponding to the five domains.
324
Domain 1 2 3 4 5
Sample 650 °C×10 s-1 950 °C×10 s-1 850 °C×0.2 s-1 650 °C×0.01 s-1 950 °C×0.01 s-1
Z 1.5×1024 3.1×10¹⁸ 2.3×10¹⁸ 1.5×10²¹ 3.1×10¹⁵
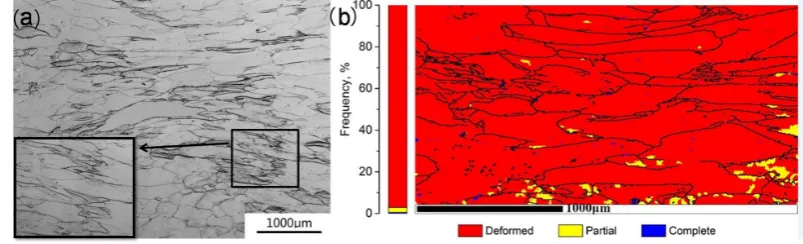
Domain 1 indicates low power dissipation efficiency (0<η<0.2) and very high instability
325
(ξ<-0.2), and is a highly unstable region in the PM. Figure 10 shows the corresponding
326
microstructure and recrystallized fraction at the true strain of 0.7. The elongated grains were spread
327
across all the deformation areas, and no DRX was observed in the inset of Figure 10 (a). The content
328
of complete recrystallization (high-angle grain boundaries, misorientation angle θ >15˚) was
329
approximately 0, as shown in Figure 10 (b). The content of partial recrystallization (low-angle grain
330
boundaries, 15˚ θ >3˚) occurring in the marginal area reached only 2.37%. The deformed grains
331
occupied almost the entire region. Thus, the deformation conditions of Domain 1 are not
332
appropriate for the Fe-6.5wt.%Si alloy.
333
334
Figure 10. (a) Microstructure; (b) recrystallized fractions of Domain 1 at the true strain of 0.7.
335
Domain 2 indicates high power dissipation efficiency (0.4<η<0.55) and low instability (ξ>0),
336
and is a very stable region in the PM. Figure 11 shows the microstructure and recrystallized fraction
337
of the specimen deformed at the true strain of 0.7, temperature of 950 °C, and strain rate of 10 s-1.
338
The deformed grains almost disappeared, and DRX occurred in the deformation area, as shown in
339
Figure 11 (a). However, a small number of elongated grains still existed in the deformation region.
340
The recrystallized fraction including complete and partial recrystallization reached 68.62%, and the
341
content of deformed grains was almost 30%, as shown in Figure 11 (b). Therefore, these
342
344
Figure 11. (a) Microstructure; (b) recrystallized fractions of Domain 2 at the true strain of 0.7.
345
Domain 3 also indicates high power dissipation efficiency (0.4<η<0.55) and low instability
346
(ξ>0), and is a very stable region. The specimen was deformed at the temperature of 850 °C and
347
strain rate of 0.2 s-1. Figure 12 shows the microstructure and recrystallized fraction of the specimen
348
at the true strain of 0.7. The deformed grains could be observed in the center area (indicated by the
349
black arrow), and a few fine recrystallized grains were formed in this region (indicated by the red
350
arrow), as shown in Figure 12 (a). The DRX fraction was 31%, and the content of deformed grains
351
reached 70%, as shown in Figure 11 (b). These deformation parameters of Domain 3 are applicable
352
for the Fe-6.5wt.%Si alloy.
353
354
Figure 12. (a) Microstructure; (b) recrystallized fractions of Domain 3 at the true strain of 0.7.
355
Domain 4 reveals a medium power dissipation efficiency (0.2<η<0.35) and low instability (ξ>0),
356
and is a stable region. Figure 13 shows the microstructure and recrystallized fraction of this
357
specimen. The microstructure of this specimen was similar to that deformed at the temperature of
358
650 °C and strain rate of 0.01 s-1. It can be observed that the center region was filled with elongated
359
grains, and small deformation grains occupied the corner region, as shown in Figure 13 (a). The
360
complete DRX fraction in Domain 4 was similar to that in Domain 1, but the partial DRX fraction
361
was 20%, which occurred in the marginal area. The content of deformed grains reached 80%, as
362
364
Figure 13. (a) Microstructure; (b) recrystallized fractions of Domain 4 at the true strain of 0.7.
365
Domain 5 indicates high power dissipation efficiency (0.45<η<0.6) and low instability (ξ>0),
366
and is a very stable region in the PM. Figure 14 shows the corresponding microstructure and DRX
367
content at the true strain of 0.7. It can be observed that no deformed grains appeared in this region,
368
which was filled with DRX grains, as shown in Figure 14 (a). The content of complete DRX was
369
21%, and the partial DRX fraction reached 66%, as shown in Figure 14 (b). The degree of deformed
370
grains was only approximately 10%. Thus, the deformation conditions of Domain 5 are very
371
favorable to the Fe-6.5wt.%Si alloy.
372
373
Figure 14. (a) Microstructure; (b) recrystallized fractions of Domain 5 at the true strain of 0.7.
374
Based on the analysis of surface quality, microstructures, and ordered structures, it can be
375
concluded that the Fe-6.5wt.%Si alloy is unstable under the deformation conditions of Domain 1.
376
The order of Z corresponding to the five specimens is 3.1×10¹⁵ (Domain 5) <2.3×10¹⁸ (Domain 3)
377
<3.1×10¹⁸ (Domain 2) <1.5×10²¹ (Domain 4) <1.5×1024 (Domain 1), and the order of the DRX fractions
378
is 88% (Domain 5) >69% (Domain 2) >31% (Domain 3) >21% (Domain 4) >3% (Domain 1). DRX
379
occurred in the deformation areas where the value of Z was lower than 1020. The processing
380
parameters of Domains 2 and 5 are very favorable to the Fe-6.5wt.%Si alloy, and those of Domain 3
381
are applicable. Therefore, the optimized processing parameters for the Fe-6.5wt.%Si alloy are the
382
temperature and strain rate of more than 900 °C and 0.01–10 s-1 , respectively, or 800–900 °C and less
383
than 0.4 s-1, respectively, according to the PMs and the analysis of the surface quality, ordered
384
phases, and microstructures.
385
4. Conclusions
386
The flow behavior of the Fe-6.5wt.%Si alloy during hot compression was investigated at
387
temperatures ranging from 650–950 °C and strain rates ranging from 0.01–10 s-1. PMs were
388
(1) The activation energy of the Fe-6.5wt.%Si alloy was 410 kJ/mol at 650–950 °C. The constitutive
390
equation with the hyperbolic sine function and Zener–Hollomon parameter is written as: Z =
391
εexp = 8.24 × 10 sinh 0.01σ . .
392
(2) A linear relationship between the flow stress (σp, σc, σss) and the value of ln( ) was derived. In
393
addition, σc and σss could be expressed using σp as σ = σ = 0.7σ (ln < −2.5), or σ = σ ≈
394
σ (ln > −2.5).
395
(3) DRX occurred at the deformation areas with the values of Z lower than 1020. Especially, a lower
396
value of Z usually corresponds to a higher degree of DRX.
397
(4) The value of η decreased in the region with high temperature and low strain rate, increased in the
398
region with high temperature and high strain rate, and remained constant in other regions with
399
the increase of true strain. Furthermore, the unstable areas expanded.
400
(5) The microstructure and formability of the Fe-6.5wt.%Si specimen were consistent with the PM.
401
The unstable areas were relatively small in the PM at the true strain of 0.7, and the values of η
402
were relatively high (0.4<0.6) in the stable regions. Very high DRX contents were observed in the
403
stable regions with high power dissipation efficiency.
404
(6) This study demonstrated that the true strain of 0.7 corresponds to the optimum reduction for
405
compressing the Fe-6.5wt.%Si alloy. The optimized processing parameters are the temperature
406
and strain rate of more than 900 °C and 0.01–10 s-1, respectively, or 800–900 °C and less than 0.4
407
s-1, respectively.
408
Acknowledgments: Financial supports from the Natural Science Foundation of China (51471031, U1660115)
409
and the State Key Laboratory for Advanced Metals and Materials (2016Z-17) are gratefully acknowledged.
410
Author Contributions: Shibo Wen conceived, designed and performed the experiments; Chaoyu Han and Bao
411
zhang contributed to the EBSD work; Shibo Wen wrote the manuscript; Yongfeng Liang, Feng Ye and Junpin
412
Lin supervised the work.
413
References
414
1. Arai, K.; Tsuya, N. Ribbon-form silicon-iron alloy containing around 6.5 percent silicon. IEEE. Trans.
415
Magn. 1980, 16, 126-129, 10.1109/TMAG.1980.1060560.
416
2. Narita, K.; Teshima, N.; Mori, Y.; Enokizono. M. Recent researches on high silicon-iron alloys. IEEE. Trans.
417
Magn. 1981, 17, 2857-2862, 10.1109/TMAG.1981.1061740.
418
3. Bozorth, R.M. Ferromagnetism, Van Nostrand, New York, 1951; pp. 50-52, 0-7803-1032-2.
419
4. Raviprasad, K.; Tenwick, M.; Davies, H.A.; Chattopadhyay, K. The nature of ordered structures in melt
420
spun iron-silicon alloys. Scripta. Mater. 1986, 20, 1265-1270, 10.1016/0036-9748(86)90045-1.
421
5. Raviprasad, K.; Chattopadhyay, K. The influence of critical points and structure and microstructural
422
evolution in iron rich Fe-Si alloys. Acta. Metall. 1993, 41, 609-624, 10.1016/0956-7151(93)90091-6.
423
6. Takada, Y.; Abe, M.; Masuda, S.; Inagaki, J. Commercial scale production of Fe-6.5wt.% Si sheet and its
424
magnetic properties. J. Appl. Phys. 1988, 64, 5367-5369, 10.1063/1.342373.
425
7. Ros-Yanez, T.; Houbaert, Y.; Gómez Rodrı́guez, V. High-silicon steel produced by hot dipping and
426
diffusion annealing. J. Appl. Phys. 2002, 91, 7857-7859, 10.1063/1.1449445.
427
8. He, X.D.; Li, X.; Sun, Y. Microstructure and magnetic properties of high silicon electrical steel produced by
428
electron beam physical vapor deposition. J. Magn. Magn. Mater. 2008, 320, 217-221,
429
10.1016/j.jmmm.2007.05.030.
430
9. Machado, R.; Kasama, A.H.; Jorge, A.M.; Kiminami, C.S.; Fo, W.B.; Bolfarini, C. Evolution of the texture of
431
spray-formed Fe-6.5wt.% Si-1.0wt.% Al alloy during warm-rolling. Mater. Sci. Eng. A. 2007, 449, 854-857,
432
10.1016/j.msea.2006.03.132.
433
10. Lima, C.C.; Da Silva, M.C.A.; Sobral, M.D.C.; Coelho, R.E.; Bolfarini, C. Effects of order–disorder reactions
434
on rapidly quenched Fe-6.5%Si alloy. J. Alloys. Compd. 2014, 586, S314-S316, 10.1016/j.jallcom.2012.09.074.
435
11. Fish, G.E.; Chang, C.F.; Bye, R. Frequency dependence of core loss in rapidly quenched Fe-6.5 wt.% Si. J.
436
12. Liang, Y.F.; Wang, S.; Li, H.; Jiang, Y.M.; Ye, F. Fabrication of Fe-6.5wt%Si ribbons by melt spinning
438
method on large scale. Adv. Mater. Sci. Eng. 2015, 1-5, 10.1155/2015/296197.
439
13. Wang, S.; Jiang, Y.M.; Liang, Y.F.; Ye, F.; Lin, J.P. Magnetic properties and core loss behavior of
440
Fe-6.5wt.%Si ribbons prepared by melt spinning. Adv. Mater. Sci. Eng. 2015, 1-6, 10.1155/2015/410830.
441
14. Li, R.; Shen, Q.; Zhang, L.; Zhang, T. Magnetic properties of high silicon iron sheet fabricated by direct
442
powder rolling. J. Magn. Magn. Mater. 2004, 281, 135-139, 10.1016/j.jmmm.2004.04.098.
443
15. Liang, Y.F.; Ye, F.; Lin, J.P.; Wang, Y.L.; Chen, G.L. Effect of annealing temperature on magnetic properties
444
of cold rolled high silicon steel thin sheet. J. Alloys. Compd. 2010, 491, 268-270, 10.1016/j.jallcom.2009.10.118.
445
16. Patterson, E.E.; Field, D.P.; Zhang, Y. Characterization of twin boundaries in an Fe-17.5Mn-0.56C twinning
446
induced plasticity steel. Mater. Charact. 2013, 85, 100-110, 10.1016/j.matchar.2013.08.016.
447
17. Liang, Y.F.; Ye, F.; Lin, J.P.; Wang, Y.L.; Zhang, L.Q.; Chen, G.L. Effect of heat treatment on mechanical
448
properties of heavily cold-rolled Fe-6.5 wt% Si alloy sheet. Sci. China Technol. Sci. 2010, 53, 1008-1011,
449
10.1007/s11431-010-0125-1.
450
18. Haghdadi, N.; Zarei-Hanzaki, A.; Abedi, H.R. The flow behavior modeling of cast A356 aluminum alloy at
451
elevated temperatures considering the effect of strain. Mater. Sci. Eng. A. 2012, 535, 252-257,
452
10.1016/j.msea.2011.12.076.
453
19. Samantaray, D.; Mandal, S.; Jayalakshmi, M.; Athreya, C.N.; Bhaduri, A.K.; Sarma, V.S. New insights into
454
the relationship between dynamic softening phenomena and efficiency of hot working domains of a
455
nitrogen enhanced 316L (N) stainless steel. Mater. Sci. Eng. A. 2014, 598, 368-375,
456
10.1016/j.msea.2013.12.105.
457
20. Li, H.; Liang, Y.F.; Yang, W.; Ye, F.; Lin, J.P.; Xie, J.X. Disordering induced work softening of Fe-6.5wt%Si
458
alloy during warm deformation. Mater. Sci. Eng. A. 2015, 628, 262-268, 10.1016/j.msea.2015.01.058.
459
21. Niu, C.S.; Wang, Y.L.; Lin, J.P.; Lin, Z.; Chen, G.L. Dynamic recrystallization mechanisms of Fe3Si based
460
alloys. Trans. Mater. Heat Treatment. 2003, 24, 28-32, 10.3969/j.issn.1009-6264.2003.01.005.
461
22. Liang, Y.F.; Ge, J.W.; Fang, X.S.; Ye, F.; Lin, J.P. Hot deformation behavior and softening mechanism of
462
Fe-6.5wt% Si alloy. Mater. Sci. Eng. A. 2013, 570, 8-12, 10.1016/j.msea.2013.01.070.
463
23. Wang, Y.; Jiang, S.Y.; Zhang, Y.Q. Processing map of NiTiNb shape memory alloy subjected to plastic
464
deformation at high temperatures. Metals, 2017, 7, 328, 10.3390/met7090328.
465
24. Wu, J.; Lü, Z.D.; Zhang, C.J.; Han, J.C.; Zhang, H.Z.; Zhang, S.Z.; Hayat, M.; Cao, P. Investigation of the
466
deformation mechanism of a near β titanium alloy through isothermal compression. Metals, 2017, 7, 498,
467
10.3390/met7110498.
468
25. Ryan, N.D.; McQueen, H.J.; Evangelista, E. Dynamic recovery and strain hardening in the hot deformation
469
of type 317 stainless steel. Mater. Sci. Eng. 1986, 81, 259-272, 10.1016/0025-5416(86)90267-3.
470
26. Mirzadeh, H.; Cabrera, J.M.; Najafizadeh, A. Modeling and prediction of hot deformation flow curves.
471
Metall. Mate. Trans. A. 2012, 43, 108-123, 10.1007/s11661-011-0836-3.
472
27. Poliak, E.I.; Jonas, J.J. A one-parameter approach to determining the critical conditions for the initiation of
473
dynamic recrystallization. Acta. Mater. 1996, 44, 127-136, 10.1016/1359-6454(95)00146-7.
474
28. Xiang, L.; Tang, B.; Xue, X.Y.; Kou, H.C.; Li, J.S. Characteristics of the dynamic recrystallization behavior
475
of Ti-45Al-8.5 Nb-0.2 W-0.2 B-0.3 Y alloy during high temperature deformation. Metals, 2017, 7, 261,
476
10.3390/met7070261.
477
29. Sellars, C.M.; McTegart, W.J. On the mechanism of hot deformation. Acta. Metall. 1966, 14, 1136-1138,
478
10.1016/0001-6160(66)90207-0.
479
30. Jonas, J.J.; Sellars, C.M.; Tegart, W.M. Strength and structure under hot-working conditions. Met. Rev. 1969,
480
14, 1-24, 10.1179/mtlr.1969.14.1.1.
481
31. Zener, C.; Hollomon, J.H. Effect of strain rate upon plastic flow of steel. J. Appl. Phys. 1944, 15, 22-32,
482
10.1063/1.1707363.
483
32. McQueen, H.J.; Ryan, N.D. Constitutive analysis in hot working. Mater. Sci. Eng. A. 2002, 322, 43-63,
484
10.1016/S0921-5093(01)01117-0.
485
33. Kim, S.I.; Yoo, Y.C. Prediction of dynamic recrystallisation behaviour of AISI type 4140 medium carbon
486
steel. Mater. Sci. Technol. 2013, 18, 160-164, 10.1179/026708301125000375.
487
34. Babu, K.A.; Mandal, S.; Athreya, C.N.; Shakthipriya, B.; Sarma, V.S. Hot deformation characteristics and
488
processing map of a phosphorous modified super austenitic stainless steel. Mater. Design. 2017,
489
35. Han, Y.; Liu, G.; Zou, D.; Liu, R.; Qiao, G. Deformation behavior and microstructural evolution of as-cast
491
904L austenitic stainless steel during hot compression. Mater. Sci. Eng. A. 2013, 565, 342-350,
492
10.1016/j.msea.2012.12.043.
493
36. Raj, R. Development of a processing map for use in warm-forming and hot-forming processes. Metall.
494
Mate. Trans. A. 1981, 12, 1089-1097, 10.1007/BF02643490.
495
37. Prasad, Y. Recent advances in the science of mechanical processing. Indian. J. Technol. 1990, 28, 435-451.
496
38. Lin, J.P.; Ye, F.; Chen, G.L.; Wang, Y.L.; Liang, Y.F.; Jin, J.N.; Liu, Y. Fabrication technology,
497
microstructures and properties of Fe-6.5wt.%Si alloy sheets by cold rolling. Front. Sci. 2007, 13-26,
498
10.3969/j.issn.1673-8128.2007.02.003.
499
39. Li, H.; Liang, Y.F.; Ye, F. Effect of heat treatment on ordered structures and mechanical properties of
500
Fe-6.5mass%Si alloy. Mater. Trans. 2015, 56, 759-765, 10.2320/matertrans.M2014451.
501
40. Li, H.; Liang, Y.F.; He, R.Q.; Lin, J.P.; Ye, F. Ordered structure and mechanical properties of Fe-6.5%Si alloy