Journal of Criminal Law and Criminology
Volume 82
Issue 1
Spring
Article 4
Spring 1991
Are There Multiple Paths to Delinquency
David Huizinga
Finn-Aage Esbensen
Anne Wylie Weiher
Follow this and additional works at:
https://scholarlycommons.law.northwestern.edu/jclc
Part of the
Criminal Law Commons
,
Criminology Commons
, and the
Criminology and Criminal
Justice Commons
This Criminal Law is brought to you for free and open access by Northwestern University School of Law Scholarly Commons. It has been accepted for inclusion in Journal of Criminal Law and Criminology by an authorized editor of Northwestern University School of Law Scholarly Commons.
Recommended Citation
0091-4169/91/8201-0083
THEJOURNAL OF CRIMINAL LAW & CRIMINOLOGY Vol. 82, No. I
Copyright @ 1991 by Northwestern University, School of Law Printed in U.S.A.
ARE THERE MULTIPLE PATHS
TO DELINQUENCY?*
DENVER YOUTH SURVEY**
DAVID HUIZINGA
FINN-AAGE ESBENSEN
ANNE WYLIE WEIHER
ABSTRACT
Criminological research and theory generally proceed with the orientation, if not the assumption, that delinquency is the result of some series of events common to all delinquents. While some atten-tion has been given to the concepts of typologies, multiple pathways, and different developmental sequences leading to different outcomes, rarely have these concepts been pursued empirically. This paper uses
* This research was supported by grants from the Office of Juvenile Justice and Delinquency Prevention, U.S. Department of Justice (Grant No. 86-JN-CX-0006) and the National Institute of Drug Abuse (Grant No. RO-DA-05183). Points of view or opinions expressed in this paper are those of the authors and do not necessarily represent the official position or policies of these agencies.
We are indebted to Linda P. Cunningham, Meg Dyer, Amanda Elliott, Linda K. Kuhn, Judy Armstrong Laurie, Deantha Ashby Menon,-Judy D. Perry, and Silvia Portillo,
the dedicated research staff, without whom the data could never have been collected,
nor the data so meticulously prepared for analysis.
** David Huizinga is a Research Associate at the Institute of Behavioral Science at the University of Colorado. Over the past several years, he has been involved in research on social problems and currently is Co-principle Investigator of the National Youth Survey and Principle Investigator of the Denver Youth Survey, which are longitudinal studies of the causes and correlates of delinquency, drug use, and other social problems. Recent publications have appeared in Criminology,Justice Quarterly,Journal of Research in Crime and
Delinquency, and Social Science Research. He also recently co-authored Multiple Problem Youth (with Delbert Elliott and Scott Menard).
Finn-aage Esbensen is a Research Associate at the Institute of Behavioral Science at the University of Colorado. He is currently an Investigator on the Denver Youth Survey, a longitudinal survey on the causes and correlates of delinquency, drug use, and other social problems. Recent publications have appeared injustice Quarterly, Quality and
Quan-tity, and the American Journal of Police. He recently co-authored Criminology: Explaining Crime and Its Context (with Stephen E. Brown and Gilbert Geis).
DENVER YOUTH SURVEY
a typological approach to make a preliminary examination of the exist-ence of multiple paths leading to delinquency. Data from the first two annual surveys of the Denver Youth Survey provide the basis for the analyses. The results support the notion that there is typological di-versity in the backgrounds of youth who become delinquent, a diver-sity which, perhaps, should not be ignored.
I. INTRODUCTION
The idea that there are multiple pathways to delinquency is not new. Many researchers have expressed the notion that the underly-ing causes leadunderly-ing to participation in delinquent behavior may be different for different individuals or for different types of individu-als. Gibbons, I for example, referred to the existence of separate eti-ological accounts for different offenders and, perhaps, for different types of offenses. Loeber and Le Blanc2 described different devel-opmental sequences leading to delinquency, and Elliott, Ageton, and Canter,3 in their theoretical formulation, used the terminology of multiple etiologies or multiple paths. Similarly, Farrington, Oh-lin, and Wilson4 discussed the role of different causal patterns and individual differences leading to delinquency. More akin to the ap-proach used in this paper, Huizinga5 and Brennan and Huizinga6 relied upon dynamic typologies to describe the relationship across time between kinds of individuals, patterns of delinquent behavior and patterns of theoretically postulated causal variables. To some extent, the notions that the causes of any one behavioral act are complex and that no one theoretical orientation is likely to explain the delinquent acts of all individuals underlie the concept of multi-ple paths. On the other hand, the belief remains that these acts are not so dependent on such unique factors and situations that gener-alizations to certain groups or types of individuals are impossible. Some youth, for example, run away from home because of a poor family environment, some run away because they are pushed out from their homes, others run away for fun and excitement, and still
1 Gibbons, The Assumption of the Efficacy of Middle-Range Explanations: Typologies, in THEORETICAL METHODS IN CRIMINOLOGY 151 (R. Meier ed. 1985).
2 Loeber & Le Blanc, Toward a Developmental Criminology, in 12 CRIME & JUST.: A REVIEW OF RES. 375 (M. Tonry & N. Morris eds. 1990).
3 Elliott, Ageton & Canter, An Integrated Theoretical Perspective on Delinquent Behavior,
16J. RES. IN CRIME & DELINQ. 27 (1979).
4 D. FARRINGTON, L. OHLIN &J. WILSON, UNDERSTANDING AND CONTROLLING CRIME:
TOWARDS A NEW RESEARCH STRATEGY (1986).
5 D. Huizinga, Dynamic Typologies: A Means of Exploring Multivariate Data (1979)
(paper presented at the Classification Society Meetings, Gainesville, FL).
6 Brennan & Huizinga, The Social Psychology of Runaways, 3 CLASSIFICATION SOC'Y
BULL. (1976).
PATHWAYS TO DELINQUENCY?
others run away because they are "over-bonded" and over-pro-tected at home.7 Similarly, one might anticipate that some youth steal for different reasons, that some youth engage in violent behav-ior for different reasons, and that some youth use drugs for different reasons.
Recent empirical research indicates the potential importance of examining multiple paths. For example, research reviewed by Loeber8 suggests that there may be different developmental se-quences leading to delinquency among different age groups. Hill and Crawford9 reported evidence of the importance of different variables in predicting involvement in criminal behavior among black and white women. Seydlitz'° found that there may be an age and gender interaction in the relationship between parental attach-ment and delinquency. Similarly, Bailey and HubbardI' found evi-dence that factors influencing the initiation of marijuana use may vary by age. Finally, Elliott, Huizinga', and Ageton12 discussed the finding that a non-linear interaction exists in pro-social and delin-quent bonding leading to delinquency.
Although criminologists historically have been interested in the notion of multiple pathways leading to delinquency, little major the-oretical or empirical work exploring this possibility has been under-taken. In addition, where researchers have tested for multiple pathways, the pathways usually are not well specified or are limited to a few variables. This lack of empirical attention to potential mul-tiple pathways raises both theoretical and methodological issues.
Most theoretical presentations, including those integrated mod-els that expand the conceptual base to include a wider range of the-oretically important variables in a single model, seem to suggest that the effects of the causal variables work more or less the same for everyone. These presentations of omnibus models rarely attempt to consider the possibility that there may be multiple types of offenders with different patterns of offending and different developmental
se-7 T. BRENNAN, D. HUIZINGA & D. ELLIOTr, THE SOCIAL PSYCHOLOGY OF RUNAWAYS
(1978) [hereinafter T. BRENNAN, RUNAWAYS]; D. FINKELHOR, G. HOTALING & A. SEDLAK, MISSING, ABDUCTED, RUNAWAY, AND THROWNAWAY CHILDREN IN AMERICA (monograph
prepared for Office of Juvenile Justice and Delinquency Prevention, 1990).
8 Loeber, Development and Risk Factors ofJuvenile Antisocial Behavior and Delinquency, 10
CLINICAL PSYCHOLOGY REV. 1 (1990).
9 Hill & Crawford, Women, Race, and Crime, 28 CRIMINOLOGY 601 (1990).
10 Seydlitz, The Effects of Gender, Age, and Parental Attachment on Delinquency: A Test for
Interactions, 10 SOC. SPECTRUM 209 (1990).
I1 Bailey & Hubbard, Developmental Variation in the Context of Marijuana Initiation among
Adolescents, 31 J. HEALTH & SOC. BEHAV. 58 (1990).
12 D. ELLIOTT, D. HUIZINGA & S. AGETON, EXPLAINING DELINQUENCY AND DRUG USE
DENVER YOUTH SURVEY
quences associated with the onset, maintenance, or termination of involvement in delinquent behavior. It must be recognized, how-ever, that the development of sound theoretical statements is no simple task; it requires a great deal of effort and innovative thought. The addition of multiple types or pathways increases the order of complexity of the theoretical models. However, if multiple path-ways do exist, our explanation of delinquent behavior is incomplete if they are not taken into account. An important theoretical concern thus arises. Is there one underlying constellation of variables lead-ing to delinquency that works more or less the same for everybody, or are there subsets of individuals, each subset having a common background and experience, for which the variables work differ-ently? That is, are there different pathways to delinquent behavior? One methodological issue raised by the notion of multiple path-ways is how such pathpath-ways are to be identified (presuming that they exist) using empirical data. Most of the current data analysis strate-gies used in examining theories of delinquency are designed to con-sider either all individuals as responding to theoretical variables in much the same way or all members of pspecified subgroups as re-sponding in the same way. That is, current analytic procedures are not designed to search for and identify types of individuals with dif-ferent pathways to delinquency, or to identify the difdif-ferent
covari-ance matrices involving non-linear interactions for different unspecified and unknown subgroups. Thus, it is unclear what "off-the-shelf" or "canned" analytical procedure can be used. While it conceivably might be possible to identify all the various pathways potentially specified in a theory, in practice, allowing for even a few bisected theoretical variables at a few points in time results in a plethora of types of individuals and raises other analytic issues as well.
PATHWAYS TO DELINQUENCY?
dictum that "nosology precedes etiology."' 3
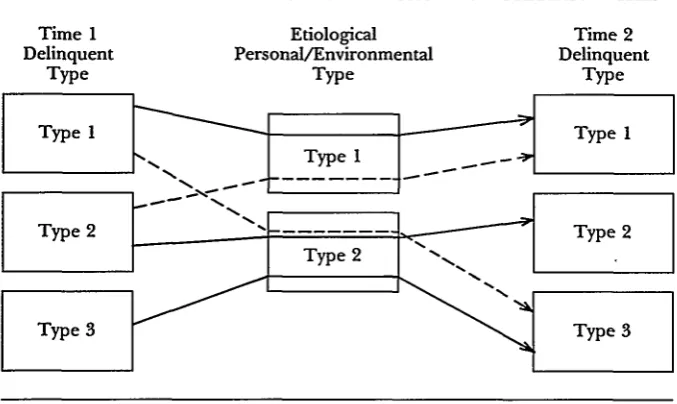
The data used in this paper come from the Denver Youth Sur-vey, an ongoing longitudinal study of the development of problem behavior among children and youth. The survey is a part of the Of-fice of Juvenile Justice and Delinquency Prevention's Program of Research on the Causes and Correlates of Delinquency. The taxo-nomic approach used employs a typology of children and youth based on their delinquent behavior at time 1, a typology of these individuals based on a set of theoretical factors that include both personal and environmental characteristics, and a final typology based on delinquent behavior at time 2. A simplified illustration is provided in Figure 1. This approach allows examination of poten-tially complex non-linear interactions in etiological variables as in-fluences on the onset of delinquency as well as on increases or decreases in delinquent behavior. We seek to determine whether relatively distinct types of etiological environments exist that lead to initiation or changes in delinquent involvement. Although this ex-amination uses a path that is "only one step long," given the current state of knowledge about multiple paths, it seems reasonable at this stage to keep things relatively simple.
FIGURE 1
ILLUSTRATION OF A TAXONOMIC APPROACH TO MULTIPLE PATHS
Time 1 Etiological Time 2 Delinquent Personal/Environmental Delinquent
Type Type Type
13 Cattell, Factor Analysis: An Introduction to the Essentials, 21 BIOMETRIcs 405 (1965).
[image:6.454.53.392.349.551.2]DENVER YOUTH SURVEY
II. THE DENVER YOUTH SURVEY
A. GENERAL DEVELOPMENTAL MODEL
The primary objective of The Denver Youth Survey (DYS) is to identify those social conditions, personal characteristics, social in-teractions, and developmental processes which are causally linked to the initiation, maintenance, and termination of delinquent behavior, drug use, and other problem behavior. The research is directed by a multidisciplinary theoretical paradigm which integrates variables typically employed by different academic disciplines. The explana-tory model includes measures reflecting physiological, psychologi-cal, and social development; personal attributes and personality; primary socialization contexts such as the family and peer groups; social roles and role transitions; and the culture and social structure of larger social systems such as schools, neighborhoods, and com-munities. The measures of delinquency and crime, the primary de-pendent measures for the study, include both self-reported criminal behavior and arrests.
The scope of this study exceeds the limits of existing concep-tual models concerning the etiology of crime and delinquency. To our knowledge, no existing general paradigm incorporates the full range of variables included in this study into a coherent explanation of delinquent behavior. A major thrust of theoretical work over the past decade has been toward the integration and synthesis of smaller-range theories. Some of this integration has already been accomplished and the integrated models are well supported.14 Our
14 R. AKERS, DEVIANT BEHAVIOR: A SOCIAL LEARNING PERSPECTIVE (1977); D. ELLI-oTr, EXPLAINING DELINQUENCY, supra note 12; R. JESSOR & S. JESSOR, PROBLEM BEHAVIOR AND PSYCHOSOCIAL DEVELOPMENT: A LONGITUDINAL STUDY OF YOUTH (1977); R.
JOHN-SON, JUVENILE DELINQUENCY AND ITS ORIGINS (1979); Cernkovich, Evaluating Two Models
of Delinquency Causation: Structural Theory and Control Theory, 16 CRIMINOLOGY 335 (1978); CongerJuvenile Delinquency: Behavior Restraint or Behavior Facilitation?, in UNDERSTANDING
CRIME: CURRENT THEORY AND RESEARCH 131 (T. Hirschi & M. Gottfredson eds. 1980); Conger, From Social Learning to Criminal Behavior, in CRIME, LAW AND SANCTIONS: THEO-RETICAL PERSPECTIVES 91 (M. Krohn & R. Akers eds. 1978); Conger, Social Control and
Social Learning Models of Delinquent Behavior: A Synthesis, 14 CRIMINOLOGY 17 (1976);
Elli-ott, The Assumption that Theories Can be Combined With Increased Explanatory Power: Theoretical
Integrations, in THEOORETICAL METHODS IN CRIMINOLOGY (R. Meier ed. 1985); Hepburn, Testing Alternative Models of Delinquency Causation, 67 J. CRIM. L. & CRIMINOLOGY 450
(1977); Linden & Hackler, Affective Ties and Delinquency, 16 PAC. Soc. REV. 27 (1973); Meade & Marsden, An Integration of Classic Theories of Delinquency, in YOUTH AND SOCIETY: STUDIES OF ADOLESCENT DEVIANCE (A.C. Meade ed. 1981); Mednick, Pollock, Volauka & Gabrielli, Jr., Biology and Violence, in CRIMINAL VIOLENCE 85 (M. Wolfgang & N. Weiner eds. 1982); Patterson, Chamberlain & Reid, A Comparative Evaluation of a Parent-Training
Program, 13 BEHAV. THERAPY 638 (1982); Thompson, Smith-DiJulio & Matthews, Social Control Theory: Evaluating a Model for the Study of Adolescent Alcohol and Drug Use, 13 YOUTH
& Soc'Y 303 (1982).
PATHWAYS TO DELINQUENCY?
own prior work (proposing a paradigm which integrates strain, so-cial control, and learning perspectives) falls within this line of theo-retical development. Elliott et al. tested this model in a longitudinal study of a national youth panel.1 5 The current project builds upon this integrated social-psychological model by incorporating a social disorganization perspective that includes neighborhood characteris-tics identified as contributing to the etiology of crime and delin-quency and bj including biological variables that have been suggested as precursors to deviant behavior. By integrating the so-cial psychological model with soso-cial disorganization theory and bio-logical determinants, we created a general developmental model of the etiology of crime and delinquency. A focus of the study is to identify the combination of biological, economic, social, and psy-chological factors that explain why some youth initiate and continue involvement in serious delinquent behavior while other apparently similar youth do not.
The overall design of the research project is based on a pro-spective longitudinal survey. The longitudinal survey involves an-nual personal interviews with a probability sample of five different birth cohorts and their parents selected from areas of Denver, Colo-rado that have high risk for delinquency. The subjects consisted of 802 boys and 728 girls. At point of the first annual survey covering the 1987 period, the subjects were 7, 9, 11, 13 and 15 years of age. Of the 1,530 Year-1 respondents, slightly over 92% completed in-terviews in year 2.
The sampling procedure was designed to ensure that the sam-ple included a sufficient number of serious chronic offenders for an analysis of their developmental patterns; at the same time, the sam-ple procedure provided data on normal developmental processes and patterns. Both kinds of data are necessary to distinguish be-tween normal and criminal developmental patterns and to deter-mine the prevalence of various developmental patterns (particularly those which carry a high risk of violent or sustained criminal behavior).
Selection of survey respondents entailed a three stage process. First, we selected neighborhoods based upon their "high risk" status. Risk was determined by a social ecology analysis that identi-fied "socially disorganized" areas, and by official crime rates. Sec-ond, all households in these communities were enumerated. Finally, interviewers were sent in person to a random sample of these addresses. This last stage required interviewers to speak with
15 D. ELLIOTr, EXPLAINING DELINQUENCY, supra note 12.
DENVER YOUTH SURVEY
an adult and determine the ages of household members in approxi-mately 20,000 households.16
All households with an appropriately aged child were eligible to participate in the study, and interviewers proceeded to interview the parent/guardian and all eligible youth in these households. The in-clusion of all eligible children provided us with the ability to study families in general, and siblings more specifically. As a result of the sampling procedure, a large number of Black and Hispanic youth were included in the study; this will allow a careful examination of the relationship between race/ethnicity, social status, family back-ground, and delinquency. The sample also included both "in-school" and "drop-out" youth.
B. MEASURES AND METHODS
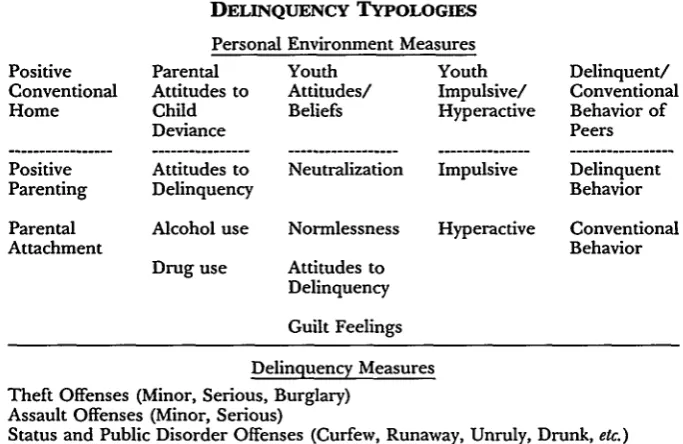
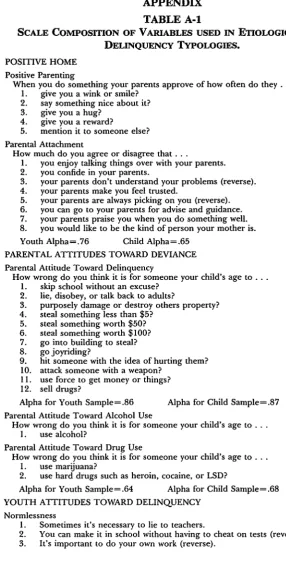
The etiological or personal environment measures used to ex-amine the existence of multiple pathways to delinquency were se-lected to represent some of the main constructs of the general developmental model. Because the measurement space of the DYS is wide ranging, even within theoretical constructs, we selected vari-ables not only on the basis of their theoretical relevance but also on their empirical relationship to various forms of delinquent behavior. Although this selection process eliminated some potentially impor-tant variables (e.g., social disorganization and secondary controls), it provided a reasonable collection of measures to use in this prelimi-nary examination of multiple pathways. Once particular scales or variables were selected, we arranged them by theoretical construct. A second order factor analysis indicated that some of the measures within constructs could be combined into higher order measures and thus simplify the measurement space to be used. An outline of these higher order measures is provided in Figure 2, and the items included in the various scales are described in the Appendix. As demonstrated by Figure 2, a construct of a positive home is indi-cated by a combined measure of positive parenting and parental at-tachment, as perceived by a youth or child respondent. Although both parent and youth/child measures of these variables were avail-able, based on our own previous work and that of our companion project in Albany,17 we selected the youth/child measures because
16 For a more detailed description of the sample and ecological analysis, see
Esben-sen & Huizinga, Community Structure and Drug Use: From a Sodal Disorganization Perspective, 7 JUST. Q. 691 (1990).
17 M. Krohn, S. Stern, T. Thornberry & S. Jang, Family Processes and Initiation of
Delinquency and Drug Use: The Impact of Parent and Adolescent Perceptions (1989) (unpublished manuscript).
PATHWAYS TO DELINQUENCY?
FIGURE 2
VARIABLES USED IN PERSONAL ENVIRONMENT AND DELINQUENCY TYPOLOGIES
Personal Environment Measures
Positive Parental Youth Youth Delinquent/ Conventional Attitudes to Attitudes/ Impulsive/ Conventional Home Child Beliefs Hyperactive Behavior of
Deviance Peers
Positive Attitudes to Neutralization Impulsive Delinquent Parenting Delinquency Behavior
Parental Alcohol use Normlessness Hyperactive Conventional
Attachment Behavior
Drug use Attitudes to Delinquency
Guilt Feelings
Delinquency Measures Theft Offenses (Minor, Serious, Burglary)
Assault Offenses (Minor, Serious)
Status and Public Disorder Offenses (Curfew, Runaway, Unruly, Drunk, etc.)
Other Offenses
of their greater relevance in predicting delinquency.
A second parental construct involving parental attitudes toward delinquency and drug use was also selected. This construct in-cluded measures of the extent to which parents think it is wrong for their children to engage in delinquency and drug use. We selected this measure over other parenting measures because of its some-what higher empirical correlation with several delinquency
measures.
A third construct involves youth/child beliefs and attitudes. This composite construct included measures of neutralization (will-ingness to invoke reasons or excuses for delinquent behavior), normlessness (the feeling that rules must be violated to achieve de-sired goals), attitudes toward delinquent behavior (how wrong it is to engage in delinquent behavior), and feelings of guilt associated with performing delinquent acts.
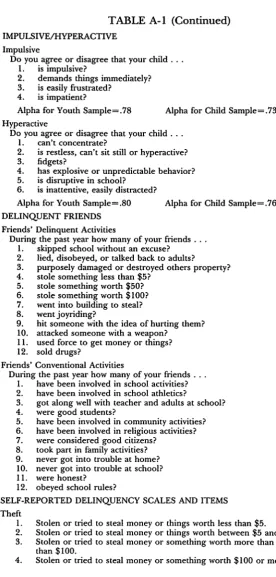
An indication of impulsivity and/or hyperactivity is provided by a fourth construct. This measure is based on parent reports of their child's behavior. Finally, the delinquent and conventional orienta-tions of peers is measured by a composite involving youth/child re-ports about the delinquent and conventional behaviors of their
[image:10.454.51.393.87.309.2]DENVER YOUTH SURVEY
friends, reflecting gender delinquency and less conventional behav-ior by friends.
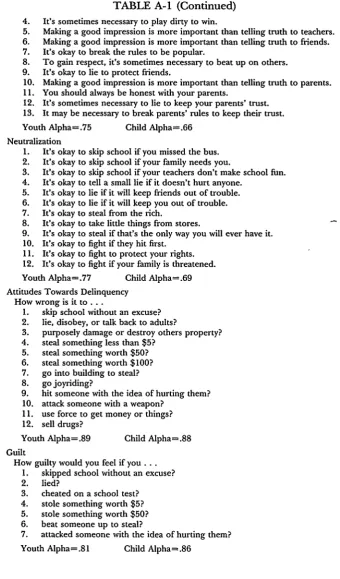
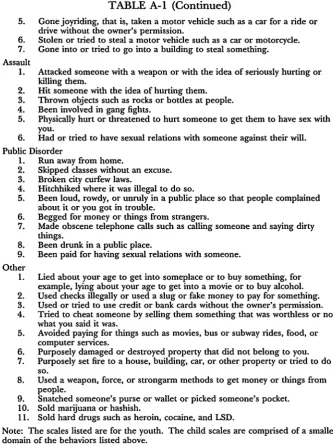
We also based the selection of self-reported measures of delin-quency used in the analysis of multiple pathways on a second-order factoring of a set of relatively homogeneous delinquency scales. A listing of the scales included in each of the higher order delinquency measures is outlined in Figure 2, and a listing of items included in each of the scales is included in the Appendix. Although similar in content, somewhat different items are employed in child (ages 7-9) and youth (age 11-15) delinquency scales, reflecting the differences in comprehension and experience of these different age groups. As indicated in Figure 2, delinquent offenses have been divided into theft offenses, assault offenses, status and public disorder offenses, and a collection of other offenses. The existence of some empirical justification for these higher order offense categories was fortuitous, since this simplification helped to decrease the complexity of the classification space.
The variables used in the analyses were also selected to reflect an appropriate temporal order. That is, Time 1 delinquency refers to the 1987 period, Time 2 delinquency refers to the 1988 period, and all of the etiological or personal environment variables either precede or are contemporaneous with Time 2 delinquency. In par-ticular, all of the etiological variables, except the delinquency and conventionality of friends, reflect influences early in 1988. The measures of friends behavior involve the entire calendar year, and we have used the measure contemporaneous with Time 2 delin-quency, believing that current friends may have a greater influence on behavior than do friends of the year just passed.
To search for the multiple types or pathways anticipated in the delinquent and etiological typologies, a K-means cluster analysis procedure was used. This procedure is an adaptation and modifica-tion of the method described by Sparks's that includes "collapsing of clusters" and the automatic identification of outliers. Because al-most all cluster analysis routines will return a set of clusters, even when none are present, an evaluation of each clustering was con-ducted to examine the compactness, density, and separation of the derived clusters using methods described by Huizinga.19
18 Sparks, Euclidean Cluster Analysis, 22 APPLIED STATISTICS 126 (1973).
19 For a description of the methods, see D. Huizinga, Are There Any Clusters?
(1978) (paper presented at the Classification Society Meetings, Clemson, SC).
PA THWAYS TO DELINQUENCY?
C. RESULTS
1. Etiological Typologies
Analyses of standardized personal, environment variables from the child sample (ages 7-9) with the K-means clustering algorithms suggested the existence of six clusters. Evaluation of the six cluster K-means partition, together with a separate K-means analysis using different initial starting points, indicated that the clustering was rel-atively stable. The evaluation also indicated that although the boundaries of the cluster were not well-separated in space, in each cluster the points were grouped around the cluster centroid. This suggests that the typology does not reflect isolated clusters in space, but rather groupings of relatively homogeneous points representing the differential density of points in the multivariate space. In a sense, the partition might be considered a "multivariate histogram" that locates swarms of points in the measurement space.
Examination of the standardized explanatory data from the youth sample (ages 11-15) with the K-means algorithms suggested the existence of five clusters. Evaluation of the five cluster partition from the K-means procedure indicated that they were very stable or robust. The evaluation also indicated that the cluster boundaries were not well separated and that the majority of points in each clus-ter were gathered about the clusclus-ter centroid. Thus, as in the child typology, this clustering does not represent isolated clusters but does reflect the differential density occurring in the data.
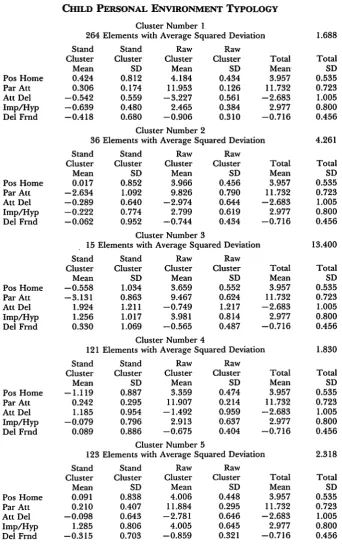
The profiles of the centroids of the clusters from the child and youth typologies are contained in Figures 3 and 4. Numerical tables describing the clusters are contained in the Appendix.
As Figure 3 illustrates, the first cluster in the child typology is a large cluster (N=263) containing children who have an average or positive home environment, who have parents with slightly higher than average attitudes about the wrongness of children's deviant be-havior, who have personal beliefs or attitudes that are not support-ive of delinquent behavior, who display less than average impulsivity/hyperactivity, and who report less than average delin-quent/conventional behavior by their friends. The second cluster contains children characterized as having parents who do not be-lieve that deviant behavior of children is as wrong as do other par-ents, but who are roughly average on the other variables. Children in the third cluster are characterized as having a less positive home than other children, and as having parents whose beliefs about the wrongness of deviant behavior is quite below that of other parents. These are children who have generally "pro-delinquent attitudes or
94 DENVER YOUTH SURVEY [Vol. 82
0" .. i
.
o\
-4 z
"
/
. 7 !/ \ '
.-..\.. 6;-.. II
*, .. *,
\ . ." / *C
l I. s / I*
1991] PATHWAYS TO DELINQUENCY? 95
oi
IL
"I N z
I
\
6z
1 /
"-o \""
LI
\"
C4"
.- -.
I \ .
.
DENVER YOUTH SURVEY
beliefs" and who are seen as being above average in impulsiv-ity/hyperactivity. At the same time, these children report a slightly above average rate of delinquent/conventional behavior by their friends. The fourth cluster also contains children that have a less positive home and have pro-delinquent beliefs, but who are close to average in impulsivity and the delinquent behavior of their friends. The fifth cluster is essentially average, with the exception that these children are more impulsive and hyperactive than other children. Finally, the sixth cluster contains children who are generally average with the exception that they report a greater involvement in the de-linquent behavior of their friends.
To provide some nomenclature, the clusters have been titled: Cluster One - Pro-Social; Cluster Two - Parent Attitudes; Clus-ter Three - Pro-Delinquent; Cluster Four - Delinquent Beliefs; Cluster Five - Impulsive/Hyperactive; Cluster Six - Delinquent Friends. As these clusters and their titles suggest, there appear to be differences in the "personal environments" of these children which may affect their delinquent behavior, an issue that will be ex-amined later.
Several of the clusters encountered in the child typology are replicated in the youth typology. As illustrated in Figure 4, Cluster Four is similar to the Pro-Social Child Cluster; Cluster Three is simi-lar to the Parent Attitudes Cluster; Cluster Five is simisimi-lar to the Pro-Delinquent Cluster but additionally reflects involvement with delin-quent friends; and Cluster One is similar to the Impul-sive/Hyperactive Cluster. In addition, one youth cluster is essentially average on all variables, although it is slightly below aver-age in impulsivity. This cluster has been entitled "Averaver-age." The youth typology also reflects differences in the personal environ-ments of these youth that might be anticipated to affect their delin-quent behavior.
2. Delinquency Typologies
PATHWAYS TO DELINQUENCY?
these two dusters, there were a number of smaller clusters that re-flected different patterns of greater involvement in delinquent be-havior. These clusters had substantially higher than average involvement in one or more of the types of delinquency measured. Although there might be merit in maintaining each of these clusters in further analyses, we combined them into one large group entitled "Higher Level Delinquents."
Essentially the same kinds of dusters were found for the youth sample. Specifically, we discovered a non-delinquent cluster (N=313) and a low level delinquency cluster (N=347) that con-tained youths who committed on the average less than one theft, one assault, three status/public disorder offenses, and one other of-fense. A number of other, smaller clusters representing different patterns of frequency of involvement in the different types of of-fenses were also found. Given the smaller cluster sizes, we also col-lapsed these into one higher level delinquency group.
Quite similar clusters were found for both year 1 and year 2 for the child and youth delinquency typologies.
3. Transitions In Types
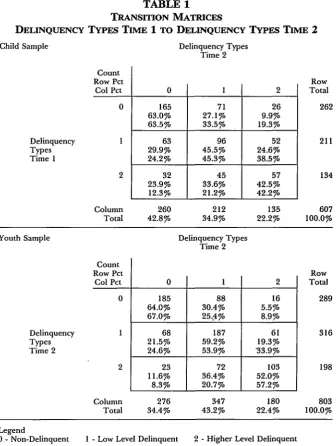
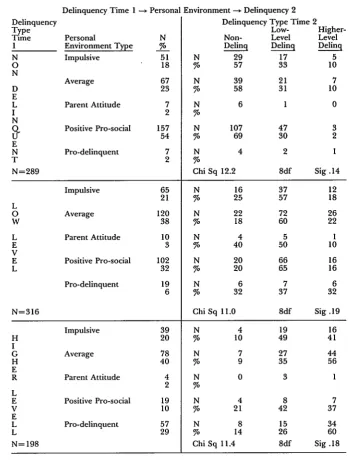
The transition matrices between delinquent types at Time 1 and delinquent types at Time 2 for both child and youth samples is provided in Table 1. As that table demonstrates, a good deal of movement occurred between the types from year to year. For the child sample, approximately two-thirds of the non-delinquents re-mained non-delinquents, while approximately one-third initiated or "re-initiated" delinquent behavior. As might be anticipated, the majority of these entered the low-level delinquent category. Among child low-level delinquents, slightly less than one-half stayed in that category in the next year, while one-quarter moved to the higher delinquency category, and slightly less than one-third reported en-gaging in no delinquencies in the following year. Among children in the higher delinquency category, 43% remained in that category, 34%y moved to the low-level delinquent category, and 24% moved to the non-delinquent category.
For the youth sample, 64% of the non-delinquents remained in that category the following year and 36% initiated or "re-initiated" delinquent behavior, with most entering the low-level delinquent category. These rates are very similar to the child sample. Among low-level delinquents, 59% remained in that category, 22% re-turned to a non-delinquent status, and 19% entered the higher-level delinquency class. Of the higher-level delinquents, 52% remained
DENVER YOUTH SURVEY [Vol. 82
TABLE 1 TRANSITION MATRICES
DELINQUENCY TYPES TIME 1 TO DELINQUENCY TYPES TIME 2
Child Sample Delinquency Types Time 2
Count Row Pct Col Pct
Delinquency Types Time 1
Column 260
Total 42.8%
Youth Sample
165 63.0% 63.5% 71 27.1% 33.5% 26 9.9% 19.3%
63 96 52
29.9% 45.5% 24.6% 24.2% 45.3% 38.5%
32 45 57
23.9% 33.6% 42.5% 12.3% 21.2% 42.2%
212 34.9% 135 22.2% Row Total 262 211 134 607 100.0%
Delinquency Types Time 2
185 64.0% 67.0% 88 30.4% 25.4% 16 5.5% 8.9%
68 187 61
21.5% 59.2% 19.3% 24.6% 53.9% 33.9%
23 72 103
11.6% 36.4% 52.0% 8.3% 20.7% 57.2%
Column 276
Total 34.4%
347 43.2%
180
22.4%
Legend
0 -Non-Delinquent 1 -Low Level Delinquent 2 -Higher Level Delinquent Count
Row Pct Col Pct
Delinquency Types Time 2
[image:17.454.67.404.64.511.2]PATHWAYS TO DELINQUENCY?
in that category, and 48% moved to the lower-delinquent or non-delinquent types.
These transition matrices illustrate that regardless of age or de-linquent type, the most prevalent transition from one year to the next is to remain in that same type. However, there is substantial movement to higher and lower levels of delinquency involvement, with the majority of movement being to an adjacent category.
Given these various transitions, two questions are raised in this paper: first, do the personal environments of these children and youth help explain these transitions?; and second, are there multiple environments leading to involvement, increases, or decreases in de-linquent behavior? Before examining these issues, however, it should be noted that a relationship exists between the personal en-vironment typology and the delinquency level typologies for both years and for both child and youth samples (Chi square was signifi-cant at the 0.01 level for all but year one for the child sample). That is, the proportion of children or youth classified as low* or high level delinquent was higher for some types of personal environments than for others. Because the variables upon which the personal en-vironment typology is based were selected as variables relevant to the explanation of delinquency, the relationship between the per-sonal and delinquent typologies is not too surprising.
It is interesting, however, that in both the child and youth sam-ples, the cluster reflecting a more positive home and a pro-social orientation of the child or youth is responsible for much of the rela-tionship. These clusters were more likely to contain non-delin-quents and less likely to contain higher level delinnon-delin-quents. In contrast, in the child sample, the cluster reflecting delinquent or less conventional friends, and in the youth sample, the clusters reflecting a negative home, a delinquent orientation, and delinquent or less conventional friends, disproportionately overlapped the higher de-linquent type and were less likely to contain non-dede-linquents.
Although a relationship exists between the personal and delin-quency typologies, it is important to note that a substantial number of children and youth in each personal environment type were clas-sified as non-delinquent, low-level delinquent, and as higher-level delinquent. Delinquent involvement is not unique to any one per-sonal environment type. Also, it should be noted that the "influ-ence" of the Year-I personal typology on delinquent behavior is not in the correct temporal order. Most personal environment variables are measured after the Time-1 delinquency period. Conceivably, the children's personal environment could be relatively stable over time or they may result, in part, from previous delinquent behavior,
DENVER YOUTH SURVEY
but the data used in this paper do not allow this issue to be addressed.
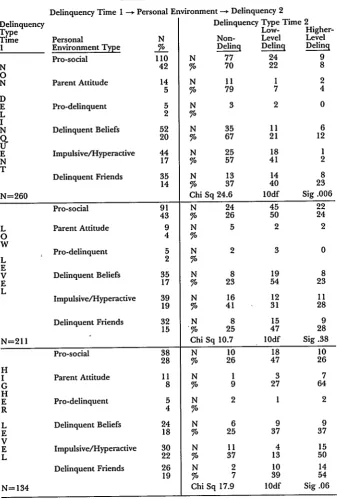
To examine further the role of the personal environments in explaining the transitions between delinquency types, we con-structed a transition matrix of the cross-classification of the Time-i delinquency types by the personal environment types to the Time-2 delinquency types. These transition matrices represent the probability that a child or youth with a given delinquent behavior pattern at Time 1 and having a particular personal environment will display a particular delinquent behavior pattern at Time 2. Thus, consistency and change in delinquent behavior as filtered through the personal environments can be examined. The transition matri-ces are presented for the child and youth samples in Tables 2 and 3, respectively. The first column of figures in these tables provides the size and percentage of each personal environment within the re-spective Time-1 delinquency types. The next three columns pro-vide the number and percent of these delinquency/personal environment types that are classified into the Time-2 delinquency types. For example, in the child table, the pro-social type makes up 42% of the Time-1 non-delinquents. Of this group, 70% remained non-delinquents, while 22% and 8% moved to the low-level and higher-level Time-2 delinquency types. Because some cross-classifi-cations result in very small groups, transition probabilities are likely to be unstable and therefore are not provided for groups of less than ten.
Examination of differences in transitions for the child sample suggests that the personal environments may provide some protec-tive as well as some risk factors. For example, among non-delin-quents, having a personal environment that includes delinquent or less conventional friends appears to be strongly related to initiation or "re-initiation" of delinquency. Similarly, being in the cluster of impulsive/hyperactive also appears related to initiation. In these non-delinquent groups at Time 1, 63% of those with delinquent friends and 43% of those in the impulsive group initiated delin-quent behavior in the following year, compared to 33% or less for the other groups. Among higher level delinquents, having a per-sonal environment that includes a positive home and conventional attitudes appears to reduce delinquency involvement, while being in the three groups described as impulsive, having delinquent friends, or having parents with weak attitudes about child deviance appear to sustain the higher level involvement.
PATHWAYS TO DELINQUENCY? Delinquency Type Time I N 0 N D E L I N U E N T N=260
TABLE 2
CHILD TRANSITIONS
Delinquency Time I -- Personal Environment ---. Delinquency 2 Delinquency Type Time 2
Low- Higher-Personal N Non- Level Level Environment Type 7_ Delin Deling Deling
Pro-social 110 N 77 24 9
42 % 70 22 8
Parent Attitude 14 N 11 1 2
5 % 79 7 4
Pro-delinquent 5 N 3 2 0 2 %
Delinquent Beliefs 52 N 35 11 6
20 % 67 21 12 Impulsive/Hyperactive 44 N 25 18
17 % 57 41 2
Delinquent Friends 35 N 13 14 8
14 % 37 40 23
Chi Sq 24.6 lOdf Sig .006 Pro-social
Parent Attitude
Pro-delinquent
Delinquent Beliefs
Impulsive/Hyperactive
Delinquent Friends
N=211 24 26 5 2 8 23 16 41 8 25 Sq 10.7
22 24 2 0 8 23 11 28 9 28 Sig .38
Pro-social 38 N 10 18 10
28 0 26 47 26
H
I Parent Attitude 11 N 1 3 7
G 8 0 9 27 64
H
E Pro-delinquent 5 N 2 1 2
R 4 7
L Delinquent Beliefs 24 N 6 9 9
E 18 % 25 37 37
V
E Impulsive/Hyperactive 30 N 11 4 15
L 22 0 37 13 50
Delinquent Friends 26 N 2 10 14
N=13 ChiSq 1.9 ldf Sg .0 1991]
[image:20.454.52.390.82.582.2]DENVER YOUTH SURVEY
TABLE 3
Delinquency Type Time
1
N
0
N
D E L
I
N Q U E N T N=289
[Vol. 82
YouTH TRANSITIONS
Delinquency Time 1 -+ Personal Environment - Delinquency 2 Delinquency Type Time 2
Low-Personal N Non- Level Environment Type 7 Delinq Delinq
Impulsive 51 N 29 17
18 7% 57 33
Average 67 N 39 21
23 % 58 31
Parent Attitude 7 N 6 1
2 %
Positive Pro-social 157 N 107 47 54 % 69 30 Pro-delinquent 7 N 4 2
2 %
Chi Sq 12.2 8df S Higher-Level
5
10
7
10 0
3
2
ig.14
Impulsive 65 N 16 37 12
21 % 25 57 18
L
0 Average 120 N 22 72 26
W 38 % 18 60 22
L Parent Attitude 10 N 4 5 1
E 3 % 40 50 10
V
E Positive Pro-social 102 N 20 66 16
L 32 % 20 65 16
Pro-delinquent 19 N 6 7 6
6 % 32 37 32
N=316 Chi Sq 11.0 8df Sig .19
Impulsive 39 N 4 19 16
H 20 % 10 49 41
I
G Average 78 N 7 27 44
H 40 % 9 35 56
E
R Parent Attitude 4 N 0 3 1 2 %
L
E Positive Pro-social 19 N 4 8 7
V 10 % 21 42 37
E
L Pro-delinquent 57 N 8 15 34
L 29 % 14 26 60
[image:21.454.53.403.80.541.2]PATHWAYS TO DELINQUENCY?
ferent initial delinquent types and personal environment types, although none of the differences are sufficiently large to result in a significant chi-square. Among non-delinquents, being in a pro-de-linquent personal environment appears to increase the probability of moving to a higher involvement in delinquency in the following year. Among higher level delinquents, those with a positive home and conventional orientation were more likely to decrease their de-linquent involvement than were other types, while those with a neg-ative home and pro-delinquent orientation were more likely to maintain their classification as higher-level delinquents.
Although there are a number of differences in transition probabilities between groups of different initial delinquency levels and personal environments, it is also important to note that each of the Time-2 delinquency types contain a substantial number of indi-viduals from most of the Time-I "delinquency by personal environ-ment" types. These results clearly demonstrate that multiple paths leading to increased delinquency involvement do exist, and, given the observed differences in transition probabilities, that there may be different explanations for different paths.20
To examine potential differences by sex in the child and youth samples, the above sequence of analyses was replicated separately for girls and boys. Although there are some differences, as noted below, the same general pattern of findings held for both sexes. At best, differences might be described as "variations on a theme." As might be anticipated, in the delinquency clusters girls are somewhat over-represented in the non-delinquent clusters and under-repre-sented in the higher-involvement clusters. Using the Time 2 Delin-quency Typology as an example, the child sample is 52% male and 48% female, but the higher delinquency cluster is 57% male and 43% female. Similarly, the youth sample is 53% male and 47% male, but the higher delinquency duster is 61% male and 39% fe-male. As these percentages suggest, substantial numbers of both males and females are contained in each delinquency cluster.
20 We initially anticipated that differences in covariance matrices between Time 1 Delinquency -Personal environment types could be demonstrated with simple linear regressions. However, the restriction of range brought about by the cluster analyses in both the dependent and independent variables did not allow this to occur in a meaning-ful or insightmeaning-ful way. For example, in the youth sample, the pro-delinquent cluster had an essentially zero regression coefficient for the influence of delinquent friends, while it was positive and of moderate size for the other clusters. The conclusion is not that delinquent friends do not influence the members of a pro-delinquent cluster but rather that all members of this cluster have high scores on the delinquency of friends variable. Thus this variable was not important in predicting the frequency of delinquency among members of the pro-delinquent group.
DENVER YOUTH SURVEY
The personal environment typology also shows some relation-ship to sex; however, for the child sample, the association is not sta-tistically significant at even the 0.10 level. In both samples, boys are somewhat more likely to be classified as impulsive/hyperactive and girls are somewhat more likely to be classified as having a positive home and a conventional orientation, but none of these differences is significant.
The delinquency Time-1 - Personal Environment -
Delin-quency Time-2 transition matrices are also generally similar for both sexes. Although some transition probabilities vary between the sexes, the same general patterns observed for the total child and youth samples are the same for both sexes. Given this overall simi-larity of findings, separate tables for each sex are not provided.
We also performed a separate sequence of analyses using a finer grained delinquency typology (non-delinquent, low-level de-linquency, moderate dede-linquency, and high-level delinquency) to determine if one or more of the prior delinquency and personal en-vironment types would account for a high-level delinquency group. The findings, however, were similar to the three group partition presented above. Even the high delinquency child and youth clus-ters contained individuals from most of the personal environment types.
III. CONCLUSION
Given these various findings, what conclusions seem war-ranted? First, typological diversity does appear among the child and youth samples in the etiological or explanatory variables, and there is some indication of a differential relationship between these types and involvement in delinquent behavior. Second, those classified as delinquent, even those classified as very high delinquents, included individuals from most of the different personal environment -types. We believe that other variables not included in these preliminary analyses may account for the tendency of some of the children and youth in particular types, such as those in generally pro-social envi-ronments with conventional orientations, to engage in delinquency. However, it seems clear that individuals in quite different personal environments and prior levels of delinquency are classified as delin-quent. That is, multiple paths to delinquency do appear to exist.
1991] PATHWAYS TO DELINQUENCY? 105
106 DENVER YOUTH SURVEY [Vol. 82
APPENDIX
TABLE A-1
SCALE COMPOSION OF VARIABLES USED IN ETIOLOGICAL AND DELINQUENCY TYPOLOGIES.
POSITIVE HOME
Positive Parenting
When you do something your parents approve of how often do they ...
1. give you a wink or smile? 2. say something nice about it?
3. give you a hug? 4. give you a reward?
5. mention it to someone else?
Parental Attachment
How much do you agree or disagree that...
1. you enjoy talking things over with your parents. 2. you confide in your parents.
3. your parents don't understand your problems (reverse). 4. your parents make you feel trusted.
5. your parents are always picking on you (reverse).
6. you can go to your parents for advise and guidance.
7. your parents praise you when you do something well.
8. you would like to be the kind of person your mother is.
Youth Alpha=.76 Child Alpha= .65
PARENTAL ATTITUDES TOWARD DEVIANCE Parental Attitude Toward Delinquency
How wrong do you think it is for someone your child's age to...
1. skip school without an excuse? 2. lie, disobey, or talk back to adults?
3. purposely damage or destroy others property? 4. steal something less than $5?
5. steal something worth $50? 6. steal something worth $100?
7. go into building to steal? 8. go joyriding?
9. hit someone with the idea of hurting them? 10. attack someone with a weapon?
11. use force to get money or things? 12. sell drugs?
Alpha for Youth Sample=.86 Alpha for Child Sample=.87 Parental Attitude Toward Alcohol Use
How wrong do you think it is for someone your child's age to... 1. use alcohol?
Parental Attitude Toward Drug Use
How wrong do you think it is for someone your child's age to... I. use marijuana?
2. use hard drugs such as heroin, cocaine, or LSD?
Alpha for Youth Sample=.64 Alpha for Child Sample= .68 YOUTH ATTITUDES TOWARD DELINQUENCY
Normlessness
1. Sometimes it's necessary to lie to teachers.
2. You can make it in school without having to cheat on tests (reverse).
[image:25.454.60.347.60.625.2]PATHWAYS TO DELINQUENCY?
TABLE A-1 (Continued)
4. It's sometimes necessary to play dirty to win.
5. Making a good impression is more important than telling truth to teachers. 6. Making a good impression is more important than telling truth to friends. 7. It's okay to break the rules to be popular.
8. To gain respect, it's sometimes necessary to beat up on others. 9. It's okay to lie to protect friends.
10. Making a good impression is more important than telling truth to parents. 11. You should always be honest with your parents.
12. It's sometimes necessary to lie to keep your parents' trust. 13. It may be necessary to break parents' rules to keep their trust. Youth Alpha=.75 Child Alpha=.66
Neutralization
1. It's okay to skip school if you missed the bus. 2. It's okay to skip school if your family needs you.
3. It's okay to skip school if your teachers don't make school fun. 4. It's okay to tell a small lie if it doesn't hurt anyone.
5. It's okay to lie if it will keep friends out of trouble.
6. It's okay to lie if it will keep you out of trouble.
7. It's okay to steal from the rich.
8. It's okay to take little things from stores.
9. It's okay to steal if that's the only way you will ever have it.
10. It's okay to fight if they hit first. 11. It's okay to fight to protect your rights.
12. It's okay to fight if your family is threatened. Youth Alpha=.77 Child Alpha=.69 Attitudes Towards Delinquency
How wrong is it to...
1. skip school without an excuse? 2. lie, disobey, or talk back to adults?
3. purposely damage or destroy others property? 4. steal something less than $5?
5. steal something worth $50?
6. steal something worth $100?
7. go into building to steal?
8. go joyriding?
9. hit someone with the idea of hurting them?
10. attack someone with a weapon? 11. use force to get money or things?
12. sell drugs?
Youth Alpha=.89 Child Alpha=.88 Guilt
How guilty would you feel if you...
I. skipped school without an excuse? 2. lied?
3. cheated on a school test? 4. stole something worth $5?
5. stole something worth $50?
6. beat someone up to steal?
7. attacked someone with the idea of hurting them?
1991]
[image:26.454.47.388.58.638.2]DENVER YOUTH SURVEY
TABLE A-1 (Continued)
IMPULSIVE/HYPERACTIVE
Impulsive
Do you agree or disagree that your child...
1. is impulsive?
2. demands things immediately? 3. is easily frustrated?
4. is impatient?
Alpha for Youth Sample=.78 Alpha for Child Sample=.73
Hyperactive
Do you agree or disagree that your child... 1. can't concentrate?
2. is restless, can't sit still or hyperactive? 3. fidgets?
4. has explosive or unpredictable behavior? 5. is disruptive in school?
6. is inattentive, easily distracted?
Alpha for Youth Sample=.80 Alpha for Child Sample=.76
DELINQUENT FRIENDS
Friends' Delinquent Activities
During the past year how many of your friends ... 1. skipped school without an excuse? 2. lied, disobeyed, or talked back to adults?
3. purposely damaged or destroyed others property? 4. stole something less than $5?
5. stole something worth $50? 6. stole something worth $100? 7. went into building to steal? 8. went joyriding?
9. hit someone with the idea of hurting them? 10. attacked someone with a weapon?
11. used force to get money or things? 12. sold drugs?
Friends' Conventional Activities
During the past year how many of your friends... I. have been involved in school activities? 2. have been involved in school athletics?
3. got along well with teacher and adults at school? 4. were good students?
5. have been involved in community activities? 6. have been involved in religious activities? 7. were considered good citizens?
8. took part in family activities? 9. never got into trouble at home?
10. never got into trouble at school? 11. were honest?
12. obeyed school rules?
SELF-REPORTED DELINQUENCY SCALES AND ITEMS
Theft
1. Stolen or tried to steal money or things worth less than $5. 2. Stolen or tried to steal money or things worth between $5 and $50. 3. Stolen or tried to steal money or something worth more than $50 but less
than $100.
4. Stolen or tried to steal money or something worth $100 or more.
[image:27.454.62.339.43.622.2]1991] PATHWAYS TO DELINQUENCY? 109
TABLE A-1 (Continued)
5. Gone joyriding, that is, taken a motor vehicle such as a car for a ride or drive without the owner's permission.
6. Stolen or tried to steal a motor vehicle such as a car or motorcycle. 7. Gone into or tried to go into a building to steal something. Assault
1. Attacked someone with a weapon or with the idea of seriously hurting or killing them.
2. Hit someone with the idea of hurting them. 3. Thrown objects such as rocks or bottles at people. 4. Been involved in gang fights.
5. Physically hurt or threatened to hurt someone to get them to have sex with you.
6. Had or tried to have sexual relations with someone against their will. Public Disorder
1. Run away from home.
2. Skipped classes without an excuse.
3. Broken city curfew laws.
4. Hitchhiked where it was illegal to do so.
5. Been loud, rowdy, or unruly in a public place so that people complained about it or you got in trouble.
6. Begged for money or things from strangers.
7. Made obscene telephone calls such as calling someone and saying dirty things.
8. Been drunk in a public place.
9. Been paid for having sexual relations with someone. Other
1. Lied about your age to get into someplace or to buy something, for example, lying about your age to get into a movie or to buy alcohol. 2. Used checks illegally or used a slug or fake money to pay for something. 3. Used or tried to use credit or bank cards without the owner's permission. 4. Tried to cheat someone by selling them something that was worthless or not
what you said it was.
5. Avoided paying for things such as movies, bus or subway rides, food, or computer services.
6. Purposely damaged or destroyed property that did not belong to you.
7. Purposely set fire to a house, building, car, or other property or tried to do
SO.
8. Used a weapon, force, or strongarm methods to get money or things from people.
9. Snatched someone's purse or wallet or picked someone's pocket. 10. Sold marijuana or hashish.
11. Sold hard drugs such as heroin, cocaine, and LSD.
[image:28.454.56.390.60.505.2]DENVER YOUTH SURVEY [Vol. 82
TABLE A-2
CHILD PERSONAL ENVIRONMENT TYPOLOGY
Cluster Number 1
264 Elements with Average Squared Deviation 1.688 Stand Stand Raw Raw
Cluster Cluster Cluster Cluster Total Total Mean SD Mean SD Mean SD
Pos Home 0.424 0.812 4.184 0.434 3.957 0.535
Par Att 0.306 0.174 11.953 0.126 11.732 0.723 Att Del -0.542 0.559 -3.227 0.561 -2.683 1.005
Imp/Hyp -0.639 0.480 2.465 0.384 2.977 0.800
Del Frnd -0.418 0.680 -0.906 0.310 -0.716 0.456 Cluster Number 2
36 Elements with Average Squared Deviation 4.261 Stand Stand Raw Raw
Cluster Cluster Cluster Cluster Total Total Mean SD Mean SD Mean SD Pos Home 0.017 0.852 3.966 0.456 3.957 0.535
Par Att -2.634 1.092 9.826 0.790 11.732 0.723
Att Del -0.289 0.640 -2.974 0.644 -2.683 1.005
Imp/Hyp -0.222 0.774 2.799 0.619 2.977 0.800
Del Frnd -0.062 0.952 -0.744 0.434 -0.716 0.456 Cluster Number 3
15 Elements with Average Squared Deviation 13.400 Stand Stand Raw Raw
Cluster Cluster Cluster Cluster Total Total Mean SD Mean SD Mean SD Pos Home -0.558 1.034 3.659 0.552 3.957 0.535 Par Att -3.131 0.863 9.467 0.624 11.732 0.723 Att Del 1.924 1.211 -0.749 1.217 -2.683 1.005
Imp/Hyp 1.256 1.017 3.981 0.814 2.977 0.800
Del Find 0.330 1.069 -0.565 0.487 -0.716 0.456 Cluster Number 4
121 Elements with Average Squared Deviation 1.830 Stand Stand Raw Raw
Cluster Cluster Cluster Cluster Total Total Mean SD Mean SD Mean SD Pos Home -1.119 0.887 3.359 0.474 3.957 0.535 Par Att 0.242 0.295 11.907 0.214 11.732 0.723 Att Del 1.185 0.954 -1.492 0.959 -2.683 1.005
Imp/Hyp -0.079 0.796 2.913 0.637 2.977 0.800
Del Frnd 0.089 0.886 -0.675 0.404 -0.716 0.456 Cluster Number 5
123 Elements with Average Squared Deviation 2.318 Stand Stand Raw Raw
Cluster Cluster Cluster Cluster Total Total Mean SD Mean SD Mean SD Pos Home 0.091 0.838 4.006 0.448 3.957 0.535 Par Att 0.210 0.407 11.884 0.295 11.732 0.723 Att Del -0.098 0.643 -2.781 0.646 -2.683 1.005
Imp/Hyp 1.285 0.806 4.005 0.645 2.977 0.800
[image:29.454.63.406.72.618.2]1991] PATHWAYS TO DELINQUENCY?
111
TABLE A-2 (Continued)
Cluster Number 6
93 Elements with Average Squared Deviation 1.948 Stand Stand Raw Raw
Cluster Cluster Cluster Cluster Total Total Mean SD Mean SD Mean SD Pos Home 0.229 0.726 4.080 0.388 3.957 0.535 Par Att 0.175 0.380 11.859 0.275 11.732 0.723
Att Del -0.129 0.760 -2.813 0.764 -2.683 1.005
Hyper 0.124 0.813 3.076 0.651 2.977 0.800
DENVER YOUTH SURVEY [Vol. 82
TABLE A-3
YOUTH PERSONAL ENVIRONMENT TYPOLOGY
Cluster Number 1
166 Elements with Average Squared Deviation 2.579 Stand Stand Raw Raw
Cluster Cluster Cluster Cluster Total Total Mean SD Mean SD Mean SD Pos Home 0.013 0.927 6.133 0.794 6.122 0.857 Par Att 0.129 0.534 11.576 0.810 11.381 1.518 Del Att -0.089 0.685 -1.267 1.020 -1.135 1.490 Imp/Hyp 1.330 0.767 4.114 0.663 2.965 0.864 Del Frnd -0.160 0.627 -1.375 0.632 -1.213 1.009
Cluster Number 2
287 Elements with Average Squared Deviation 2.158 Stand Stand Raw Raw
Cluster Cluster Cluster Cluster Total Total Mean SD Mean SD Mean SD Pos Home -0.309 0.708 5.857 0.607 6.122 0.857 Par Att 0.102 0.564 11.536 0.856 11.381 1.518 Del Att 0.322 0.744 -0.655 1.109 -1.135 1.490 Imp/Hyp -0.459 0.486 2.568 0.420 2.965 0.864 Del Frnd 0.352 0.746 -0.858 0.753 -1.213 1.009
Cluster Number 3
27 Elements with Average Squared Deviation 2.253
Stand Stand Raw Raw
Cluster Cluster Cluster Cluster Total Total Mean SD Mean SD Mean SD
Pos Home -0.441 0.866 5.744 0.742 6.122 0.857
Par Att -4.836 0.392 4.037 0.596 11.381 1.518
Del Att 0.142 0.780 -0.923 1.161 -1.135 1.490 Imp/Hyp 0.040 0.167 3.000 0.144 2.965 0.864 Del Frnd 0.100 0.894 -1.112 0.902 -1.213 1.009
Cluster Number 4
304 Elements with Average Squared Deviation 1.680
Stand Stand Raw Raw
Cluster Cluster Cluster Cluster Total Total Mean SD Mean SD Mean SD
Pos Home 0.718 0.647 6.737 0.555 6.122 0.857
Par Att 0.226 0.408 11.724 0.619 11.381 1.518
Del Att -0.737 0.657 -2.232 0.978 - 1.135 1.490 Imp/Hyp -0.567 0.500 2.476 0.432 2.965 0.864 Del Frnd -0.722 0.647 -1.941 0.653 -1.213 1.009
Cluster Number 5
91 Elements with Average Squared Deviation 4.036 Stand Stand Raw Raw
Cluster Cluster Cluster Cluster Total Total Mean SD Mean SD Mean SD
Pos Home -1.285 1.028 5.021 0.881 6.122 0.857
Par Att 0.117 0.562 11.559 0.854 11.381 1.518
[image:31.454.63.405.52.593.2]