ISSN: 2502-4752, DOI: 10.11591/ijeecs.v15.i1.pp346-354 346
Feed forward neural network application for classroom
reverberation time estimation
Fathin Liyana Zainudin1, Sharifah Saon2, Abd Kadir Mahamad3, Musli Nizam Yahya4, Mohd Anuaruddin Ahmadon5, Shingo Yamaguchi6
1,2,3Faculty of Electrical & Electronic Engineering, Universiti Tun Hussein Onn Malaysia, Malaysia 4Faculty of Mechanical & Manufacturing Engineering, Universiti Tun Hussein Onn Malaysia, Malaysia
5,6Graduate School of Science and Technology for Innovation, Yamaguchi University, Japan
Article Info ABSTRACT
Article history:
Received Dec 17, 2018 Revised Feb 18, 2019 Accepted Mar 1, 2019
Acoustic problem is a main issues of the existing classroom due to lack of absorption of surface material. Thus, a feed forward neural network system (FFNN) for classroom Reverberation Time (RT) estimation computation was built. This system was developed to assist the acoustic engineer and consultant to treat and reduce this matter. Data was collected and computed using ODEON12.10 ray tracing method, resulting in a total of 600 rectangular shaped classroom models that were modeled with various length, width, height, as well as different surface material types. The system is able to estimate RT for 500Hz, 1000Hz, and 2000Hz. Using the collected data, FFNN for each frequency were trained and simulated separately (as absorption coefficients are frequency dependent) in order to find the optimum solution. The final system was validated and compared with the actual measurement value from 15 different classrooms in Universiti Tun Hussein Onn Malaysia (UTHM). The developed system show positive results with average validation accuracy of 94.35%, 95.91%, and 96.42% for 500Hz, 1000Hz, and 2000Hz respectively.
Keywords:
Absorption coefficients Classroom
Feed forward neural network ODEON
Reverberation time
Copyright © 2019 Institute of Advanced Engineering and Science. All rights reserved.
Corresponding Author:
Sharifah Saon,
Faculty of Electrical & Electronic Engineering, Universiti Tun Hussein Onn Malaysia,
86400 Parit Raja, Batu Pahat, Johor, Malaysia. Email: [email protected]
1. INTRODUCTION
Most of the existing classroom are designed for lecture-based education, meanwhile, the growth in education world toward Education 4.0, required the used of education tool and platform to become interactive. This finishes of existing classroom are fine for lecture-based education that may cause acoustic problem in the interactive education, and lead difficult to hear. Reverberation is one of the reasons of the acoustic problem which able to be treatable with the proper mix of absorption. While, surface material; ceilings, concrete walls, wooden walls, tile floors, and wooden doors, plays a critical role of lack of absorption that can creates an excessively reverberant room.
The proposed system of Reverberation Time (RT) computation is able to assist the acoustic engineer and consultant to treat and properly locate the exact specifications of absorption material in order to reduce the classroom acoustic problem. RT is a time taken for the audio signal to drop by 60 dB. The first established formulae in estimating RT in an enclosed space was made by Sabine [1], as seen in (1).
𝑅𝑇60= 0.05𝑉
With,
V = room volume S = surface area
α = material absorption coefficient
Considering the simplicity of the Sabine formulae on top of ignoring many other factors, a jarring error can be seen between the formulaic and the actual measurement RT value. Since then, many other researchers have made improvements and materialized with more solid and accurate formulae calculations in regard of RT [2-6]. Besides this fundamental calculations, other techniques and methods were also being presented such as the computer simulations ray-tracing techniques (ODEON) [7] and finite element models (FEM) [8-9]. As ODEON and FEM taking an extra time on preparations (designing room models, etc.) researchers are still seeking for other alternative methods in estimating RT for instance by using neural network (NN) [10].
Since 1999, researches on RT prediction using NN, were started by Nannarielo and Fricke [11], in order to examine the developed NN using dataset from actual large halls building. This group of researchers were successfully manage and prove that NN is useful in predicting room RT. In 2010, experiments to predict RT for classrooms using dataset gathered from FEM computation were reported by [12]. Research in predicting RT was continued by Aliabadi et al. in 2014 [13]. In this research they were able to strengthen the potential of NN method in minimizing the uncertainties in acoustics' modeling for industrial workrooms.
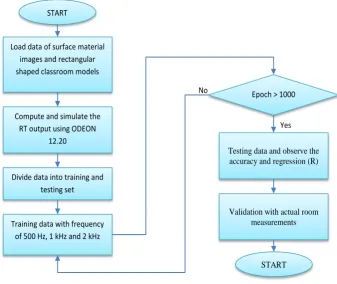
[image:2.595.133.471.427.711.2]The purpose of this research is to design an alternate method in estimating RT in a classroom that is cost effective and uncomplicated in addition to be able to provide users with an alternative prediction model with low percentage error. This research focuses on classroom RT computation in order to obtain the optimum sound between the teacher and students, by minimize the noise [14]. Moreover, poor working conditions in a classroom can be avoided as well as maintaining the teacher’s comfort in delivering the speech [15]. The ideal classroom RT value is in the range of 0.4 – 0.6 seconds, although most of the existing classrooms produced RT more than 1 second that can cause sounds confusion between teacher’s voice and it’s reflecting sounds [16]. Therefore, RT has become an important parameter in classroom architectural design in order to achieve and maintain the ideal RT value. Process flow of the proposed system was summarize as in Figure 1.
Figure 1. Experimental process flow
START
Load data of surface material images and rectangular shaped classroom models
Compute and simulate the RT output using ODEON
12.20
Divide data into training and testing set
Training data with frequency of 500 Hz, 1 kHz and 2 kHz
Epoch > 1000 No
Testing data and observe the accuracy and regression (R)
Yes
Validation with actual room measurements
2. DEVELOPMENT OF FEED FORWARD NEURAL NETWORK (FFNN) RT PREDICTION SYSTEM
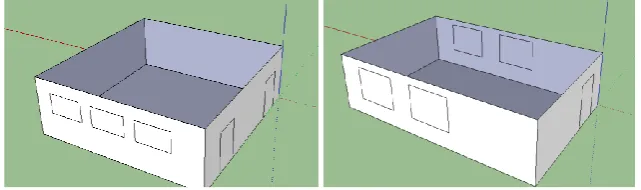
The neural network dataset was collected from rectangular shaped classroom models as seen in Figure 2. This classroom model was sketched using Google SketchUp with different in heights, widths, and lengths. Window was also added to some of the models.
[image:3.595.144.465.211.306.2]The RT output values from these classroom models were computed and simulated using ODEON 12.10 ray-tracing simulation. Different materials were applied to the surface and the sound source was placed randomly for each model in the dataset. At the end, 600 data that consists of various models and surface materials were successfully gathered.
Figure 2. Samples of room models
Frequency of 500Hz, 1000Hz and 2000Hz, were chosen in order to complete the train and analysis of FFNN system. (2), (3), and (4) show RT for 500 Hz, 1000 Hz and 2000Hz, respectively. 13 variables were applied as FFNN input features and requested to compute the RT. Input dataset geometrical characteristics for the FFNN training dataset was shown in [17].
RT500 = f(V, L, W, H, Sαw1[500], Sαw2[500], Sαfl[500], Sαdoor[500], Sαcei[500], Sαwin[500], x/L, y/W, z/H) (2)
RT1000 = f(V, L, W, H, Sαw1[1000], Sαw2[1000], Sαfl[1000], Sαdoor[1000], Sαcei[1000], Sαwin[1000], x/L, y/W, z/H) (3)
RT2000 = f(V, L, W, H, Sαw1[2000], Sαw2[2000], Sαfl[2000], Sαdoor[2000] , Sαcei[2000], Sαwin[2000], x/L, y/W, z/H) (4)
3. FEED FORWARD NEURAL NETWORK (FFNN) TRAINING PERFORMANCE
In this experiment, 60%, 20%, and 20% data from the dataset is used as the training data, validation data and testing data, respectively. The training data is used to train and fit the models; the validation data is used to estimate the prediction error for the model selection, as well as prevent network from overfitting; the test set is used for the assessment of the generalization error of the final chosen model [18]. The test data should be unknown or new to the FFNN system. Figure 3 shows the regression plots for training, validation, and testing data for 500Hz, 1000Hz and 2000Hz, respectively.
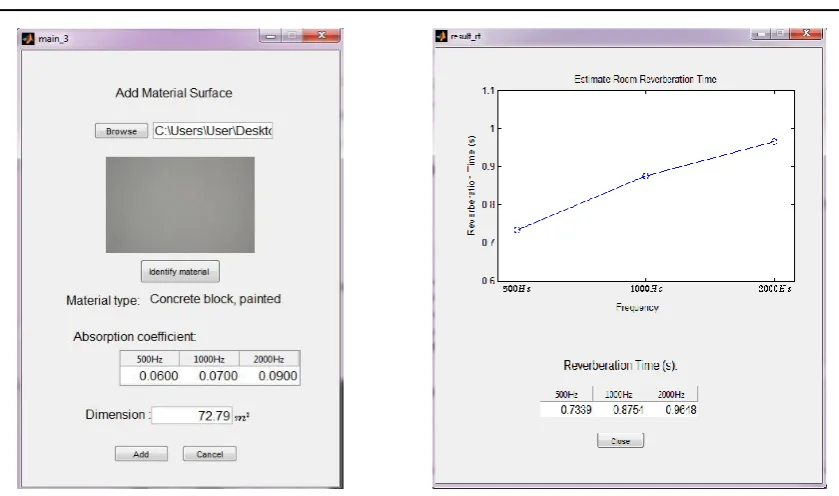
The optimum network for 500Hz, 1000Hz, and 2000Hz were lastly combined into one final system using Matlab GUI. Figure 4 shows the main page in the final system, where the users are required to fill up the values needed in the NN computation.
(a). 500Hz
(b) 1000Hz
(c) 2000Hz
Figure 3. Regression value for (a). 500Hz, (b)1000Hz, and (c)2000Hz
Figure 5. Interface page of adding Figure 6. Result page of the system material surface
4. VALIDATION WITH ACTUAL ROOM MEASUREMENTS
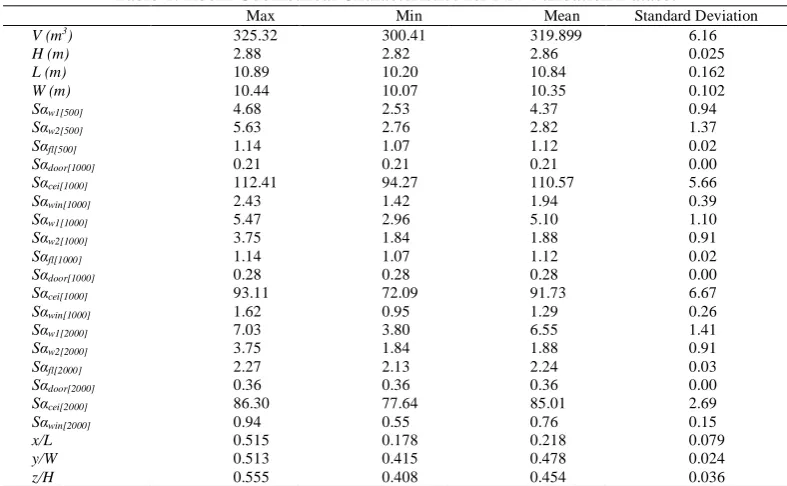
[image:5.595.102.522.66.314.2]The finished system is then applied to the actual classrooms. 15 classrooms (CR01 - CR15) in UTHM were sampled and real-time RT measurements were taken using the regular reverberation room method. Figure 7 shows an example of the actual RT measurement. For comparison, the sampled classrooms were also modeled and simulate using ODEON 12.10 as shown in Figure 8. The geometrical characteristic for these 15 classrooms are compiled in Table 1.
[image:5.595.191.419.453.585.2]Figure 7. Example of actual room measurement using reverberation time method
[image:5.595.115.511.641.722.2]Table 1. Room Geometrical Characteristics for NN Validation Dataset
Max Min Mean Standard Deviation
V (m3) 325.32 300.41 319.899 6.16
H (m) 2.88 2.82 2.86 0.025
L (m) 10.89 10.20 10.84 0.162
W (m) 10.44 10.07 10.35 0.102
Sαw1[500] 4.68 2.53 4.37 0.94
Sαw2[500] 5.63 2.76 2.82 1.37
Sαfl[500] 1.14 1.07 1.12 0.02
Sαdoor[1000] 0.21 0.21 0.21 0.00
Sαcei[1000] 112.41 94.27 110.57 5.66
Sαwin[1000] 2.43 1.42 1.94 0.39
Sαw1[1000] 5.47 2.96 5.10 1.10
Sαw2[1000] 3.75 1.84 1.88 0.91
Sαfl[1000] 1.14 1.07 1.12 0.02
Sαdoor[1000] 0.28 0.28 0.28 0.00
Sαcei[1000] 93.11 72.09 91.73 6.67
Sαwin[1000] 1.62 0.95 1.29 0.26
Sαw1[2000] 7.03 3.80 6.55 1.41
Sαw2[2000] 3.75 1.84 1.88 0.91
Sαfl[2000] 2.27 2.13 2.24 0.03
Sαdoor[2000] 0.36 0.36 0.36 0.00
Sαcei[2000] 86.30 77.64 85.01 2.69
Sαwin[2000] 0.94 0.55 0.76 0.15
x/L 0.515 0.178 0.218 0.079
y/W 0.513 0.415 0.478 0.024
z/H 0.555 0.408 0.454 0.036
aV, room volume; L, length; W, width; H, height; Sα
w1, equivalent absorption coefficient of wall1 area;
Sαw2, equivalent absorption coefficient of wall2 area; Sαfl, equivalent absorption coefficient of floor area;
Sαdoor, equivalent absorption coefficient of door area; Sαcei, equivalent absorption coefficient of ceiling area;
Sαwin, equivalent absorption coefficient of window area; and x/L, y/W, z/H are the sound source position.
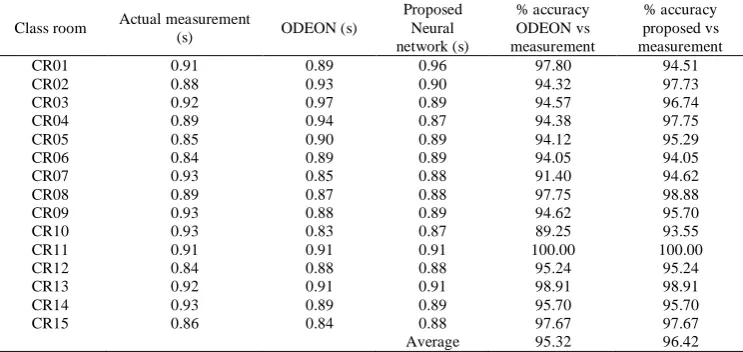
Table 2-4 show the results comparison between the actual physical measurement, ODEON 12.10 simulation, and the proposed FFNN system for frequencies of 500Hz, 1000Hz and 2000Hz, respectively. As the initial FFNN trainings were done per frequency, the validation tables were separated in order to observe each FFNN system efficiency.
From the results obtained, it can be observed that the error between the proposed FFNN system and the actual physical measurement are all within the accepted range of ±0.1s with the average accuracy percentage of 94.35%, 95.91%, and 96.42% for 500Hz, 1000Hz, and 2000Hz, respectively. The average percentage accuracy between the proposed system and the actual physical measurement is 1.18% lower for the 500Hz frequency, 2.2% higher for the 1000Hz frequency, and 1.1% higher for the 2000Hz frequency than the percentage accuracy between the ODEON simulation and the actual physical measurement. This shows that the proposed system managed to produces up to par results as the ODEON ray-tracing simulation for classroom RT estimation.
Table 2. Validation for 500Hz Frequency
Class room Actual measurement
(s) ODEON (s)
Proposed Neural network (s) % accuracy ODEON vs measurement % accuracy proposed vs measurement
CR01 0.74 0.71 0.73 95.95 98.65
CR02 0.75 0.76 0.79 98.67 94.67
CR03 0.74 0.81 0.79 90.54 93.24
CR04 0.72 0.77 0.80 93.06 88.89
CR05 0.77 0.71 0.81 92.21 94.81
CR06 0.72 0.72 0.81 100.00 87.50
CR07 0.80 0.74 0.81 92.50 98.75
CR08 0.81 0.76 0.78 93.83 96.30
CR09 0.83 0.75 0.78 90.36 93.98
CR10 0.80 0.78 0.79 97.50 98.75
CR11 0.73 0.72 0.78 98.63 93.15
CR12 0.74 0.72 0.81 97.30 90.54
CR13 0.80 0.79 0.85 98.75 93.75
CR14 0.81 0.78 0.83 96.30 97.53
CR15 0.76 0.74 0.80 97.37 94.74
[image:6.595.123.488.569.750.2]Table 3. Validation for 1000Hz Frequency
Class room Actual measurement
(s) ODEON (s)
Proposed Neural network (s) % accuracy ODEON vs measurement % accuracy proposed vs measurement
CR01 0.85 0.88 0.88 96.47 96.47
CR02 0.85 0.92 0.88 91.76 96.47
CR03 0.87 0.97 0.87 88.51 100.00
CR04 0.86 0.95 0.88 89.53 97.67
CR05 0.85 0.89 0.90 95.29 94.12
CR06 0.81 0.90 0.90 88.89 88.89
CR07 0.87 0.85 0.89 97.70 97.70
CR08 0.90 0.94 0.87 95.56 96.67
CR09 0.89 0.85 0.88 95.51 98.88
CR10 0.88 0.83 0.87 94.32 98.86
CR11 0.95 0.89 0.87 93.68 91.58
CR12 0.82 0.88 0.88 92.68 92.68
CR13 0.92 0.99 0.96 92.39 95.65
CR14 0.92 0.97 0.94 94.57 97.83
CR15 0.84 0.83 0.88 98.81 95.24
Average 93.71 95.91
Table 4. Validation for 2000Hz Frequency
Class room Actual measurement
(s) ODEON (s)
Proposed Neural network (s) % accuracy ODEON vs measurement % accuracy proposed vs measurement
CR01 0.91 0.89 0.96 97.80 94.51
CR02 0.88 0.93 0.90 94.32 97.73
CR03 0.92 0.97 0.89 94.57 96.74
CR04 0.89 0.94 0.87 94.38 97.75
CR05 0.85 0.90 0.89 94.12 95.29
CR06 0.84 0.89 0.89 94.05 94.05
CR07 0.93 0.85 0.88 91.40 94.62
CR08 0.89 0.87 0.88 97.75 98.88
CR09 0.93 0.88 0.89 94.62 95.70
CR10 0.93 0.83 0.87 89.25 93.55
CR11 0.91 0.91 0.91 100.00 100.00
CR12 0.84 0.88 0.88 95.24 95.24
CR13 0.92 0.91 0.91 98.91 98.91
CR14 0.93 0.89 0.89 95.70 95.70
CR15 0.86 0.84 0.88 97.67 97.67
Average 95.32 96.42
5. CONCLUSION
An RT estimation system was built using feed forward neural network and the data for the FFNN training was computed using ODEON 12.10 ray-tracing method. The built system shows positive results with average validation accuracy of 94.35%, 95.91%, and 96.42% for 500Hz, 1000Hz, and 2000Hz respectively compared to the actual measurement using reverberation room method. From the results gathered, the built system has shown a huge potential for commercialization although the system works are still wide open for exploration and improvement, such as applying the adaptive filter to eliminate the source of speaker identification noise [19].
ACKNOWLEDGEMENTS
The financial support received from the TIER 1 RESEARCH GRANT: Vot U867, Office for Research, Innovation, Commercialization and Consultancy Management (ORICC), Universiti Tun Hussein Onn Malaysia is gratefully acknowledged.
REFERENCES
[1] W. C. Sabine, Collected Papers on Acoustics (Peninsula, Los Altos, CA). 1900–1915.
[2] I.J. Kelly and F.M. Boland, "Randomness and the reverberation time, RT 60, of acoustic responses," IEEE International Conference on Acoustics, Speech and Signal Processing (ICASSP), pp. 8222-8226, 2014.
[3] D. Fitzroy, "Reverberation formulae which seems to be more accurate with non-uniform distribution of absorption,"
[image:7.595.120.492.303.479.2][4] R.O. Neubauer, "Estimation of reverberation time in rectangular rooms with non-uniformly distributed absorption using a modified Fitzroy equation," Building Acoustics, vol. 8(2), pp. 115-137, 2001.
[5] B. Dumortier and E. Vincent, "Blind RT60 estimation robust across room sizes and source distances," IEEE International Conference on Acoustics, Speech and Signal Processing (ICASSP), pp. 5187-5191, 2014.
[6] L.L. Beranek, "Analysis of Sabine and Eyring equations and their application to concert hall audience and chair absorption," Journal of the Acoustical Society of America, vol. 120(3), pp. 1399-1410, 2006.
[7] M.S. Hamidon, et al., "Simulation of Acoustically Demanding Space by Using Odeon Software," Dissertation, Universiti Tun Hussein Onn Malaysia; 2015.
[8] V. Easwaran and A. Craggs, "An application of acoustic finite element models to finding the reverberation times of irregular rooms," Acta Acustica united with Acustica, vol. 82(1), pp. 54-64, 1996.
[9] U. Ayr, et al., "On the use of FEM and FDTD numerical methods to predict acoustic behavior of small rooms," In SCORE@ POLIBA, 1st Workshop on the State of the Art and Challenges of Research Efforts at POLIBA, pp. 403-407, 2014.
[10] T.J. Cox, et al., "Extracting room reverberation time from speech using artificial neural networks," Journal of the Audio Engineering Society, vol. 49(4), pp. 219-230, 2001.
[11] J. Nannariello and F. Fricke, "The prediction of reverberation time using neural network analysis," Applied Acoustics, vol. 58(3), pp. 305-325, 1999.
[12] M. N. Yahya, et al., "Investigation the capability of neural network in predicting reverberation time on classroom, "
International Journal of Sustainable Construction Engineering & Technology, vol. 1(1), pp. 1-13, 2010.
[13] M. Aliabadi, et al., "Development of an Empirical Acoustic Model for Predicting Reverberation Time in Typical Industrial Workrooms Using Artificial Neural Networks," Acta Acustica united with Acustica, vol. 100(6), pp. 1090-1097, 2014.
[14] A.T.V. Rabelo, et al., "Effect of classroom acoustics on the speech intelligibility of students," In CoDAS, vol. 26(5), pp. 360-366, 2014.
[15] B. Rasmussen, et al., "Reverberation time in class rooms – Comparison of regulations and classification criteria in the Nordic countries," In Proceedings of Joint Baltic-Nordic Acoustics Meeting, 2012.
[16] “Classroom Acoustics," Acoustical Society of America, 2002. Retrieved from
http://asa.aip.org/classroom/booklet.html.
[17] F.L. Zainudin, et al., "Prediction of Classroom Reverberation Time using Neural Network," Journal of Physics: Conference Series, vol.995(1), 2018.
[18] T. Hastie, et al., "The Elements of Statistical Learning: Data Mining, Inference, and Prediction," Second Edition. 2009.
[19] I. Permana, "A comparative study on similarity measurement in noisy voice speaker identification," Indonesian Journal of Electrical Engineering and Computer Science, vol. 1(3), pp. 590-596, 2016.
BIOGRAPHIES OF AUTHORS
Fathin Liyana Zainudin received Master of Electrical Engineering from Universiti Kebangsaan Malaysia, Malaysia, in 2008. She currently pursue Doctoral degree in Electrical and Electronic Engineering, at Universiti Tun Hussein Onn Malaysia. Her research interest including artificial intelligent, acoustic engineering, image processing and embedded system.
Sharifah Saon is currently a Senior Lecturer in the Faculty of Electrical and Electronic Engineering, Universiti Tun Hussein Onn Malaysia, Malaysia. He received the Bachelor of
Science in Electrical Engineering and Master of Electrical Engineering from Universiti
Teknologi Malaysia, and Kolej Universiti Tun Hussein Onn Malaysia, Malaysia, in 2001, and 2004, respectively. Her research interest is in the area of theoretical digital signal processing, visible light communication and digital & data communication. Including the application to IoT and bigdata analysis. She is a Member of IEEE, Institute of Engineering Malaysia (IEM) and Board of Engineering Malaysia (BEM).
Musli Nizam Yahya is currently an Associate Professor in Department of Mechanics, Faculty of Mechanical and Manufacturing, Universiti Tun Hussein Onn Malaysia (UTHM) and he also a Director of Occupational Safety, Health and Environment (OSHE) since 2017 until 2019. He received the B.E (Hons) and M.E form the same university in 2002 and 2006, respectively. Then, he pursued his Phd in Engineering form Oita University, Japan in 2012. His research interests are in area of acoustic, noise environment, noise and vibration, and occupational safety and health (OSH). He is a founder of Society of Vibration & Acoustics Malaysia (SVAM) since 2013, and associate member of Acoustical Society of America (ASA). Besides, he also plays many roles such as book editor and reviewer of technical papers of conferences and journals such as Applied Acoustic.
Mohd Anuaruddin Ahmadon graduated from Kumamoto National College of Technology, Japan,
in 2012. He received his B.Eng. (2014), M.Eng. (2015) and Dr.Eng. (2017) from Yamaguchi University, Japan. He is currently an Assistant Professor at Graduate School of Sciences and Technology for Innovation, Yamaguchi University. He was awarded IEEE Consumer Electronics Society East-Japan Young Scientist Paper Award in 2016. His research interest includes software engineering, service engineering and its application to Internet of Things, multi-agent system and cyber-security. He is a member of IEEE and IEICE, Japan.