International Journal of Emerging Technology and Advanced Engineering
Website: www.ijetae.com (ISSN 2250-2459,ISO 9001:2008 Certified Journal, Volume 3, Issue 2, February 2013)
250
Adaptive Modulation and Coding Rate for OFDM Systems
T.S.Harivikram
1, Dr. R.Harikumar
2, Dr. C.Ganesh Babu
3, P.Murugamanickam
41Design Engineer, TATA
Elxsi
Ltd., Trivandrum, India.2,3Professor, Department of Electronics and Communication Engineering, Bannari Amman Institute of Technology,
Sathyamangalam, India.
4Senior Design Engineer Alcatel-Lucent. Bangalore
Abstract— Wireless communication is observing a fast development in today’s communication era. A poorly designed path can result in periodic system outages, resulting in increased system latency, decreased throughput, or worst case, a complete failure of the system. Planning a good, stable and reliable network can be quite challenging. At the same time, it poses several interesting optimization problems.
Today wireless technology is used in many applications well integrated into our everyday life. The basic motto of communication system is to ensure the exchange of information in between the people. When this communications without wired then it’s referred to wireless communications. Now-a-days, this wireless communications gets more attention from the Communication industry and provide better quality information transfer between portable devices. After the implementation of 3G network, numerous applications like Autonomous sensor networks, Multimedia, Videoconferencing, and Distance learning and Internet enabled cell phone are developed. Also Long Term Evolution (LTE) is going to evolve to increase the data rate, increase throughput, decrease latency, etc, for the above applications and also to bring lot of applications.
Our primary design objective in this paper is to minimize the error probability of a LTE system and to bring the spectrum efficiency through a process known as adaptive modulation and coding rate. LTE normally uses OFDM as its technology and we are going to implement the adaptive modulation in OFDM systems
Keywords— Adaptive modulation, Channel coding, Orthogonal Frequency division multiplexing (OFDM), Signal to Noise ratio (SNR), Bit error rate (BER).
I. INTRODUCTION
During the past few years, there has been an explosion in wireless technology. This growth has opened a new dimension to future wireless communications whose ultimate goal is to provide universal personal and multimedia communication without regard to mobility or location with high data rates [1]. To achieve such an objective, the next generation personal communication networks will need to be support a wide range of services which will include high quality voice, data, facsimile, still pictures and streaming video.
These future services are likely to include applications which require high transmission rates of several Mega bits per seconds (Mbps) [2]. At this moment, the data rate envisioned for 4G networks is 1 GB/s for indoor and 100Mb/s for outdoor environments [3].
When the data is transmitted at high bit rates, over mobile radio channels, the channel impulse response can extend over many symbol periods, which lead to inter symbol interference (ISI). Orthogonal Frequency Division Multiplexing (OFDM) is one of the promising candidates to mitigate the ISI. In an OFDM signal the bandwidth is divided into many narrowband channels. Each sub channel is typically chosen narrow enough to eliminate the effect of delay spread [4].
Equipment vendors are coming together to speed the adoption of OFDM, which will be part of the 4G set of standards. Orthogonal Frequency Division Multiplexing OFDM is a multicarrier transmission technique, many carriers, each one being modulated by a low rate data stream share the transmission bandwidth [5].
Dunlop and Pons [6] asserted that BER at receiver level can be good enough to decide switching scheme. The adaptation rate would be restricted because BER estimation is complicated over short periods. Now, the question arises: How and what ranges of SNR can be best to use for which modulation scheme? The answer according to Md. Rakib Al Mahmud and Zaigham Shabbir Khan. Would be finding
in performance of AWGN for each modulation scheme [7]
.
Adaptive modulation is a way to provide balance between Bit Error Rate (BER) and SNR through the improvement of the Spectral Efficiency. It is possible to make effective use of adaptive modulation in a slowly varying fading channel with noise based on SNR estimation.
Kamran Arshad [8] also proposes an adaptive scheme of channel estimation in wireless OFDM systems, which tracks the multipath fading channel by using the LMS
algorithm
.
International Journal of Emerging Technology and Advanced Engineering
Website: www.ijetae.com (ISSN 2250-2459,ISO 9001:2008 Certified Journal, Volume 3, Issue 2, February 2013)
251 The performance of OFDM signal transmitted with and without adaptive modulation is done using computer simulations performed using MatLAB. It was found that OFDM signal with adaptive modulation and coding rate performs extremely well than ordinary OFDM signal transmission without adaptive modulation and coding rate. Also it maintains the bit error rate and spectrum efficiency.
II. MATERIALS AND METHODS
A. Proposed model
To adapt the modulation and coding rate in OFDM systems as per the channel some pilot bits are generated and allowed to transmit in the modelled AWGN channel. It is then received by the receiver and measures the Channel SNR. After that it decides the modulation type and coding rate. Then it sends feedback to the transmitter. After that the message bits will be transmitted as per the feedback. The proposed adaptive modulation and channel coding block diagram is as follows.
Fig.1 Basic Block diagram of the proposed paper
B. SNR Measurement
In communication systems, the comparison of signal power with the noise power at the same point is important; to ensure that noise at that point is not excessively large. It is defined as the ratio of signal power to the noise power at that same point.SNR = Ps/Pn; where Ps is the signal power and Pn is the noise power at that point. The SNR is usually represented in dB.
SNR (in dB) = 10 log 10(Ps/Pn)
C. Channel Model
In this project, to model AWGN channel, the channel SNR is given as the input and signal power is known. From the above data noise power can be calculated.
The random bits founded to be zero mean and unit variance (Gaussian bits) are generated and are found to be white (Uncorrelated). Then the bits are normalized with multiplying that with noise power. Hence noise for generated. The signal which is to be transmitted is added with the noise generated. Hence the received signal will become noisy one.
D. Pilot pattern Arrangement
For practical OFDM systems, the frequency spacing is less than the coherence bandwidth and the symbol time is less than the coherence time. This means that a receiver and pilot estimation pattern that take advantage of the relatively large coherence bandwidth and coherence time can manage with less pilot symbols, thereby minimizing the overhead introduced by the pilot symbols. In this project it is decided to measure all channels at the same time, as shown in Fig 2.
Fig 2 Pilot Pattern Arrangement
E. Convolutional Encoder
Our work also deals primarily with error control coding for noisy channels, called the noisy channel coding theorem, which can be paraphrase as such, Shannon’s Noisy Channel Coding Theorem With every channel we can associate a ―channel capacity‖ C (bits/sec). There exist such error control codes that information can be transmitted at a rate below C (bits/sec) with an arbitrarily low bit error rate. Shannon believed that information bits could be transmitted near C with a small probability of error given that proper channel encoding and decoding could be attained.
The rate of the encoder is determined by the fact that the encoder outputs two bits for every one bit at the input. In general, an encoder with k input bits and n output bits is said to have a rate k/n. The rate k/n is defined as the code rate (Rc) of the system.
SNR Estimator OFDM
Transmitter
OFDM Receiver AWGN
Channel
International Journal of Emerging Technology and Advanced Engineering
Website: www.ijetae.com (ISSN 2250-2459,ISO 9001:2008 Certified Journal, Volume 3, Issue 2, February 2013)
[image:3.612.342.542.118.195.2]252 Fig.3 Convolutional Encoder
Fig.3 is a binary rate 1/2 linear Convolutional encoder from Wi-Max datasheet. The rate of the encoder is determined by the fact that the encoder outputs two bits for every one bit at the input.
F. Punctured Convolution codes
[image:3.612.76.259.125.228.2]Classes of codes called punctured Convolutional codes were introduced by Cain and Clark in 1979. By periodically deleting bits via a puncturing matrix these codes allow for higher rate codes, which give a higher coding gain while not suffering the implementation penalty from a large value of k. If the encoder structure is a lower rate code 1/n, then there are only 2k computations for each node at the decoding trellis, which is suitable for practical implementations. Assume the mother code, or standard encoder structure, is rate 1/2. For k input bits the encoder output n bits.
TABLE I
THE INNER CONVOLUTIONAL CODE WITH PUNCTURING CONFIGURATION
The puncturing device deletes symbols from the code sequence according to the puncturing matrix. The puncturing configuration for various coding rates is given in the Table I from Wi-Max datasheet.
III. RESULTS AND DISCUSSION
A. Results of various modulations with different SNR values
Totally 1*106 random bits has been generated and are
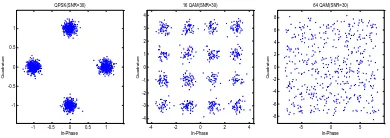
transmitted in 15 dB channel using QPSK, 16 QAM, 64 QAM modulations; the following scatter plot is obtained.
Fig. 4 Plot of various modulations over 15 dB channel
[image:3.612.345.540.283.352.2]From the Fig 4, it is seen that chances for error using QPSK is less than compared to other modulations. When that bits are transmitted in 30 dB channel using QPSK, 16 QAM, 64 QAM modulations; the following scatter plot is obtained.
Fig 5 Plot of various modulations over 30 dB channel
From the Fig 5, it is seen that chances for error using QPSK and 16 QAM is less than compared to 64 QAM. But if we use 16 QAM, spectral efficiency will be more. When that bits are transmitted in 30 dB channel using QPSK, 16 QAM, 64 QAM modulations; the following scatter plot is obtained. From the Fig 6, it is seen that chances for error will be less under all modulation. But if we use 64 QAM, spectral efficiency will be more.
Fig 6 Plot of various modulations over 30 dB channel
B. Performance of BER vs. SNR for OFDM System
To plot SNR value versus Bit error rate, the SNR value has constantly changed from 0 to 100 with an interval of 5. Then the OFDM signal is modulated with all possible modulation and passed through the channel with all possible SNR values. Then the OFDM signal is received and the bits are demodulated. The bit error rate is computed when 2*106 bits are transmitted in OFDM system and the plot is shown in Fig 7.
System’s BER is chosen as 10-4 and following result is obtained. The following conclusion has been obtained from the plot and used for adaptive modulation.
Code Rates
Rate ½ 2/3 ¾ 5/6
X 1 10 101 10101
Y 1 11 110 11010
XY X1Y1 X1Y1Y2 X1Y1Y2X3 X1Y1Y2X3Y4X5
-3 -2 -1 0 1 2 3 -3 -2 -1 0 1 2 3 Q u a d ra tu re In-Phase 16 QAM(SNR=45)
-1 -0.5 0 0.5 1 -1 -0.5 0 0.5 1 Q u a d ra tu re In-Phase QPSK(SNR=45)
-5 0 5
-8 -6 -4 -2 0 2 4 6 8 Q u a d ra tu re In-Phase 64 QAM(SNR=45) -1 -0.5 0 0.5 1
-1 -0.5 0 0.5 1 Q ua d ra tu re In-Phase QPSK(SNR=30)
-4 -2 0 2 4 -4 -3 -2 -1 0 1 2 3 4 Q ua d ra tu re In-Phase 16 QAM(SNR=30)
-5 0 5 -8 -6 -4 -2 0 2 4 6 8 Q ua d ra tu re In-Phase 64 QAM(SNR=30) -1.5 -1 -0.5 0 0.5 1 1.5
-1.5 -1 -0.5 0 0.5 1 1.5 Q u ad ra tu re In-Phase QPSK (SNR=15)
-5 0 5
-5 -4 -3 -2 -1 0 1 2 3 4 5 Q u ad ra tu re In-Phase 16 QAM (SNR=15)
[image:3.612.340.546.477.549.2]International Journal of Emerging Technology and Advanced Engineering
Website: www.ijetae.com (ISSN 2250-2459,ISO 9001:2008 Certified Journal, Volume 3, Issue 2, February 2013)
253 0 - 42 db = QPSK modulation and 3/4 coding will be chosen by the system
42 - 56 db = 16- QAM modulation and 2/3 coding will be chosen by the system
[image:4.612.56.278.192.369.2]Above 56 db = 64- QAM modulation and ½ coding will be chosen by the system
Fig 7 BER vs. SNR plot for various modulations
C. Adaptive Modulation for OFDM System
As we seen previously, some bits called pilot bits will be transmitted. Based on the pilot bits received the channel will be measured. Then from the thresholds found above, the suitable modulation can be chosen. It is shown in Fig 8.
Figure 1: Scatter plot of Pseudo bits transmitted using QPSK modulation
Figure 2: Scatter plot of Pseudo bits Received
[image:4.612.336.543.227.395.2]Figure 3: Scatter plot of Message bits transmitted using adaptive modulation (64 QAM)
Figure 4: Scatter plot of Message bits Received
[image:4.612.75.256.508.652.2].
Fig 8 Adaptive OFDM modulation example
D. Adaptive modulation & Channel coding for time varying channels
The channel may change at any time. So the coding is enhanced in such a way that the pilot bits will be transmitted for every 10 ms (14 OFDM symbols). Then as per the channel the suitable modulation will be used for transmission. This will be done until the last bit will be transmitted. The output plot obtained when 100000 bits are transmitted in the following time varying channel.
0 – 10 ms 42 dB
10 - 20 ms 25 dB
20 to 30 ms 58 dB
30 to 40 ms 21 dB.
Fig 9 Adaptive OFDM modulation plot for time varying signal
E. BER Performance of the System with and without AMC
The following graph shows the BER performance with and without and adaptive modulation and channel coding.
This is obtained when 2*106 bits are transmitted. From the
above graph, At BER = 10-3, SNR = 53 db for the signal transmitted without using Adaptive modulation and channel coding. SNR = 26 db for the signal transmitted using Adaptive modulation and channel coding. So the gain is 27 if transmitted using adaptive modulation and channel coding.
[image:4.612.331.557.536.678.2]International Journal of Emerging Technology and Advanced Engineering
Website: www.ijetae.com (ISSN 2250-2459,ISO 9001:2008 Certified Journal, Volume 3, Issue 2, February 2013)
254 F. PER Performance of the System with and without AMC
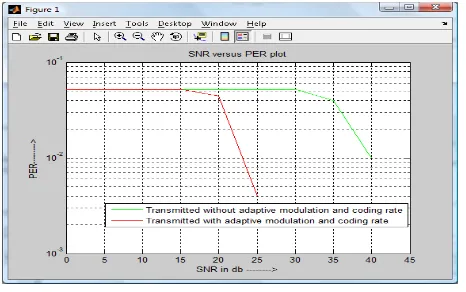
The following graph shows the PER performance with and without and adaptive modulation and channel coding. This is obtained when 104 packets are transmitted. Each packet contains 300 bits.
Fig 11 PER vs. SNR comparison with and without Adaptive modulation and coding rate
From fig 11, At BER = 10-2, SNR = 40 db for the signal transmitted without using Adaptive modulation and channel coding. SNR=22 db for the signal transmitted using Adaptive modulation and channel coding. The gain is 18 dB if we transmit using adaptive modulation and channel coding.
IV. CONCLUSION
Long term evolution is going to evolve in the coming years with Orthogonal Frequency Division Multiplexing has its key. OFDM has been recently applied widely in wireless communication systems due to its high data rate transmission capability with high bandwidth efficiency and its robustness to multipath delay. In this project, we investigated the Performance of OFDM systems with and without adaptive modulation, and via simulations we
demonstrated effectiveness adaptive modulation in
Orthogonal Frequency Division Multiplexing.
The performance of Bit error rate and spectral efficiency of various digital modulations like QPSK, 16 QAM, 64 QAM is analyzed in this project and compared with the adaptive modulation technique is shown in Table II.
[image:5.612.53.286.187.333.2] [image:5.612.330.570.195.308.2]If we use adaptive modulation technique, always the BER will be maintained constant and that too can be specified. Also Spectrum will be efficiently used in whatever condition the channel may be.
TABLE II
SUMMARY OF THE PROJECT
Acknowledgement
We like to express our sincere thanks to principal and management of Bannari Amman institute of Technology for their constant support for doing this project. We would also like to express our gratitude to Larsen and Toubro Infotech, Bangalore for sponsoring this project.
REFERENCES
[1] C. G. Ginnther, J. E. Padgett and T. Hattori, 1995, ―Overview of wireless communications,‖ IEEE Communication Magazine, vol. 33, pp. 28–41.
[2] K. Ben Lataief, J. C. I. Chang and R. D. Murch, 1996, ―A high transmission method for wireless personal communication,‖ Kluwer Academic Publisher, vol. 3, pp. 229–317.
[3] P. Mahonen and G. C. Polyzos, 2001, ―European Research and Development on Fourth-Generation Mobile and Wireless IP Networks [Guest Editorial],‖ IEEE Personal Communications, vol. 8, pp. 6–7.
[4] R. Van Nee and R. Prasad, 2000,―OFDM for Wireless Multimedia Communications,‖ Artech House Publishers, Massachusetts. [5] R. Chang, 1966,―Synthesis of band limited Orthogonal Signals for
multichannel data transmission,‖ BSTJ, vol. 46, pp. 1775–1796. [6] Spector, A. Z. 1989. Achieving application requirements. In
Distributed Systems, S. Mullende
[7] Kamran Arshad,, Department of Electrical Engineering, King Fahd University of Petroleum and Minerals Dhahran, Saudi Arabia, ―A Thesis On Channel estimation in OFDM Systems‖ 2002.
[8] OFDM Project Final Report 2E1367 - Project Course In Signal Processing And Digital Communication by Black Team (Jia Liu, Erik Bergenudd, Vinod Patmanathan, Romain Masson) KTH, Stockholm,30th May 2005
Modulation & Coding rate
BER Performance Spectral Efficiency
QPSK with ¾ Low error Worst 16 QAM with 2/3 Good for Higher SNR
Worst for Lower SNR
Medium
64 QAM with ½ Worst for Lower SNR Good
Adaptive Will be maintained as specified
International Journal of Emerging Technology and Advanced Engineering
Website: www.ijetae.com (ISSN 2250-2459,ISO 9001:2008 Certified Journal, Volume 3, Issue 2, February 2013)
255 Mr. T. S. Harivikram received his B.E (ECE) degree from Bannari Amman Institute of Technology Sathyamangalam, Anna University Chennai in 2011. He has three International and conferences publication. He is currently working as assistant Design Engineer in TATA Elxsi Trivandrum. His area of interest is VLSI Design, Embedded systems and Advanced Electronics Engineering.
Dr. R. Harikumar received his B.E (ECE) Degree from REC (NIT) Trichy in 1988..He obtained his M.E (Applied Electronics) degree from College of Engineering, Guindy, Anna University Chennai in 1990. He was awarded Ph.D. in I &C Engg from Anna university Chennai in 2009. He has 22 years of teaching experience at college level. He worked as faculty at Department of ECE, PSNA College of Engineering & Technology, Dindigul. He was Assistant Professor in IT at PSG College of Technology, Coimbatore. He also worked as Assistant Professor in ECE at Amrita Institute of Technology, Coimbatore. Currently he is working as Professor ECE at Bannari Amman Institute of Technology, Sathyamangalam. He has published fifty six papers in International and National Journals and also published around ninty three papers in International and National Conferences conducted both in India and abroad. His area of interest is Bio signal Processing, Soft computing, VLSI Design and Communication Engineering.He is guiding nine PhD theses in these areas. He is life member of IETE, ISTE , IAENG,and member IEEE.
Dr. C. Ganesh Babu graduated in Electronics and Communication Engineering from P S G College Technology, (Bharathiyar University), Coimbatore, during 1994. He obtained his post graduation in Microwave and Optical Engineering from Alagappa Chettiar College of Engineering and Technology, Karaikudi (Madurai Kamaraj University, Madurai), during 1997. He obtained his PhD from Anna university Chennai in the Information and Communication Engineering, during 2010. At present he is working as Professor in the Department of Electronics and Communication Engineering, Bannari Amman Institute of Technology, Sathyamangalam, Tamil Nadu. He has around 14 years of teaching experience and 7 years of research experience.His areas of interest are Speech Signal Processing, Digital Communication and Virtual Instrumentation. His is guiding three Ph.D these in these area.