DEHEMS Cycle 1 Quantitative and Qualitative Analysis
Vasughi SundramoorthyFrank Qi Liu
School of Computing, Science & Engineering Salford, Greater Manchester M5 4WT, UK
University of Salford [email protected]
Table of Contents
List of Figures ... 2
List of Tables ... 3
1
Introduction ... 4
1.1 Research methodology ... 4
2
Quantitative and Qualitative Results ... 8
2.1 Demographic Analysis ... 9
2.1.1 Locality ... 9
2.1.2 Income ... 9
2.1.3 Household occupants ... 10
2.1.4 House configuration ... 10
2.2 Non-demographic Analysis ... 10
2.2.1 Energy Bills ... 10
2.2.2 Computer, internet usage, social networking/behaviour ... 10
2.2.3 Energy rating (EPC) of house ... 11
2.2.4 Environmental consciousness ... 11
2.2.5 Appliance understanding and usage ... 14
2.2.6 Energy saving awareness ... 20
2.2.7 Online privacy ... 26
2.3 DEHEMS User Analysis ... 26
2.3.1 Perception of users on DEHEMS ... 27
2.3.2 Benefits of DEHEMS ... 28
2.3.3 Usability issues of the Cycle 1 DEHEMS System ... 29
2.3.4 Suggestions to improve DEHEMS system... 30
2.3.5 Review of Cycle 2 DEHEMS Website Wireframes ... 31
2.4 DEHEMS Energy Data Analysis ... 32
3
Discussion and Conclusions ... 35
List of Figures
Figure 1. Research methodology ... 7
Figure 2. Breakdown of respondents' cities ... 9
Figure 3. Breakdown of income group ... 9
Figure 4. Priority of respondents for reducing energy usage. ... 12
Figure 5. Responses for “green energy” ... 13
Figure 6. Breakdown of energy sources for hot water, heating, oven, cooker grill and cooker hob. ... 14
Figure 7. Appliance coverage listed by 40 householders ... 16
Figure 8. Frequency of switching off lights ... 16
Figure 9. Appliances used during summer and winter. Bolded appliances are most often used, while coloured appliances indicate which season they are more frequently used. ... 18
Figure 10. Breakdown of appliances cited by respondents as not sharing a socket with any other appliances. Fridge, washing machine, kettle, TV, microwave and toaster are most common. ... 19
Figure 11. Various reasons cited by respondents on why they tend to use standby power, categorized into four main groups. Modelled in NVivo. The (blue) shaded leave nodes represent reasons that have the highest frequency of occurrences. ... 20
Figure 12. Priority of respondents when buying a new appliance. ... 22
Figure 13. Acceptability of the cost of installing an energy monitoring system... 23
Figure 14. The various energy saving steps quoted by 45 householders, classified into 8 main categories. Most of the future steps quoted by householders are already implemented as current practises in other households. Gray coloured steps are not currently implemented by any of the householders. Dotted line shows that energy efficient appliance use is closely related to switching off appliances. ... 24
Figure 15. Breakdown of the number of respondents who apply the ... 25
Figure 16. Breakdown on the number of respondents who would like to apply the 8 categories of energy saving steps in the future. ... 25
Figure 17. Perception of focus group participants on DEHEMS ... 27
Figure 18. NVivo model on the benefits of the DEHEMS system ... 28
Figure 19. Usability issues of the Cycle 1 DEHEMS system ... 29
Figure 20. Consolidated suggestions for improving the DEHEMS system... 30
Figure 21. Review results of the Cycle 2 DEHEMS website wireframes ... 31
Figure 22. Average daily energy usage for March – July 2009 for up to 35 households in the three cities. ... 33
Figure 23. Average daily energy usage (kWh) for March – July 2009 across three cities along with average indoor and outdoor temperatures ... 34
List of Tables
1
Introduction
One of the major objectives of the DEHEMS project is to encourage positive behaviour change in domestic energy consumers in the EU. To achieve this objective, we first have to understand and explore domestic energy consumers’ attitudes towards the environment, attitudes towards ecological behaviour (in this case, energy saving and environment behaviours), and the constraints that they face in changing their behaviour [1]. Thus the analysis efforts in Cycle 1 are an initial attempt to obtain the views of the domestic energy consumers in the three Living Labs located in the UK (Manchester, Bristol and Birmingham). This report is an early attempt to analyze the various angles of Cycle 1. Subsequent to this effort, we plan to provide scientific publications that will contain more in-depth analysis of the results along with comparisons to state of the art related work.
The report is organized as follows. Section 1 outlines the research questions that we aim to address in this report, and explains the research methodology and the methods applied in this work. Section 2 provides quantitative and qualitative results of (1) the analysis of the Cycle 1 questionnaire responses received from 45 households, (2) the qualitatively analysis of the Bristol and Birmingham focus group transcripts, (3) the brief quantitative and qualitative analysis of the DEHEMS energy and temperature sensor data collected for the months of March to July 2009. In Section 3, we conclude by discussing the results within the context of the research questions.
1.1 Research methodology
To construct the research propositions of this project, we first define the choice of research questions as posed in Section 3.3 of Deliverable 2.7 (as opposed to constructing a set of hypothesis first). The preference of defining the research questions for this study is justified by the exploratory aspects of this research [2]. Particularly, we address the following questions:
1. To what extent can the DEHEMS system contribute to users' changing their behaviour resulting in reduced energy consumption? (To what extent can we demonstrate the DEHEMS effect on the user.)
2. What are the key motivations for people in the living labs to change their behaviour towards energy conservation?
3. In what ways can motivations be changed to move more towards environmentally motivated behaviours? (E.g. shift from cost consciousness towards CO2 emission awareness as the key motivator, playing games, compete...)
5. What are the key factors that affect acceptability of the DEHEMS system to the end users? (E.g. user's perception that they are wasting more energy by installing multiple DEHEMS devices, user friendly and intuitive interfaces, cost of the DEHEMS system, complexity of the system, etc)
6. How important is it to measure other forms of energy consumptions besides electricity? Such as gas, coal, wood, oil (esp in Romania and Bulgaria).
7. Social networking - how important is it for users and what forms are there, how feasible is it to get people to participate? What about offline tools? (listed as Question 10 in Section 3.3 Deliverable 2.7).
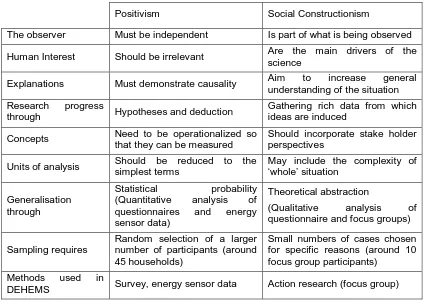
[image:5.595.86.510.398.700.2]The research philosophy we adopt is a combination of the two main traditions of philosophies; positivism and social constructionism / phenomenology [2, 3]. While positivist argue that the world exists externally and its properties should be measured through objective methods, social constructionist hold the view that the reality is not objective and exterior but is socially constructed and given meaning by people [3]. The table below outlines the contrasting implications of positivism and social constructionism.
Table 1: Contrasting implications of Positivism and Social Constructionism (adopted from Easterby-Smith et al.[3])
Positivism Social Constructionism
The observer Must be independent Is part of what is being observed Human Interest Should be irrelevant Are the main drivers of the
science
Explanations Must demonstrate causality Aim to increase general understanding of the situation Research progress
through Hypotheses and deduction
Gathering rich data from which ideas are induced
Concepts Need to be operationalized so that they can be measured
Should incorporate stake holder perspectives
Units of analysis Should be reduced to the simplest terms
May include the complexity of ‘whole’ situation
Generalisation through
Statistical probability (Quantitative analysis of questionnaires and energy sensor data)
Theoretical abstraction
(Qualitative analysis of questionnaire and focus groups)
Sampling requires
Random selection of a larger number of participants (around 45 households)
Small numbers of cases chosen for specific reasons (around 10 focus group participants)
Methods used in
DEHEMS Survey, energy sensor data Action research (focus group)
designed to ensure objectivity, form some generalizations and to provide some reliability in the research output. In the DEHEMS project, quantitative analysis is performed on two different materials; questionnaire responses and DEHEMS system sensor data collection. For the questionnaires, participants are selected randomly from the Living Lab population in an unbiased manner, and given a standardized questionnaire that contains closed (objective) questions based on some predetermined assumptions on energy behaviours (constructed by DEHEMS researchers in WP2). Around 45 respondents completed the Cycle 1 questionnaires across all three Living Labs. We used statistical tools (MS Excel and SPSS) to perform the analysis and to obtain probabilistic indication on the general public’s attitude towards the environment, ecological behaviours and the constraints they face in implementing ecological behaviours. Meanwhile analysis on the sensor data collection in Cycle 1 is less extensive; the purpose of Cycle 1 is to establish an early system for data collection, where the actual in-depth system level research is carried out for Cycle 2. Sensor data collection in Cycle 1 is basically to test that the system performs as it should, discover technical issues, and to provide a baseline for comparison against results of Cycle 2. Using SQL and MS Excel, we provide a brief observation of the results. In quantitative analysis, although the statistical process puts the researcher external to the actual research, some of the conclusions from the empirical results are done through interpretive observation.
Qualitative research is designed to provide the researcher with the perspective of target audience members through direct interaction with the people under study. These methods help researchers to understand the meanings domestic energy consumers assign to ecological and environmental issues and to elucidate the mental processes underlying ecological behaviours. Hypotheses are generated during data collection and analysis, and measurement tends to be subjective. In the qualitative paradigm, the researcher becomes the instrument of data collection (thus results vary depending upon who conducts the research). Qualitative methods generate rich, detailed data that keeps participants’ perspective intact and provide a context for ecological behaviour. In the DEHEMS project, qualitative methods include providing open questions in the questionnaires, and conducting 4 separate focus groups in Bristol and Birmingham (before and after Cycle 1). The focus groups consist of around 10 participants in an interactive setting where participants are free to talk on the targeted subject of the DEHEMS system and energy behaviours. The methods applied are interpretive technique and coding using Excel and NVivo (a tool that facilitates information to be classified, sorted and arranged so that we can explore trends or patterns that produce answers to some of the research questions). The reasoning and context of the participants’ language and perspectives during the focus group is also an input into the study of energy related semantics and ontology in WP3.
The following summarizes the input materials for the analysis:
form the answers. Open questions require qualitative analysis first (coding, interpretative), before quantitative analysis can yield empirical results.
Focus group - Topics of the focus group revolve mainly around the use of the DEHEMS system, perception of DEHEMS, and how the system can be improved. A purely qualitative analysis is applied on the transcripts (from audio recordings) of the sessions using NVivo. DEHEMS sensor data – Contains household electricity measurement and indoor
[image:7.595.76.541.239.580.2]temperature measurements which are sent every 6s to the DEHEMS server from households across Manchester, Birmingham and Bristol for the months of March to July 2009.
2
Quantitative and Qualitative Results
This section outlines the combined results of the quantitative and qualitative analysis, arranged according to the following subject matters:
1. Demographic analysis a. Locality b. Income
c. Household occupants d. Home configuration 2. Non-demographic analysis
a. Energy Bills
b. Computer, internet usage, social networking/behaviour c. Energy rating of house
d. Environmental consciousness e. Appliance understanding and usage f. Energy saving awareness
g. Online privacy 3. DEHEMS user analysis
a. Perception of users on DEHEMS b. Benefits of DEHEMS
2.1 Demographic Analysis
2.1.1 Locality
1. 45 respondents from 3 city councils in the UK
[image:9.595.219.405.178.364.2]2. 42.2% (19) are from Birmingham, 33.3% (15) from Bristol and 24.4% (11) from Manchester.
Figure 2. Breakdown of respondents' cities
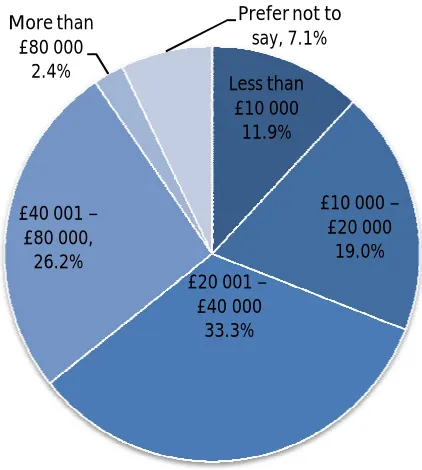
2.1.2 Income
1. 14 households earn between £20 000 to £40 000 (31.1%), and 11 (24.4%) households earn between £40 000 to £80 000.
Figure 3. Breakdown of income group Birmingham
42.2%
Bristol 33.3% Manchester
24.4% (11)
(15)
(19)
Less than £10 000
11.9%
£10 000 – £20 000
19.0% £20 001 –
£40 000 33.3% £40 001 –
£80 000, 26.2% More than
£80 000 2.4%
[image:9.595.194.405.476.711.2]2.1.3 Household occupants
1. Most households contain between 2 to 4 occupants, around 73.3%, with 2 occupants being the most common (13 households).
2. Only one-single person household above the age of 65 years.
3. 54.5% households have 2 adults (24 houses out of 44), while 16 households have children under the age of 12 years.
2.1.4 House configuration
1. The most common house configuration consists of: 1 or 2 living room / dining room (41 houses) 3 bedrooms (18 houses)
1 bath/shower room (28 houses)
1 kitchen (33 houses, the rest have 2 kitchen areas)
Almost half of the houses (21) have one or two separate toilets
2.2 Non-demographic Analysis
2.2.1 Energy Bills
1. 17 householders (37.8%) do not know anything about their bills.
2. 16 householders have monthly billing, 10 have yearly, and only 3 is quarterly billing
3. Average monthly bill is £55.78, average yearly bill is £588.33 and average quarterly bill is £149.57.
4. Almost every household do not know their kW usage
2.2.2 Computer, internet usage, social networking/behaviour
1. 19 households have Ethernet (42.2%), 17 have Wi-Fi (37.7%), and 6 have both Ethernet and Wi-Fi. Only 1 household have dial up, while 2 householders did not respond to the question. 2. This means, 93.3% have always-on internet capability with Ethernet and/or Wifi connection. 3. 91.3% of respondents say that they use internet daily. The rest use it weekly.
4. 44.2% (19 out of 43) say that they use the social networking sites at least once a week. 37.2% (16) say that they NEVER use social networking sites while 18.6% (8) say that they have no liking for it after trying it.
5. 14 people out of 45 skipped the question when asked which social networking tool that they use. Out of these 14, 10 of them had said they never use a social networking tool or have any liking for it. From the 31 that responded to this question, the most frequently used social networking tool is either MySpace / Facebook / Friendster / Blogs or Instant Messaging tool such as Skype/MSN etc. They each had 18 responses (33.3%).
2.2.3 Energy rating (EPC) of house
1. 91.1% (41) households do not know their energy rating, while only one household has a rating of A, two households have rating C and one other household has a rating of D.
2.2.4 Environmental consciousness
1. When asked How important are environmental issues to you personally, 66.7% (30) households responded that they try to keep the bills down (cost consciousness is a primary motivation) and are careful to recycle, while 25.6% (11) households responded that they proactively take care of environmental issues, and work towards limiting their carbon footprint (more conscious of environment instead of on the cost factor).
2. None showed a disinterest on environmental issues, although 2 respondents skipped this question.
3. When asked Do you have a clear understanding of your energy usage, 48.8% (20) responded that they carefully analyse the energy consumption of all their appliances and understand how each affects their total bill. Meanwhile 26.8% (11) said that they try to buy "green" appliances, but they don't really understand what it means. Only 19.5% (8) said that they carefully follow the environmental issues’ arguments and understand what a tonne of CO2 means. Only 2 households say that they don’t really pay any attention to energy usage.
Figure 4. Priority of respondents for reducing energy usage.
Table 2. Reasons to reduce energy usage Most important reasons to want to reduce
energy use
Most
important Important
Somewhat important
Not
important Total
Financial savings 20 12 8 3 43
Saving global resources / energy depletion 13 22 6 2 43
Reduce greenhouse effect / global warming 19 11 10 2 42
Just don’t like to waste unnecessarily 11 13 4 14 42
Other reasons 0 2 0 0 2
Total 63 60 28 21 172
5. Most respondents would choose “green energy” tariff if it were the same price or cheaper. Only 12.1% (4 out of 33 respondents) would still choose it if it were slightly more expensive. Clearly, the tariff plays a critical part in enabling “green energy”.
30.2%
18.3%
35.7%
9.5% 31.7%
20.0%
28.6%
14.3% 20.6%
36.7%
21.4%
9.5% 17.5%
21.7%
14.3%
66.7%
0.0% 3.3% 0.0% 0.0%
Most important Important Somewhat important Not important
Reduce greenhouse effect / global warming Financial savings
Saving global resources / energy depletion Just don’t like to waste unnecessarily
Figure 5. Responses for “green energy”
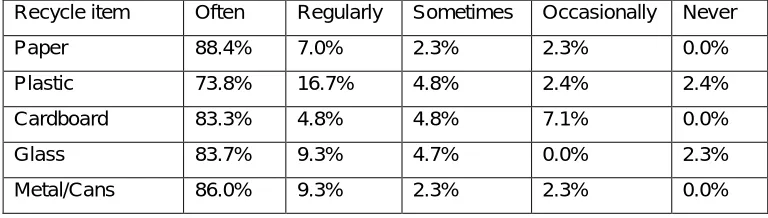
6. Most of the respondents (73.8%-88.4%) are proactive in recycling paper, plastic, cardboard, glass and metal or cans. This is a positive indication that environmental awareness are already deeply seeded in the communities, and there is an opportunity here to cultivate and extend the awareness to include energy consciousness.
Table 3. Frequency of recycling paper, plastic, cardboard, glass and metal/cans. Recycle item Often Regularly Sometimes Occasionally Never
Paper 88.4% 7.0% 2.3% 2.3% 0.0%
Plastic 73.8% 16.7% 4.8% 2.4% 2.4%
Cardboard 83.3% 4.8% 4.8% 7.1% 0.0%
Glass 83.7% 9.3% 4.7% 0.0% 2.3%
Metal/Cans 86.0% 9.3% 2.3% 2.3% 0.0%
7. 72.7% respondents consider individuals are most responsible for environmental protection, followed by the government (61.4%). Respondents are split in their opinion on the role of European Union, to the extent that while 36.4% cite that it has the most important role, 29.5% consider it as not important.
If it were cheaper 39.4%
If it were the same price
48.5%
If it were slightly more expensive
[image:13.595.105.489.420.529.2]Table 4. Responsibility of government, the EU, individuals and companies / organizations in environmental protection.
Whose responsibility?
Most
important Important
Somewhat
important Not important
Government 61.4% 27.3% 11.4% 0.0%
European Union 36.4% 20.5% 13.6% 29.5%
Individuals 72.7% 18.2% 6.8% 2.3%
Companies and Organizations 52.3% 25.0% 18.2% 4.5%
2.2.5 Appliance understanding and usage
1. The chart below shows the breakdown of energy sources for 5 types of appliances; hot water, heating, oven, cooker grill and cooker hob.
Figure 6. Breakdown of energy sources for hot water, heating, oven, cooker grill and cooker hob.
Table 5. Breakdown of energy sources for hot water, heating, oven, cooker grill and cooker hob. Appliance/Energy source Electricity Gas Oil Coal Wood Solar
Hot Water 7 37 0 0 0 0
Heating 5 42 0 1 1 0
Oven 30 13 0 0 0 0
Cooker grill 29 12 0 0 0 0
Cooker hob 12 27 0 0 0 0
Total 83 131 0 1 1 0
16.0%
10.2%
69.8% 70.7%
30.8% 84.0%
85.7%
30.2% 29.3%
69.2% 2.0%
2.0%
Hot Water Heating Oven Cooker grill Cooker hob
2. Hot water and heating, along with cooker hob are mainly powered by gas, while oven and grill are mostly powered by electricity. Only one household use coal and wood each for powering their heating.
3. Out of 216 across 45 households with hot water, heating, oven, cooker grill and hob appliances, 60.6% of these appliances are powered by gas, and 38.4% are powered by electricity.
[image:15.595.78.521.259.671.2]4. When asked which appliances do they think consume the most energy when left running for 20 minutes, their answers are:
Table 6. Breakdown of respondents’ opinions on top three appliances that consume the most energy when operated for 20minutes.
Rank 1 Rank 2 Rank 3
Kettle 9
Washing
machine 11 Washing machine 9
Washer / washing
machine 7 Oven 8 Vacuum 5
Shower / Immersion
heater 7 Kettle 7 dish washer 5
Tumble dryer 5 TV 2 Computer 3
Cooker 5 Iron 2 Tumble dryer 3
Oven 3 Cooker 0 Fridge Freezer 1
Fire 2 Freezer 1 Oven 2
Heating 2 Microwave 1 TV 2
Computer 1 Shower 1 Toaster 1
Dishwasher 1 Lawn mower 1 Lights around home 0
Light 1 Pottery kiln 1 Kettle 0
Microwave 0 Combi boiler 1 Microwave 1
Gas fire 1 induction hob 1
Computer 1 Cooker 1
Electric radiator/oil-filled
radiator 1
Heater 1
Grill 1
TOTAL 43 38 37
5. A total of 480 responses were received on appliances. 355 of these appliances have electricity as energy source. 30 are gas powered. Unsure whether gas/electricity or gas/solar is around 7 appliances. Typical appliances where people are unsure of whether they are sourced from electricity or gas are boiler and oven/hob. Most commonly owned appliances are fridge / freezer, microwave, kettle, computer, washing machine, cooker, stereo, dryer, dishwasher, laptop, heater, vacuum, heating. Only 4 households with solar energy.
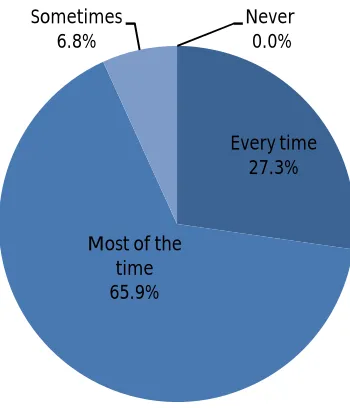
Figure 7. Appliance coverage listed by 40 householders
6. The habit of switching off lights still requires improvement as only 27.3% perform this action every time, while 65.9% say that they do this most of the time.
Figure 8. Frequency of switching off lights Fridge / freezer
9% TV
9%
Laptop / computer 9%
Cooker / oven / hob
8% Boiler / heating
8% Washing machine 7% Microwave 5% Kettle 5% Toaster 4% Phone 4% Dryer 4% Stereo 3% Dishwasher 3% Video/CD/DVD player 2% Lamp / lights
2%
Others 18%
Every time 27.3%
[image:16.595.205.380.502.706.2]7. When asked which appliances are always switched on in their home, the response is as follows:
Table 7. Appliances that are always switched on according to respondents Appliance cited by respondents Number of responses
Fridge / freezer 25
Broadband router 12
Clock 10
Telephones 9
Computer 7
Boiler / central heating 5
Set top box 5
TV 4
Microwave 4
Fish tank heater/filter 3
Alarm sensor 3
Energy monitoring system 2
Oven 2
Lights 2
Air freshener 1
Extension lead 1
Smoke alarm 1
VCR/DVD player 1
Emergency pump 1
Solar panel 1
Kettle 1
The response received from 45 respondents in the survey reveals an important point to consider; Only 27 remembered to include their fridge/freezer, while 3 other claim that they do not have any appliances that are always switched on, although it is safe to say that every household has at least a fridge, a freezer or a combination of both. This goes to show that some appliances are so subconsciously used (set top box, alarms, oven, etc), that people need to be reminded of these appliances’ contribution to a household’s energy consumption.
Figure 9. Appliances used during summer and winter. Bolded appliances are most often used, while coloured appliances indicate which season they are more frequently used.
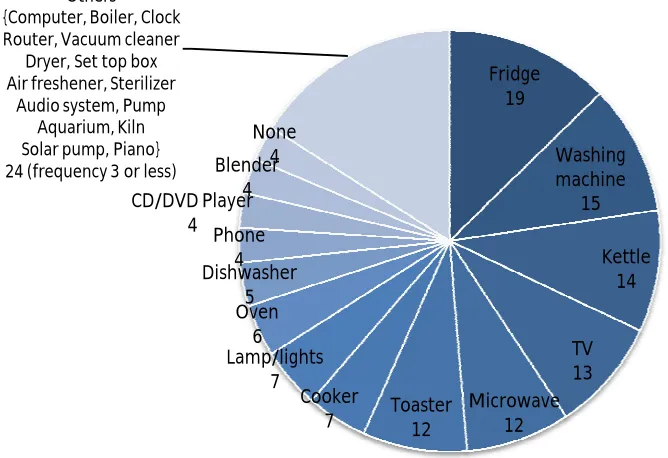
9. As shown in Figure 9, the following lists appliances which are cited by more than 10 respondents as appliances that are always plugged into one socket and not shared by any other appliances:
Fridge
Washing machine Kettle
TV
Microwave Toaster
WINTER SUMMER
Fridge / freezer Washing machine
Radio/stereo Oven Lighting
TV Kettle Cooker Laptop / computer
Router Dishwasher
Phone Energy monitor
Hairdryer Iron Toaster
Fan
Shower Lawn mower Smoothie maker Vacuum cleaner Fountain Oil filled radiator Solar panel Alarm Fish pond Heating timer Air freshener
Central heating
Fire Tumble dryer
Figure 10. Breakdown of appliances cited by respondents as not sharing a socket with any other appliances. Fridge, washing machine, kettle, TV, microwave and toaster are most common.
[image:19.595.116.450.82.311.2]10. The following are the top five appliances in 43 households that get switched off, left on standby, switched on always, and which are not always available to householders.
Table 8. Breakdown on top 5 appliances that get switched off, left on standby, switched on always and which are not always available. Data for 43 households.
Appliance that gets switched
off Frequency
Appliances that is left on
standby Frequency
Appliances that are left switched
on Frequency
Appliances not always
available Frequency Audio (stereo)
system
35
(81.4%) Set top box
14
(32.6%) Router/hub
25 (58.1%)
Video games console
21 (48.8%) Chargers
(battery, mobile phones, etc)
35
(81.4%) Television
10
(23.3%) Microwave
5
(11.6%) Set top box 12 (27.9%) Laptop computer 34 (79.1%) Computer monitor 9
(20.9%) Set top box
2 (4.7%) Computer speakers 11 (25.6%) Television 32 (74.4%)
DVD / Video player
9 (20.9%)
Chargers (battery, mobile phones, etc) 2 (4.7%) Desktop computer 10 (23.3%) Oven 32
(74.4%) Microwave
8
(18.6%) Oven
2 (4.7%)
Computer
monitor 9 (20.9%) Fridge 19 Washing machine 15 Kettle 14 TV 13 Microwave 12 Toaster 12 Cooker 7 Lamp/lights 7 Oven 6 Dishwasher 5 Phone 4 CD/DVD Player 4 Blender 4 None 4 Others
{Computer, Boiler, Clock Router, Vacuum cleaner
Dryer, Set top box Air freshener, Sterilizer
[image:19.595.21.586.484.750.2]2.2.6 Energy saving awareness
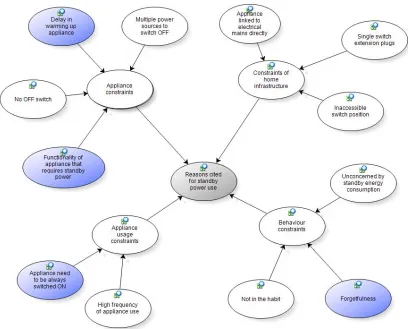
[image:20.595.112.520.286.615.2]1. There are 80 reasons given by 45 respondents on the use of standby power. We simplified these reasons into 4 main categories; appliance constraints, appliance usage constraints, constraints of home infrastructure and behaviour constraints. However, we identify that regardless of the reasons cited by respondents, there are basically 3 root causes for their decisions to use standby power; (1) lack of information, (2) lack of opportunity of switching off the appliance, even though they are aware of the energy consumed by standby power and (3) the need for practicality in leaving the appliance on standby power.
Table 9. Reasons for standby power usage given by respondents.
Reasons cited by respondents Frequency of
occurrence
Identified root cause of human actions
Appliance constraints
No OFF switch 2 Lack opportunity
Delay in warming up appliance 12 (15%)
Lack of information
(causing impatience)
Functionality that requires
standby power 16 (20%) Lack opportunity
Multiple power sources to switch
OFF 2
Lack of information (causing laziness) Appliance usage
constraints
Always need to be always
switched ON 14 (17.5%) Lack opportunity
High frequency of appliance use 8 Practicality Constraints of
home infrastructure
Inaccessible switch position 7 Lack opportunity Single switch extension plugs 1 Lack of information Appliance linked to electrical
mains directly 1 Lack of opportunity
Behaviour constraints
Forgetfulness 11 (13.8%) Lack of information
Not in the habit 4 Lack of information
Unconcerned by standby energy
consumption 2 Lack of information
Lack of information = 32 (40%) Lack of opportunity = 40 (50%) Practicality = 8 (10%)
2. The most frequent excuse (37.5%) for not using standby is due to the requirement that the appliance has to be always on for proper operation (20% cite functionalities such as charging, recording and for preserving operating state of the appliance such as required for clocks, and 17.5% cite the need for the appliance to be always on for connections, such as the Dehems router and ISP routers). The next couple of highest reasons for using standby are the delay in warming up the appliance and forgetfulness.
3. The main root cause for using standby function is that they are limited by appliance functionalities that require them to be switched on 24/7. 50% of the reasons are classified as lack of opportunity, whereas 40% of the causes for the use of standby function are classified as due to lack of information that causes laziness in switching off the appliance, or impatience to do so.
satellite/cable TV box, video games console, audio system, chargers, microwave and oven. The response shows:
Between 75% - 80% say that they shut off their chargers, oven, audio system, and laptop computer.
Between 50% to 75% say that they shut off their desktop computer, computer speakers, computer monitor, printer/scanner/copier, television, DVD player/video recorder, and microwave.
Only less than 50% say that they shut off their router/hub, satellite /cable TV box, and video games console.
The top three appliances that are left on standby are satellite /cable TV box, television, and computer monitor or DVD player/video recorder.
The most frequent appliance that is left on all the time (60.5%) is the router/hub. 5. When asked would they consider paying more for a more energy efficient appliances if they
know they can protect the environment by reducing carbon emission, 39 out of 40 respondents said YES, and 1 said NO.
6. When asked which are the priorities when buying a new appliances, around 39-42 respondents replied the following:
Figure 12. Priority of respondents when buying a new appliance. 52.4% 47.6% 50.0%
44.4%
38.5%
28.2%
42.9% 45.2% 42.5%
43.6% 41.0%
Table 10. Priority of respondents when buying a new appliance.
Criteria /Priority when buying new appliances
Most
important Important
Somewhat important
Not important
Advice from friends and family 16.7% 44.4% 22.2% 16.7%
Availability of the product in stores (online,
shops, catalogues, tv, etc) 10.3% 38.5% 25.6% 25.6%
Brand name 5.1% 28.2% 41.0% 25.6%
Energy rating 52.4% 42.9% 2.4% 2.4%
Price 47.6% 45.2% 7.1% 0.0%
Functionality 50.0% 42.5% 7.5% 0.0%
Appearance (colour, shape, etc) 15.4% 25.6% 41.0% 17.9%
Attractiveness of the advertisement 2.8% 5.6% 11.1% 80.6%
Reviews from other respondents (online
reviews, magazine articles, etc) 17.9% 43.6% 33.3% 5.1%
7. None of the respondents are willing to install an energy monitoring system in their home if the cost exceeds £300. Ideally, the system should cost no more than £50.
Figure 13. Acceptability of the cost of installing an energy monitoring system
8. Figure 14 combines the various energy saving steps that are (1) currently practised and (2) practises that the householders would like to implement in the future. The question provided to the respondents was open ended. There were a total of 131 energy saving steps quoted by the respondents as being currently practised, and a total of 111 as future energy saving steps (most of the steps in the latter category are already quoted as current practises by other householders). We use a mind mapping chart to illustrate that all these steps can be
£0-£50 69.2% £51-£100
25.6% £101-£200
2.6%
[image:23.595.216.401.405.593.2]simplified into 8 main categories. The gray coloured energy saving steps are not currently practised by any of the householders; instead, they are quoted as future steps only.
Figure 14. The various energy saving steps quoted by 45 householders, classified into 8 main categories. Most of the future steps quoted by householders are already implemented as current practises in other households. Gray coloured steps are not currently implemented by any of the householders. Dotted line shows that energy efficient appliance use is closely related to switching off appliances.
9. Although recycling is one of the points given by only a few householders that has only a small number of occurrences, this does not mean that only a few of them recycle. As shown in Table 3, 73.8%-88.4% of the respondents recycle proactively. The reason for such low frequency for recycling as in this case could simply be attributed to the fact that people tend to overlook recycling as an energy saving step. Instead, as the results shown here indicates, people tend to think of appliances and household improvement as more common energy saving steps, while recycling tend to be thought useful for environmental protection .
10. The main reason given by householders on why they have not implemented the future energy saving steps that they quoted is cost factor, especially in ensuring home improvement and replacing appliances with more energy efficient appliances.
Figure 15. Breakdown of the number of respondents who apply the 8 categories of energy saving steps.
Figure 16. Breakdown on the number of respondents who would like to apply the 8 categories of energy saving steps in the future.
Switch off appliance, 32.1% (42) Replace appliances with energy efficient appliances , 26.7%
(35) Home improvement, 15.3 % (20) Reduce dependancy on
appliances / technology, 9.9% (13) Energy efficient appliance use, 9.2% (12) Recycle, 3.8% (5) Monitor energy
usage, 2.3% (3) Advice others to be energy conscious, 0.8% (1) Switch off appliance, 24.3% (27) Replace appliances with energy efficient
appliances , 24.3% (27) Reduce dependancy
on appliances / technology, 15.3% (17) Home improvement, 15.3% (17) Energy efficient appliance use, 12.6%
(14) Recycle, 3.6% (4) Monitor energy usage, 2.7% (3)
Advice others to be energy conscious, 1.8%
2.2.7 Online privacy
1. 67.4% say that they tend to be careful on what information they release online. 17.3% are ultra worried about their online privacy to the extent that they worry about being observed or do not use online shopping even. 15.2 % have no issues with online privacy.
2.3 DEHEMS User Analysis
The DEHEMS User Analysis is a purely qualitative method of obtaining views and perspectives of the focus group participants on the implementation of the Cycle 1 DEHEMS system in their homes and the various issues they may have faced. The analysis is also to obtain methods to improve the system design and user interface. Through exploratory research using NVivo, the results are arranged according to the following categories.
Perception of users on DEHEMS Benefits of DEHEMS
Usability issues of Cycle 1 DEHEMS system Suggestions to improve Cycle 1 DEHEMS system Review of the Cycle 2 DEHEMS website wireframes
The focus group sessions themselves also managed to provide the following benefits to the participants.
Those who have not used the DEHEMS website are now motivated to look at the website more
Most indicated enthusiasm and motivation to discuss energy consumption with others even after the session
Participants discussed various energy saving techniques and learnt from each other how to be more efficient
2.3.1 Perception of users on DEHEMS
[image:27.595.89.516.136.436.2]When asked to describe their thoughts on DEHEMS with as few words as possible, most of the responses are quite positive and encouraging. Figure 17 summarizes the common perceptions.
2.3.2 Benefits of DEHEMS
[image:28.595.86.545.158.465.2]Participants of the focus groups are positive on the DEHEMS system. They find the system beneficial from various angles, as shown in the NVivo model below, which is a comprehensive analysis of the four focus groups.
Figure 18. NVivo model on the benefits of the DEHEMS system
2.3.3 Usability issues of the Cycle 1 DEHEMS System
One of the most beneficial results of the Cycle 1 focus group analysis is the usability issues revealed during the four sessions. These issues are an important feedback to improving the use cases, requirements, user interface, and system deployment of the Cycle 2 DEHEMS system.
Figure 19 presents the NVivo model of the various issues and topics regarding the usability of the DEHEMS system highlighted during the focus group sessions.
[image:29.595.85.565.175.692.2]2.3.4 Suggestions to improve DEHEMS system
[image:30.595.78.558.173.682.2]There are a number of suggestions focused towards improving the Cycle 1 DEHEMS system. These are illustrated in the figure below.
2.3.5 Review of Cycle 2 DEHEMS Website Wireframes
[image:31.595.76.513.211.685.2]Partipants were provided with the wireframes of the Cycle 2 DEHEMS website. There were some encouraging remarks, especially on the new graphics and the elements of target setting. An important revelation was on the site for inquiring on purchasing new appliances; most were not too enthusiastic in being provided with suggestions on which make and model of appliance would suit them best, as they perceive that the current Internet sites are sufficiently adequate.
2.4 DEHEMS Energy Data Analysis
This section briefly analyzes the energy (electricity) sensor data collected during the months of March to July 2009. Cycle 1 is meant mostly for testing the system to ensure that it performs as it should and for gathering baseline energy information. Therefore, the analysis provided in this section will not have sufficient depth due to the nature of Cycle 1 objectives and data collection methods.
Figure 22. Average daily energy usage for March – July 2009 for up to 35 households in the three cities.
[image:33.595.91.517.72.355.2]2. Next, we compare the energy usage in Manchester, Birmingham, Bristol and other locations (London, Coventry, etc). Table 11 and Figure 23 present this information, along with the indoor temperature data collected from the Current Cost equipment that has integrated temperature sensor. For the purpose of providing further context to the analysis, we also provide England’s average outdoor temperature for each month, obtained from the UK Met Office [5] which provides the national weather service in the UK.
Table 11. Average daily energy usage (kWh) for March – July 2009 along with average indoor and outdoor temperatures (outdoor temperature obtained from the UK Met Office for England)
Month Manchester Birmingham Bristol Other
Average indoor temperature (Celcius) Average outdoor temperature (Celcius)
March 9.27 11.61 10.58 18.83 6.80
April 9.06 12.36 10.14 10.34 19.76 9.60
May 10.73 12.44 7.62 14.35 20.39 11.90
June 9.95 11.47 6.72 13.43 21.91 14.50
July 11.74 11.60 7.96 13.79 21.68 16.10
0 5 10 15 20 25 30 35 40 45
1 3 5 7 9 11 13 15 17 19 21 23 25 27 29 31 33 35
Av g . D a il y U s a g e (kw h )
Number of houses across Manchester, Birmingham and Bristol
March
April
May
June
[image:33.595.85.528.544.661.2]Figure 23. Average daily energy usage (kWh) for March – July 2009 across three cities along with average indoor and outdoor temperatures
3. The figure above shows that the city of Birmingham as having the higher average daily energy consumption while the city of Bristol as having significantly lower daily average during the months of May to July. The reasons for this are yet unclear, and further analysis is required, especially from the Living Lab partners. It is also interesting to see that even though outdoor temperatures vary substantially from March to July (6.8oC to 16.1oC), indoor temperatures do not have a steep gradient of change, where they remain around 18.8oC to 21.7oC. This range of indoor temperature indicates the comfort zone, where regardless of the outdoor temperature, households tend to maintain their indoor temperatures at this level. This is useful information to be fed back into semantics reasoning work done in WP3, and for other related work in this project.
0.00 5.00 10.00 15.00 20.00 25.00 0.00 2.00 4.00 6.00 8.00 10.00 12.00 14.00 16.00
March April May June July
Av g Mo n th ly T e m p e ra tu re (C e lci u s ) Av g . D a il y En e rg y U s a g e (kW h ) Month Manchester Birmingham Bristol Other
[image:34.595.76.522.72.391.2]3
Discussion and Conclusions
To conclude our analysis, we revisit the Research Questions presented in Section 1, and attempt to provide an indication of the answers that will follow in the future work of this project.
To what extent can the DEHEMS system contribute to users' changing their behaviour resulting in reduced energy consumption? (To what extent can we demonstrate the DEHEMS effect on the user.)
The focus group analysis reveals that the DEHEMS system has contributed to behaviour change. Some of these behaviour changes include the following energy saving steps that have been taken by the participants since using the DEHEMS system:
Reduced temperature of washing machine to 30 degrees Celcius Boiled less water in kettle
Switched off lights when leaving the room Used less lighting
Washed clothes less Stopped using dishwasher Reduced TV usage Changed light fittings
Switched off TV instead of using standby power Removed plugs from sockets
Stopped using hot water for everything Replaced kettle with quick cups or gas hob Purchased toaster to reduce using the grill Replaced big freezer with a smaller one Reduced electric fire usage
Shared information with friends and family
Switched off radio that used to be on in all of the rooms. Now it’s just switched on in one room.
All of these steps are listed in Figure 14. This is expected because the questionnaire were completed after Cycle 1 deployment, and thus we expect that many of the steps listed in Figure 14 are also results of using the DEHEMS system.
The fact that some households have replaced their appliances and reduced dependency on certain appliances like the dishwasher, washing machine, etc. indicate that these are not only ecological behaviour changes, but in fact be more interestingly, a paradigm shift towards energy consciousness in their daily lives.
What are the key motivations for people in the living labs to change their behaviour towards energy conservation?
In what ways can motivations be changed to move more towards environmentally motivated behaviours? (E.g. shift from cost consciousness towards CO2 emission awareness as the key motivator, playing games, compete...)
Our findings show that participants of the three Living Labs are well motivated in implementing ecological behaviours. This is seen in Table 3 which underlines that a high 73.8%-88.4% are proactive recyclers and in Table 4 which highlights that 72.7% of the respondents consider individuals hold the biggest responsibility in environmental protection.
Since there is already awareness on environmental issues, and understanding of the relationship between energy consumption and greenhouse effects / global warming issues, there is an opportunity here to further cultivate ecological behaviours towards energy, thus shifting (perhaps slightly) the focus from financial concerns. As shown in the DEHEMS user analysis (focus group), participants highlight competitiveness as an interesting idea in the system. They are keen to explore how their household performs within and across Living Labs. They are also interested in energy related projects and endeavours carried out in different countries (particularly in the EU, including Bulgaria). Additionally, they also request interesting (and surprising) facts regarding energy usage in the DEHEMS website so that they can use these facts to convince others to be energy conscious. Therefore, a number of steps towards answering this research question can be taken, and will be implemented in Cycle 2: (1) provide convincing household comparisons (baseline realistic criteria for comparisons, the meaning of “similar” households, etc) and (2) provide information on energy related environmental topics and green energy projects undertaken in other parts of the country and the EU.
What are the factors that affect engagement over a longer period of time and allow to maintain it? Are there barriers? (e.g. does the system fit in with other projects locally, the wider context anywhere)
To provide longer period of engagement and maintenance of behaviour change, we need to foster internalization of behaviour, where after developing new energy conscious behaviours, users are encouraged to change their attitudes to suit that new behaviour. This can be done if users are equipped with an enlightening knowledge on the impact of their appliances’ use on energy consumption of their household, and henceforth the impact of their household’s energy consumption on the environment.
Figure 24. Breakdown of opinions on the top three most energy consuming appliances surveyed by Mansouri-Azhar et al.[4]
It is expected that by providing feedback on appliance level energy consumption, behaviour change will be observed in Cycle 2. Already there is a shift towards long term behaviour change, as demonstrated by the various energy saving steps taken by participants of the focus group that have used the DEHEMS system to explore the various appliances in their homes (switching on and off appliances and observing the impact on their overall energy consumption). Some of them have even replaced their freezer!
However, as pointed out during the focus group analysis (Figure 19 and 20), an attractive, engaging and stimulating user interface is key in maintaining interest in the DEHEMS system, as well as in promoting long term behaviour change. There is a driven effort in Cycle 2 to achieve some aspects of this subject matter, which will yield a pronounced difference in the DEHEMS web interface. A more innovative display unit might also be considered for Cycle 3, but the achievement of such an interface depends on the time and resource constraints of the project.
What are the key factors that affect acceptability of the DEHEMS system to the end users? (E.g. user's perception that they are wasting more energy by installing multiple DEHEMS devices, user friendly and intuitive interfaces, cost of the DEHEMS system, complexity of the system, etc)
This question has been addressed in the qualitative analysis of the focus group transcripts, as illustrated in Figure 19 on the usability issues of the Cycle 1 DEHEMS system. This is an on-going work, as each Cycle will reveal different aspects of usability issues, as the system progresses. Another critical angle of acceptability of the DEHEMS system is the cost factor. As illustrated in Figure 13, none of the respondents are willing to install an energy monitoring system that costs beyond £300. Almost 70% of them are willing to install the system if it is below £50, while only around 25% are interested if the cost lies within £50 to £100. Hence, keeping the cost as low as possible is a critical constraint for the DEHEMS project.
How important is it to measure other forms of energy consumptions besides electricity? Such as gas, coal, wood, oil (esp in Romania and Bulgaria).
Social networking - how important is it for users and what forms are there, how feasible is it to get people to participate? What about offline tools?
The use of internet is pervasive among the Living Lab participants. However interest in social networking tools are split; 44.2% say that they use it at least once a week, while 37.2% say that they never use it. Nevertheless, to ignore social networking tools would not be the right step forward as it is an important platform for information sharing and getting others involved. Those who do use it have the potential to reach out to a vast number of people. It is also a constantly growing phenomenon, and is quickly becoming the norm for the younger generation (who might have provided a majority support for social networking usage if they had been the ones surveyed). The most frequently used social networking tool is either MySpace / Facebook / Friendster / Blogs or Instant Messaging tool such as Skype/MSN etc. Regardless of whether a person is active in using online social networking tools, there is a high number of them who are proactive members of their own local community, from knowing most of their neighbours’ names, chatting with them frequently, and looking out for each other. Only 2.2% do not socialize in their own local community. Therefore, there is a positive indication on the potential of the DEHEMS system to act both as a platform for providing feedback on energy usage and as a platform for information sharing and propagating ecological behaviours. This has also been pointed out in the focus group analysis as one of the major benefits of the DEHEMS.
Acknowledgements
We appreciate the contributions of Mr. Niraj Thurairajah from the Research Institute for Built and Human Environment, University of Salford for his advice and guidance on the subject of social science research methodology.
4
References
1. F.G. Kaiser, S. Wolfing and U. Fuhrer, Environmental attitude and ecological behaviour. Journal of Environmental Psychology 19 (1999), pp. 1–19.
2. J. Collis and R. Hussey. Business Research: A Practical guide for undergraduate and postgraduate students, 2nd Ed. Palgrave Macmillan, New York, 2003.
3. M. Easterby-Smith and R. Thorpe and A. Lowe. Management Research: An Introduction. 2nd Ed., Sage publications, London, 2003.
4. Mansouri-Azar, M. Newborough and D. Probert, Energy-consumption in UK domestic households: impact of domestic electrical appliances. Applied Energy vol. 54 no. 3, pp. 211– 285, 1996.