Identification the Potential Causes of Stopline in
Electrolytic Tinning Line Using Multi
Attribute Failure Mode Analysis
R. Ekawati
*, N. Wahyuni, R. Annisa
Department of Industrial Engineering, University of Sultan Ageng Tirtayasa, Cilegon, Indonesia
Copyright©2019 by authors, all rights reserved. Authors agree that this article remains permanently open access under the terms of the Creative Commons Attribution License 4.0 International License
Abstract
PT. XYZ often suffers stopline in its production process of producing tin plate type coil in Electrolytic Tinning Line (ETL) machine which is used nonstop. The purpose of this research is identifying cause of stopline and determining the most potential cause ofstopline using Multi Attribute Failure Mode Analysis (MAFMA). MAFMA itself is a combination method between FMEA and AHP. The result shows the causes of
stopline are damaged bearing, broken shaft, not fitted construction, damaged rubber lining in sidewall, many tin particles in roll, torn roll, groove roll and bubble roll. The most potential cause is damaged bearing by weight of 0.172.
Keywords
MAFMA, AHP, Stopline1. Introduction
Quality of product which meets standardize specification is an important thing that must be fulfilled by a company. If the company is not able to meet customer’s satisfaction, then its customers may switch to another company. One of the obstacles that should be faced in
production process is downtime. PT XYZ is the first and largest company in Indonesia which produces tin plate. Electrolytic Tinning Line (ETL) is a primary machine in this company. Throughout 2015, PT XYZ often meets
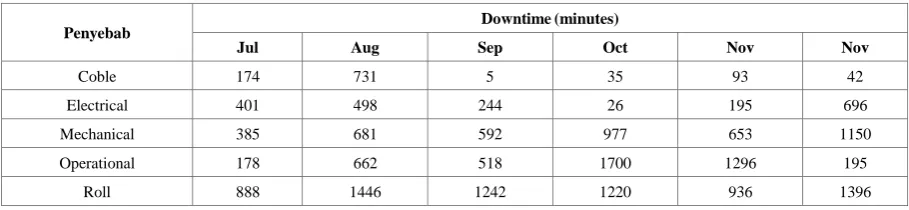
stopline in producing tin plate type coil in ETL. ETL is used nonstop so that if the machine is not operating, it will have an impact on two machines at the next station, Shearing Line (SHL) and Scroll Line (SCL). Here is the downtime historical data since July 2015 – December 2015:
Based on downtime historical data on Table 1, the cause of stopline with the greatest frequency is roll. Roll greatly affects the production process because the roll is a tool used to help the tin plate move from one process to the next process, so that if there is one roll not functioning properly, then the coil production process is interrupted. If there is no improvement to this cause of stopline, not only it is wasting time, production target is not reached and the company losses profit, but also the company should spend extra money to fix up this cause of stopline.
The purpose of this study is identifying the causes of
[image:1.595.70.525.623.728.2]stopline caused roll and determining the most potential cause of stopline. Assumption which is used is human factor is ignored because of machine automation and experienced operator.
Table 1. Downtime historical data
Penyebab Downtime (minutes)
Jul Aug Sep Oct Nov Nov
Coble 174 731 5 35 93 42
Electrical 401 498 244 26 195 696
Mechanical 385 681 592 977 653 1150
Operational 178 662 518 1700 1296 195
Analytic Hierarchy Process (AHP) is used to solve multi-criteria decision making issues. AHP is based on the innate human ability to use information and experience on pairwise comparison [1]. The use of AHP in this issue is often criticized because it is less able to cope with uncertainty faced by decision makers when giving an exact value in the pairwise comparison matrix. Therefore, to cover AHP then developed between AHP and fuzzy approach [2]. Fuzzy AHP method is first proposed by a researcher named Chang and a direct extension of AHP consisting of matrix elements which are represented by fuzzy numbers.
The differences between AHP method and fuzzy AHP are implementation of pairwise comparison’s weight in comparison matrix. In the fuzzy AHP method, weight of pairwise comparison is represented by three variables (l, m, u) which are called Triangular Fuzzy Numbers (TFN). TFN approach in AHP method is used to minimize uncertainty in AHP scales. TFN is used by fuzzification on a scale of AHP in order to obtain a new scale called fuzzy AHP scale. Here is the following membership functions fuzzy numbers:
Figure 1. Membership Function Fuzzy Numbers [3]
Failure Mode and Effect Analysis (FMEA) is a method used to identify potential failure that might cause any malfunction and to make sure the effect of failure associated with any failure. The reason why we need to use FMEA, it is better to prevent failure than handle failure, increase the chances of detecting the occurrence of a failure, identify the cause of the greatest failures and eliminate them, reduce the chance of failure, and the improve quality of products and processes.
Multi Attribute Failure Mode Analysis (MAFMA) is a method developed by Marcello Braglia whose develops FMEA method. In finding the most significant cause to be controlled, FMEA considers only from three criteria’s: severity, occurrence, and detectability. However there is one main factor that is no less important called expected cost. MAFMA itself is a combination method between FMEA and AHP [4].
MAFMA has already been used in previous studies include a study carried out by Hetharia, D. (2009); Badruzaman, N. (2012) Begashaw & Tafesse, (2017) and
Singh & Issac, 2018. MAFMA method is used to determine the cause of potential failures in order to improve the quality of cable products in PT Sutrakabel Intimandiri [5]. MAFMA method is used to identify the cause of failure slag on billet products [6][8]. This paper is talking about MAFMA method which is used to determine the most potential cause of stopline in Electrolytic Tinning Line in PT XYZ.
2. Methodology
Data is collected in four stages include:
1. Identification of early failure and cause of failure. Performed by conducting interviews with workers who are directly related to the production process to list the number of potential stopline and its cause. 2. Create fish bone diagram and Cause Failure Mode
Effect (CFME).
It is used to see the root cause of stopline in production process by conducting interview.
3. It is used to see the root cause of stopline in production process by conducting interview.
4. Carry on pairwise comparison among alternative based on expected cost criteria.
Conducted by interviewed to know the estimation of cost by cost that should be done by the company to compensate for defective products caused stopline in the production process. After doing a pairwise comparison, then making a hierarchical structure that is used in data processing.
Here are the steps of Fuzzy AHP method in calculating the value of consistency ratio pair wise comparison matrix: 1. Calculate eigen vector using the formula:
Where m is the row in pairwise comparison matrix. 2. Calculate the priority weight by dividing eigen vector
with total eigen vectors.
3. Multiply pairwise comparison matrix with weighted priorities.
4. Find λmaksvalue using the formula:
maks
a
n
∑
λ
=
Where a is a total of vector sum, whereas n is the number of elements.
5. Calculate consistency index (CI) using the formula:
maks
h
n
Cl
n 1
−
=
[image:2.595.67.282.356.486.2]6. Calculate consistency ratio (CR) by dividing CI with Random Index (RI) appropriate to number of paired. If CR ≤ 10%, then pairwise comparison is consistent. Here are the steps of Fuzzy AHP method using Chang model according to [2]:
1) Calculation the value of synthesis
Defining value of fuzzy synthetic extent for i-object such as the following equation:
i i
m j n m j 1
i j i g i 1 j 1 g
S
= ∑
=M
× ∑ ∑
[
= =M ]
−To obtain
i
m j
j 1=
M
g∑
then sum the value of m infuzzy pairwise comparison matrix such as the following equation:
i
m j m j m m j
j i=
M
g(
l
j 1=m
ju
j 1=)
∑
= ∑
∑
∑
To obtain ni 1 mj 1 ji g
[
∑ ∑
= =M ]
then sum ij g
M
such as the following equation:
i
n m j n n n
i 1 j 1 g i 1 i i 1 i i 1 i
[
∑ ∑
= =M ]
= ∑
(
=l
∑
=m
∑
=u )
To obtain the inverse of i 1n mj 1 ji g
[
∑ ∑
= =M ]
formula, it can be obtained by using TFN arithmetic operation on the following equation:
i
n m j 1
i 1 j 1 g n n n
i 1 i i 1 i i 1 i
1
1
1
[
M ]
(
,
,
)
u
m
l
− = = = = =
∑ ∑
=
∑
∑
∑
2) DeffuzzificationDefuzzification is used to convert each result which is translated fuzzy number to real number. Defuzzication is
used for each criteria such as the following equation [2]:
i i i i
i
(u
l )
(m
l )
D
l
3
−
+
−
=
+
Which u: upper value in TFN
m: median value in TFN l: lower value in TFN 3) Normalization value of defuzzification
Value of defuzification will be normalized by dividing the value of defuzzification with total value of defuzzification. Its result is weight of the problem faced such as following equation:
n i 1
D
W
D
==
∑
3. Results
There are several methods of Total Quality Management (TQM) which are used to eliminate potential failure. Multi Attribute Failure Mode Analysis (MAFMA) method is one of methods of TQM which improves from Failure Mode and Effect Analysis (FMEA) method. MAFMA method integrates conventional aspects in FMEA with expected cost aspect, so that the cause of failure can be seen the effects toward cost.
In identifying the cause of stopline, this paper uses pareto diagram to know what the causes of stopline are, which dominate throughout 2015. ccording to pareto diagram, it shows that roll is the cause of stopline dominating in 2015. To know potentions and causes of stopline because of roll, the researchers conduct an interview and brainstorming using fishbone diagram and Cause Effect and Failure Analysis (CFMA). Then each of causes is weighted based on severity, occurrence and detectability criteria. Here is weighting result using Failure Mode and Effect Analysis (FMEA):
Table 2. Failure mode and effect analysis
Stopline Potention Effect S Causes D Detection O RPN
Pressure roll malfuntion Passed solution 8 Damaged bearing 6 Grease periodically 5 240
Broken sink roll Not rotating roll
8 Broken shaft 4 Do crack test 4 128 7 Not fitted construction 4 Check construction 4 112
7 Damaged rubber lining in
sidewall 4 Do leak test on rubber 4 112
Dent on tin plate Defect
7 Many tin particles in roll 4 Control pressure roll 4 112
7 Torn roll 4 Increase the quality of
rubber roll 4 112
Creases on tin plate Defect 7 Groove roll 4 Make arrangements of
The causes in Table 2 are taken as alternatives. There are: Damaged bearing (Cause A), Broken shaft (Cause B), Not fitted construction (Cause C), Damaged rubber lining in sidewall (Cause D), Many tin particles in roll (Cause E), Torn roll (Cause F), Groove roll (Cause G), and Bubble roll (Cause H). So that the hierarchy Structure can be seen on the picture below as Figure 2:
Figure 2. Hierarchy Structure of MAFMA
In weighting on pairwise comparison among all criteria uses three respondents. CR value of first respondent is 0,053; CR value of second respondent is 0,080; and CR value of third respondent is 0,080. The results from each respondent have Consistency Ratio (CR) below 10%, so that results of pairwise comparison are consistent. Then those results are done fuzzification into Triangular Fuzzy Numbers (TFN). Here is fuzzification of three respondents:
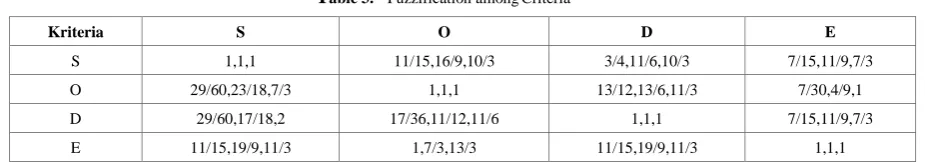
Table 3. Fuzzification among Criteria
Kriteria S O D E
S 1,1,1 11/15,16/9,10/3 3/4,11/6,10/3 7/15,11/9,7/3 O 29/60,23/18,7/3 1,1,1 13/12,13/6,11/3 7/30,4/9,1 D 29/60,17/18,2 17/36,11/12,11/6 1,1,1 7/15,11/9,7/3 E 11/15,19/9,11/3 1,7/3,13/3 11/15,19/9,11/3 1,1,1
That result of fuzzification is calculated value of synthetic extent then, defuzzification, and normalizing the value of defuzzification. From the value of defuzzification, it can be known that the weight of severity is 0,260; the weight of occurrence is 0,224; the weight of detectability is 0,193; and the weight of expected cost is 0,324.
In weighting on pairwise comparison among all alternatives based on expected cost criteria uses three respondents. CR value of the first respondent is 0,068; CR value of the second respondent is 0,064; and CR value of the third respondent is 0,076. The results from each respondent have Consistency Ratio (CR) below 10%, so that results of pairwise comparison are consistent. Then those results are done fuzzification into Triangular Fuzzy Numbers (TFN)
[image:4.595.66.529.378.459.2]Table 4. Weighting of alternatives result based on severity, occurrence, and detectability
Cause of Stopline Severity Occurrence Detectability Score Weight Score Weight Score Weight
Cause A 8 0.1379 5 0.1515 6 0.1765
Cause B 8 0.1379 4 0.1212 4 0.1176
Cause C 7 0.1207 4 0.1212 4 0.1176
Cause D 7 0.1207 4 0.1212 4 0.1176
Cause E 7 0.1207 4 0.1212 4 0.1176
Cause F 7 0.1207 4 0.1212 4 0.1176
Cause G 7 0.1207 4 0.1212 4 0.1176
Cause H 7 0.1207 4 0.1212 4 0.1176
From weighting of alternatives result based on severity, occurrence, and detectability, then it can be calculated the weight of each alternatives based on severity, occurrence, detectability, and expected cost criteria. Here is the result of weighting alternatives:
Table 5. Result of weighting alternatives
Criteria Weighted
Criteria Cause A Cause B Cause C Cause D Cause E Cause F Cause G Cause H Severity 0.260 0.036 0.036 0.031 0.031 0.031 0.031 0.031 0.031 Occurrence 0.224 0.034 0.027 0.027 0.027 0.027 0.027 0.027 0.027 Detectability 0.193 0.034 0.023 0.023 0.023 0.023 0.023 0.023 0.023 Exp. Cost 0.3901 0.068 0.038 0.050 0.023 0.029 0.015 0.054 0.047 Total 0.172 0.124 0.131 0.104 0.110 0.097 0.135 0.128
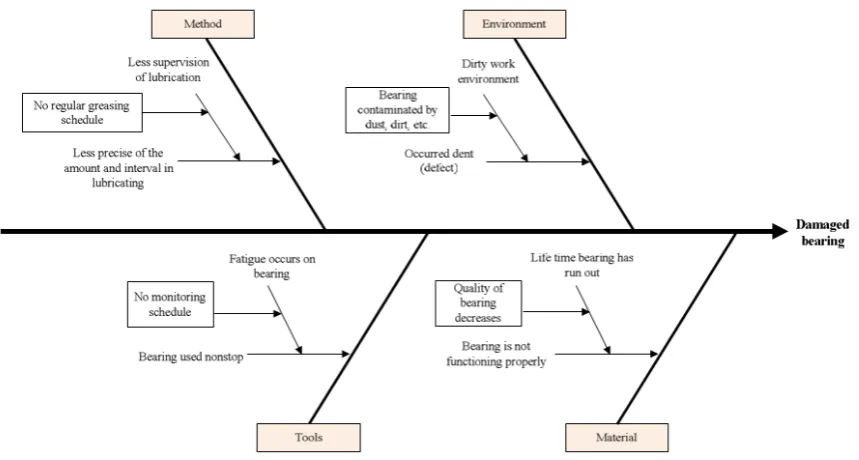
[image:5.595.67.531.103.253.2]Based on result of weighting alternatives based on severity, occurrence, detectability, and expected cost criteria, it can be concluded that damaged bearing (cause A) is the most potential cause of stopline in producing tin plate type coil in highest weight, 0,172. Cause A is determined as the most potential cause of stopline because it represents the highest score among four criteria than the other causes. There is no standard to determine the most potential cause because it depends on how many causes that caused the stopline. Here is the cause and effect diagram of damaged bearing:
[image:5.595.86.516.481.711.2]4. Discussion
Based on Table 5, the most potential of stopline is damage of bearing. Then we analyze what is the root cause of the damage of bearing. Using fishbone diagram, it shows that the causes are: bearing contaminated by dust, there are no periodic greasing schedule, decrease the quality of bearings, there are no periodic monitoring of bearing.
To handle contaminated dust bearing, it is necessary to check the bearings regularly every shift so that the production environment is always clean. To handle no periodic greasing schedule, it is necessary to make greasing schedule once in a week, where greasing lubrication schedule conducted according to standards that have been set. To handle the decrease of bearing’s quality, it is necessary to make the periodic monitoring of quality of bearing to make sure condition of bearing is worth to use in production. To handle no periodic monitoring of bearing, it is necessary to make monitoring schedule once in a week.
5. Conclusions
The conclusion of this research is the causes of stopline
in production process are Damaged bearing (Cause A), Broken shaft (Cause B), Not fitted construction (Cause C), Damaged rubber lining in sidewall (Cause D), Many tin particles in roll (Cause E), Torn roll (Cause F), Groove roll (Cause G), and Bubble roll (Cause H) [7].
However the most potential cause of stopline in producing tin plate type coil based on severity, occurrence, detection, and expected cost is damaged bearing in weight 0,172.
REFERENCES
[1] Saaty, T.L. The Analytic Hierarchy Process Vol. 6. New York: McGraw-Hill. 1994.
[2] Y. Anshori, “Pendekatan Triangular Fuzzy Number dalam Metode Analytic Hierarchy Process”, Jurnal Ilmiah Foristek, 2012.
[3] G. Kabir, M. Hasin, “Comparative Analysis of AHP and Fuzzy AHP Models for Multi Criteria Inventory Classification”, International Journal of Fuzzy Logic System (IJFLS), Vol. 1, No. 1, pp. 1-16, 2011.
[4] M. Braglia, “MAFMA: Multi Atribute Failure Mode Analysis”, International Journal of Quality and Reliability Management, Vol 17, No. 9, pp. 1017-1033, 2000.
[5] Hetharia, D. Penerapan Fuzzy Analytic Hierarchy Process Dalam Metode Multi Attribute Failure Mode Analysis Untuk Mengidentifikasi Penyebab Kegagalan Potensial Pada Proses Produksi. Jurnal Teknik Industri Universitas Trisakti: Vol. IV, No. 2, pp. 106 – 113. 2009.
[6] Badruzaman, N. 2015. Identifikasi Penyebab Kegagalan Slag Pada Produk Billet Dengan Metode Multi Attribute Failure Mode Analysis (MAFMA) Di PT XYZ. Cilegon: Universitas Sultan Ageng Tirtayasa.
[7] Jabarullah, N. H., Verrelli, E., Gee, A., Mauldin, C., Navarro, L. A., Golden, J. H., & Kemp, N. T. (2016). Large dopant dependence of the current limiting properties of intrinsic conducting polymer surge protection devices. RSC Advances, 6(89), 85710-85717.
[8] Yao, T. K., Fouché, O., Kouadio, K. E., & Oga, M. S. (2017). Discontinuous Nature of Phreatic Aquifers in Granitic Rocks at Watershed Scale: A Stratiform Model from Perennial Streams and Well Data. Asian Review of Environmental and Earth Sciences, 4(1), 20-27.
[9] Singh, A. K., & Issac, J. (2018). Impact of Climatic and Non-climatic Factors on Sustainable Livelihood Security in Gujarat State of India: A Statistical Exploration. Agriculture and Food Sciences Research, 5(1), 30-46.
![Figure 1. Membership Function Fuzzy Numbers [3]](https://thumb-us.123doks.com/thumbv2/123dok_us/8752972.892316/2.595.67.282.356.486/figure-membership-function-fuzzy-numbers.webp)