Determinants
of the Growth in the Social Security
Administration
‘s Disability Programs-An
Overview
by Kalman Rupp and David Stapleton*
This article examines factors affecting the growth in the Social Security Administration’s disability programs. We synthesize recent empirical evi-dence on factors affecting trends in applications and awards for Disability Insurance and Supplemental Security Income (SSI) benefits and duration on the rolls. Econometric analyses of pooled time-series, cross-sectional data for States provide strong evidence of business cycle effects on applications and, to a lesser extent, on awards. Substantial effects of cutbacks in State general assistance programs are also found, especially for SSI. Estimated effects of the aging of the baby boomers, growth in the share of women who are disability insured, the AIDS epidemic, and changes in family structure are also presented. Indirect evidence suggests the importance of program- matic factors, especially for awards, and especially in the mental and muscu- loskeletal impairment categories. The decline in the average age of new awardees has substantially increased duration, particularly for SSI. As a result, caseload growth would be expected’to continue even in the absence of future award growth.
*The authors are, respectively, from the Office of Research and Statistics, Social Security Administration, and Lewin-VHI, Incorporated.
Acknowledgments: An earlier version of this article was presented at the Allied Social Science Associations’ meetings on January 8, 1995, in Washington, DC, in a session on disability caseload growth organized by the Society of Government Economists. The authors wish to thank Gilbert Fisher, Richard Foster, Michael Leonesio, L. Scott Muller, Wendell Primus, Steven Sandell, Lawrence Thompson, Peggy Trout, and Peter Wheeler for their helpful comments. We are also grateful for analytic support, suggestions, or data provided by a large number of individuals, especially Burt Bamow, John Bound, Richard Burkhauser, Kevin Coleman, Kim-berly Dietrich, Eli Donkar, Jeffrey Furman, Gina Livermore, Gilbert Lo, Charles Scott, Alan Shafer, and Melinda Upp. This article solely reflects the opinions and interpretations of the authors, and does not necessarily represent the official posi-tions of SSA or Lewin-VHI, Inc.
The Federal Government provides cash benefits for persons with severe disabilities through two Social Security Administra- tion (SSA) programs-the Social Security Disability Insurance (DI) program under Title II of the Social Security Act, and the Supplemental Security Income (SSI) pro- gram under Title XVI. Both programs use the same defmition of disability, but other eligibility criteria differ. In particular, DI is a social insurance program with dis- abled-worker eligibility based on prior Social Security covered employment. Prior work experience is not required un-der SSI, but the program is means tested,
using income and asset eligibility criteria.
Some persons may be eligible under both programs and receive DI and SSI benefits concurrently. DI benefits stop when a DI beneficiary reaches age 65 and he or she is transferred to the Old-Age and Survivors Insurance program (OASI). SSI disability recipients may continue to receive benefits past age 65, if they continue to meet the income and asset tests. Children with qualifying disabilities are eligible for SSI payments on their own right subject to income and eligibility requirements.
About 20 years ago a series of econo- metric studies, primarily using aggregate time series techniques (Land0 1974; Hambor 1975; Thompson and Van de Water 1975), were conducted, focusing on the effects of the business cycle on the growth of the DI program. This height- ened interest coincided with a peak in the number of new awards in 1975 (chart 1). SSA actuaries continued to monitor the growth of the DI program on an ongoing basis, focusing on demographic and legis- lative changes that shape program growth. Academic interest in the DI and SSI pro- grams waned during the late 1970’s and early 1980’s, as applications and awards started to decline, but the recent growth in both programs refocused attention on them. The upsurge was particularly no-table in the number of children on the SSI
disability rolls.
A better understanding of the factors affecting program growth is necessary to improve our ability to make predictions about future growth both in the short and long run. The number of applications has a direct effect on SSA’s administrative costs and ability to process applications in
a timely fashion, while the number of new awards and length of stay determine caseload growth and program cost. SSA prepared a report (Department of Health
and Human Services (DHHS) 1992)
summarizing existing knowledge about the growth of the Dl program and provid- ing a comprehensive list of various de-mographic, economic, and programmatic factors hypothesized to affect caseload growth. After receiving the 1992 report, the Board of Trustees of the Federal OASI and DI Trust Funds recommended that SSA initiate a research effort to es- tablish whether the growth represents a temporary phenomenon or a longer-term trend. In response to this recommenda- tion, and in cooperation with the Office of the Assistant Secretary for Planning and Evaluation at DHHS, SSA initiated a
Chart 1 .-DI and SSI disability awards,
(In thousands)
700
600
series of research projects conducted through a combination of m-house analy-ses and several contracts with Lewin-VHI, focusing on application and award growth to produce an assessment of the reasons for disability program growth.
This additional research was needed to assess the causal role of various factors and to quantify their effects. In particu- lar, it was important to assess whether various factors are primarily responsible for short term temporary or cyclical changes in caseload growth or for perma- nent changes. To improve future projec-tions, it is also important to identify fac-tors unaccounted for or improperly included in previous models. Improved knowledge about caseload growth might also facilitate useful policy interventions related to particular factors, the identifi-
1974-93
cation of programmatic options to control future growth, and the improvement of the incentives associated with disability programs. This article summarizes what we currently know about the factors
affecting caseload growth. Our summary
is primarily based on the results of quan- titative analyses of factors affecting ap-plications, awards, and duration on the rolls, but we also rely on the results of other relevant studies.’
Overall Conceptual Framework
Caseload growth is affected by both economic and noneconomic factors. Factors such as the value of potential cash benefits relative to wages, the value of complementary or substitute program benefits, and business conditions are
1974 1975 1976 1977 1978 1979 1980 1981 1982 1983 1984 1985 1986 1987 1988 1989 1990 1991 1992 1993
years
clearly in the domain of economics. Demographic and epidemiological fac-tors, as well as the criteria for determin- ing disability status and their implemen- tation are, at least in a proximate sense, noneconomic factors that might affect caseload growth, often substantially. The economic perspective, emphasizing the role of opportunity costs-individuals making choices comparing various alter-natives-is particularly useful in under- standing how economic and noneco- nomic forces interact in shaping
decisions such as applying for and being awarded disability benefits, as well as decisions concerning leaving the disabil- ity rolls.
From the economic perspective, pro-gram participation is an outcome of the interaction of the “demand” for program benefits by individuals and the “supply” of program benefits by the Government. On the demand side, the number of appli- cations (representing the demand for awards) in part depends on:
l the relative advantages of working and not working;
l the availability of substitute forms of public assistance (such as Aid to Families with Dependent Children (AFDC) and general assistance (GA));
l complementary benefits provided to those receiving disability benefits-especially health insurance benefits (Medicare for DI beneficiaries and Medicaid for SSI recipients); and
l various features of the DI and SSI programs-that is, the costs of apply- ing for benefits, the probability of receiving an award, and how long benefits are expected to continue. Once persons with disabilities begin receiving DI and/or SSI benefits, their continued “demand” for benefits is influ- enced by:
l the length of time already on the rolls-over time, a beneficiary’s po-tential earnings decline as continued separation from the labor force erodes working skills;
l programmatic disincentives to
work-with limited exceptions, DI
and SSI beneficiaries who engage in
“substantial gainful activity” (that is, those earning over $500 per month)
subsequent to a 9-month trial work period lose all their disability
ben-efits;2
l changes in their health and disability status; and
l changes in the labor market. “Supply” side factors affecting appli-cation for disability benefits include legislative factors, as well as administra- tive procedures, judicial rulings, and the
resources available for making award decisions. The “supply” side for those on the rolls is affected by:
l the number of “Continuing Disability
Reviews” (CDRstto determine if
current beneficiaries still meet the disability standard (with benefit termi- nation for those who do not); the num- ber of CDRs conducted depends both on the availability of administrative resources and the “political will” to conduct these often unpopular re-views;
l changes in rules concerning the effects of work on program eligibility and benefits, especially for the SSI pro- gram; and
l the availability of vocational rehabili-tation programs and incentives and requirements to use them.
While factors affecting initial awards and length of stay can be seen as sequen- tial, changes at the “back end” of the process have potential feedback effects as well. For example, anticipated reconsid-eration and administrative law judge (ALJ) decisions may affect initial eligi-bility determination decisions by the State Disability Determination Services (DDS), as well as applicant decisions to ask for the reconsideration of unfavor- able decisions and to exercise their ap- peal rights. The perceived “strictness” of the disability determination process might also affect applications. In addi- tion, perceptions about SSA’s tennina-tion and suspension policies might affect work activities, and therefore continued eligibility, among beneficiaries.
Although the economic perspective
focuses on choices made by individuals given their available opportunities, it must also be recognized that third parties often have a significant interest in this choice and may actively try to influence it. An important example is State and local governments who have an interest in shifting the costs of welfare and health expenditures to the Federal Government. Other interested third parties include employers, health care providers, and private insurers.
In the next section, we focus on fac- tors affecting applications and awards. In the section following it, we address the factors affecting length of stay, suspen- sions and terminations, as well as the effect of length of stay on caseloads. In the final section, we briefly discuss im-plications and directions for future re-search.
Applications and Awards
This section provides an overview of the factors affecting applications and awards. Applications have a major effect on SSA’s administrative costs, while the number and characteristics of new awardees fundamentally shapes future program cost. First, we discuss popula-tion factors and trends affecting the target populations of the DI and SSI programs.
Subsequently, we address the business cycle and economic restructuring, the availability and value of other benefits, and programmatic factors affecting appli-cations and awards.
Methodology
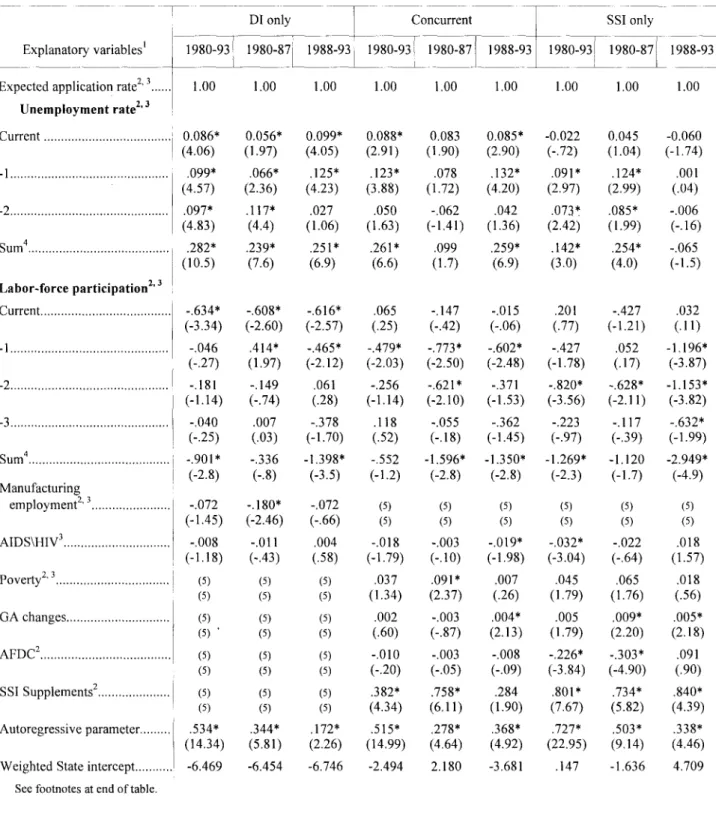
Much of the following discussion is based on the findings from a State-level econometric analysis of applications and awards for the 1988-92 period and from a followup analysis for 1980-93. The dependent variable of interest in these analyses is the volume of applications and awards at the State level; the inde- pendent variables were designed to cap- ture relevant factors affecting these State- level aggregates.
For the first of the econometric analy-ses, SSA prepared tabulations of applica- tions and awards at the State level for the
1988-92 period from its new Disability Research File (DRF), aggregated by
l l
program, sex, age, and impairment cat-egory. These data became the core of our 1988-92 database, to which we added data for various State-level explanatory variables for the same period (Stapleton, Coleman, and Dietrich 1995). For the followup analysis, we used previously existing State-level tabulations of initial (medical) determinations and initial el-lowance rates, disaggregated by program only, along with explanatory variable data for the 1980-93 period (Stapleton and Dietrich 1995).
For both analyses, we applied a meth- odology to the analysis of application and award growth that had not been previ- ously used for that purpose+ne that “pools” time-series data for a cross sec-tion of individual States. The methodol- ogy provides estimates of the effects of various factors on applications and awards that are based on the relationship across States between changes in the factors and changes in applications and awards.’ An important advantage of this approach is that it controls for changes in national factors, such as disability pro-gram rules and policy, to the extent that they have a common influence on appli- cations and awards in all States, as well as for permanent differences across States. Conversely, an important limita-tion of the methodology is that it cannot be used to estimate the effects of factors for which changes did not vary across States during this period, or that are not accurately measured at the State level. Therefore, we supplement this economet-ric analysis with actuarial analyses and other pieces of evidence.
For the 1988-92 analysis, we esti-mated 40 application and 40 award equa-tions for each program. The dependent variable in each equation is the logarithm of either an application or incidence rate for a specific age/sex/impairment group (five age categories, two sex categories, and four impairment categories-mental disorders, musculoskeletal disorders, infectious diseases, and all others). The independent variables in each equation refer to a single State-level measure, and do not reflect disaggregated information specific to a given age/sex/impairment group. Below is an overview of the inde-
pendent variables used and their hypoth- esized effects:
l The State unemployment rate is uti- lized to represent the business cycle. We hypothesize that increases in the rate of unemployment have positive effects on the volume of applications and awards, while decreases have negative effects.
l The GA program cuts variable is a proxy for the effects of State budget- ary pressures on the generosity of State-funded substitute programs (especially for SSI). We hypothesize that State cutbacks in State funded substitute programs positively affect disability applications and awards. Conversely, increased generosity and access to State funded substitute pro-grams is expected to have a negative effect on disability applications and awards. Specifically, we hypothesize that cutbacks and the elimination of GA programs in selected States in- creased disability program growth, and that this effect is stronger for the means-tested SSI program than for the DI program.
l An AIDS/HIV incidence variable
accounts for the effects of the AIDS epidemic on the incidence and preva- lence of disability. We hypothesize that the increasing incidence of AIDS/ HIV has a positive effect on disability applications and awards.
l A variable measuring the number of immigrants granted legal alien status under the Immigration Reform and Control Act (IRCA) to represent the effects of the law. Unlike most other immigrants, those granted legal alien status under IRCA were immediately eligible for SSI. We hypothesize that the number of immigrants granted legal alien status positively affects the volume of SSI applications and awards.
l The percentage of children living in one-parent families as a proxy for the effects of the proportion of households headed by single parents on applica- tions and awards (particularly for SSI). We hypothesize that the propor-
tion of households headed by single parents positively affects SSI applica- tions and awards.
l A dummy variable for each year to control for national factors.
The operational definitions and sources of each of the variables used in these analyses are detailed in Lewin-VHI (1995a). For DI, we also estimated sepa-rate equations for those who applied for just DI (DI-only) and for those who had applied for SSI and DI concurrently.4 Individuals who apply for both programs are of special interest for two important reasons. First, they are the fastest grow-ing group. Second, as will be discussed in more detail later, the majority of those who receive SSI awards are relatively short stayers on the SSI rolls because they can no longer pass the SSI means test once their 5-month waiting period for DI benefits expires and they begin re-ceiving such benefits.
For the 1980-93 analysis, we esti-mated a single initial determination and allowance rate equation for each of three program groups: D&only, SSI-only, and
concurrent5 The SSI-only data includes
child initial determinations, which is problematic because of the exceptionally large growth in child applications from 1990 on. The dependent variable in each equation is the logarithm of either initial determinations per capita or the initial allowance rate (initial allowances divided by initial determinations). The explana- tory variables that follow include those from the 1988-92 analysis that were available for the full period, plus several others that represent overall State-level values:
l The expected application rate variable is based on 1990 national application rates by age group and the age distri- bution of the State’s population in the current year-to capture the effect of the aging of the population. This variable is equal to a weighted average of age-specific national application rates for 1990, with the weight for each age group equal to the share of the State’s working-age population in the age category. We hypothesize that the expected application rate variable
Social Security Bulletin Vol. 58, No. 4 Winter 1995 l l 46
positively affects initial determina- tions and allowances.
* The labor-force participation rate variable captures the negative, cyclical effect of discouraged workers leaving the labor force during recessions. We hypothesize that declines in labor-
force participation are positively asso-ciated with initial determinations and awards. However, for DI, the labor-
force participation rate variable may also capture the long-term positive effect of growth in the share of women who are disability insured.
l The share of employment in manufac- turing variable is a proxy for the effect of economic restructuring. In the short run we anticipate a positive relationship between changes in the share of manufacturing employment and initial determinations and allow- ances as a result of job losses associ-ated with decreases in manufacturing employment. However, in the longer term an opposite effect can be hypoth- esized reflecting the long-term shift to service sector jobs that tend to be associated with a lower incidence of work disabilities.
l The incidence rate of the disabling work injuries variable captures changes in the nature of work. We hypothesize a positive effect on initial determinations and allowances.
l The poverty rate variable captures changes in poverty that are not picked up by other variables in the model. We hypothesize a positive relationship between the poverty rate and SSI initial determinations and allowances.
* The mean AFDC payment for a two-
person household relative to mean earnings captures the relative attrac-tiveness of AFDC benefits. We hy- pothesize a negative effect on SSI initial determinations and allowances.
l The mean SSI payment including
State supplement payments, relative to mean earnings, captures the relative value of SSI benefits. We hypothesize that the relative value of SSI payments positively affects initial determina-tions and allowances.
When feasible, we adjusted the ex- planatory variables for changes in the age distribution of the population. For a more detailed discussion, see Stapleton and Dietrich (1995).
For the 1988-92 analysis we related current-year changes in explanatory variables to current changes in applica- tion and incidence rates. For the 1980-93 analysis, we also examined the effect of prior year (“lagged”) changes in the explanatory variables on current year initial determinations and allowance rates and found substantial impacts for two variables: the unemployment rate and the labor-force participation rate. A technical description of the econometric methodology appears in the appendix, along with selected regression and simu- lation results.
In order to better design, interpret, and validate the econometric analysis, we conducted a substantial review of rel- evant literature, interviewed a series of government and academic experts on disability, and conducted case studies of application and award growth in five States. The States selected for the case studies include the four largest States-California, Florida, New York, and
Texas-and Michigan-a State that ter-
minated its genera1 assistance program in 1991. We visited each State, during which we interviewed officials in SSA field offices, State Disability Determina-tion Services, State and local welfare agencies, and other agencies. Following the site visits, we analyzed program growth in each State using the economet- ric models. In addition, survey data for Michigan GA recipients that had been matched to SSI administrative records were analyzed (Bound, Kossoudji, and
Ricart-Moes 1 99Q6
The next sections summarize the evi- dence concerning the effects of popula- tion factors, the business cycle, eco-nomic restructuring, other support programs, and features of the disability programs themselves.
Population Factors
In the sections that follow we will examine the areas of population growth and target populations.
Population growth.-Changes in the
size and age/gender composition of the population provide the simplest and most direct explanation of changes in the num- ber of DI and SSI applications and awards. The size of the working-age “SSA area” population grew steadily from 1975 to 1992, and is expected to continue growing steadily in the near future. (The “SSA area” population refers to residents of the 50 States and the District of Columbia adjusted for net census undercount; civilian residents of Puerto Rico, the Virgin Islands, Guam, and American Samoa; Federal civilian employees and persons in the Armed Forces abroad and their dependents; crew members of merchant vessels, and all other U.S. citizens abroad.)
The baby boom generation, born be- tween 1946 and 1964, was still entering
the working-age population in 1975. As
it did, the average age of the working-age population declined, but this decline was eventually reversed as the generation aged. Both the growth in the size of the
working-age population and the aging of
the baby boom generation have contrib- uted to recent growth in applications and awards for SSA’s disability programs.
The SSA area population between ages 15 and 64 grew at an average annual rate of 1.1 percent from 1975 to 1992, but the growth in recent years has been much slower than in earlier years. From 1975 to 1980 the average annual growth rate was 1.5 percent, while it was only 0.6 percent from 1988 to 1992. During the later period, however, changes in the
age distribution of the working-age
popu-lation substantially offset the effect of the slowing of population growth. There is a strong positive association between age and the incidence of disabling conditions. The entry of the baby boom generation initially resulted in a decline in the aver- age age of the SSA area population, but with the aging of the baby boom genera- tion this decline has reversed. Conse- quently, changes in the age distribution had a strong negative effect on applica- tion and award rates during the early part of the 1975-92 period, thereby moderat- ing the effect of the increasing size of the SSA area population, but, for the 1988- 92 period, aging of the population added
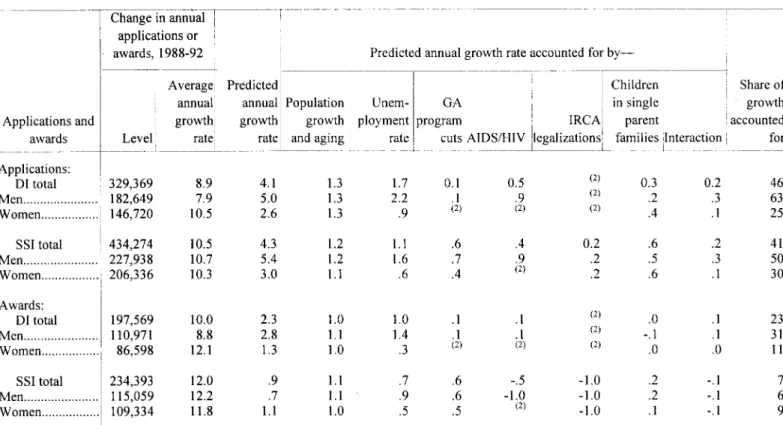
to the effect of population growth. Based on 1988 age-specific application rates and population growth by age from 1988 to 1992, we estimate7 that population growth and aging together account for average annual DI application growth of 1.3 percentage points and SSI applica- tion growth of 1.2 percentage points8-both more than twice the average annual
growth rate of the working-age
popula-tion. Results for awards are almost identical.
Population growth during the 1975-92 period did not explain increased SSI applications and awards for children. Actually, from 1975 to 1988 the number of persons 18 years and younger declined by 2.1 percent. While the number of children increased by 4.8 percent from
1988 to 1992 (an annual growth rate of 1.2 percent), this growth is dwarfed by the explosion of SSI applications and awards among children for this period of time.
Target populations.-The number of
DI and SSI applications and awards should be influenced by changes in the size of the population eligible for either or both programs, that is, each program’s target population. The most important eligibility factors are the presence of qualifying disabilities and economic eligibility. The disability criteria are identical for the two programs; economic eligibility is tied to disability-insured status for DI and to a means test for SSI. All three of these criteria are influenced by factors external to the DI and SSI programs, as well as by legislative, ad-ministrative, and judicial factors. Our focus here is on exogenous changes in the size of the target populations.
To be eligible for DI, a person has to satisfy the insured status and disability requirements. SSI eligibility requires meeting the means test and the disability requirement. Persons with qualifying disabilities who are disability insured but do not meet the means test are eligible for DI only; those who are disability insured and meet the SSI means test qualify for both programs (concurrent eligibility); and those who meet the SSI means test but are not disability insured are eligible for SSI only.
Unfortunately, based on currently
available data we cannot observe time series on the three main target popula- tions directly, and indeed, not even cross-sectional data are available in which the population satisfying the disability crite-ria in the general population is identi- fied.’ Therefore, we must rely on an item by item examination of evidence on trends in these three target populations.
The share of the DI-insured popula-tion grew at an average annual rate of 1.2 percent from 1975 to 1992. The rate of growth was much higher for women (2.6 percent) than for men (0.2 percent), re-flecting the increase of female labor- force participation rates (chart 2). The narrowing of gender differences also suggests that this source of increased growth is approaching exhaustion.
Actuarial analysis of the contribution of changes in the size and the age/gender composition of the disability insured population to the growth of DI applica- tions from 1988 to 1992 found an aver- age annual contribution of 2.1 percentage
points-O.8 percentage points greater
than the estimated impact of population
growth and aging alone-with almost all
of the added contribution due to changes in the disability insured status of women
(Lewin-VHI 1995a). Results for awards
were almost identical. Importantly, the growth in the proportion of the disability insured population suggests an increase in the share of SSI eligibles concurrently qualifying for DI, thereby depressing the growth of the SSI-only group, particu- larly for women.
To proxy for trends in the population that is economically eligible for SSI, we examined changes in the poverty popula-tion for working-age adults and children between 1975 and 1992. During the late
1960’s and early 1970’s, Nobel Laureate James Tobin and Robert Lampman opti-mistically predicted the elimination of
poverty by 1980. However, between
1975 and 1992 the size of the working- age poverty population after government transfers increased from 11.5 million to 18.3 million, increasing the working-age poverty rate to 9.4 percent for males and
13.9 percent for females.
Pre-transfer poverty is of more rel-evance for assessing the impact of pov- erty on SSI eligibility, but consistent
measures are not available before 1979. From 1979 to 1992, the pretransfer pov-erty rate for the working-age population grew at an average annual rate of 1.6 percent. Growth was highest for persons aged 18-24 and in the subperiods 1979-83 and 1989-92 (chart 3) both periods of slow economic growth or even de- cline; in the latter period, the average annual growth rate of the pre-transfer poverty rate was 3.5 percent. Assuming that increases in the poverty rate directly translate into increases in SSI applica- tions on top of the effects of population growth and aging, these factors combined account for 4.7 percentage points of the average annual growth in SSI applica- tions over this period, or about 45 percent of the average annual growth of 10.5 percent.
The pre-transfer poverty rate for chil- dren also grew substantially during the 1979-92 period, and, as with the adult rate, growth was greatest in the first and last few years of the period. For the 1988-92 period, the child poverty rate grew at an average annual rate of 2.9 percent. While this growth is substantial, it can account for only a very small frac- tion of the 44 percent average annual growth in child SSI applications over the period.
Although trends in poverty are par- ticularly important proximate determi-nants of SSI growth, these trends may reflect a variety of underlying reasons affecting the size of the financially eli-gible population that are of interest in their own right. Ideally, we would like to know how various factors that are behind the growth in poverty--changes in the economy and in family structure-affect program participation. It should also be kept in mind that poverty rates may be imperfectly correlated with the percent- age of the population that satisfies the SSI means test.
We included the poverty rate as an explanatory variable in our Dl-concurrent and SSI regressions for 1988-92, but found that it did not have a statistically significant effect on applications and awards. A similar finding was obtained in the 1980-93 analysis of initial determi- nations. Although marginally significant, positive coefficients were obtained when
Social Security Bulletin Vol. 58, No. 4 Winter 1995l l 48
data for the 198047 subperiod alone were used. The weak findings might be
attributable to substantial measurement
errorsin State-level poverty rate esti- mates. Another explanation is that a major determinant of the poverty rate,
unemployment, is included separately in
all of the analyses, so only variations in the poverty rate that are not explained by
the unemployment rate (or other explana- tory variables) are being used to identify
the impact of poverty. In addition, the inclusion of the percent of children living with only one parent as an explanatory variable in the 1988-92 analysis may also be an effective control for another impor-
tant determinant of poverty-growth in
the number of female-headed house- holds. Future work on the relationship
between poverty, SSI means-testing, and
disability applications and awards could be further enhanced on the basis of the rich source of information provided by SSA’s matched SIPP data files.
The findings with respect to the per- cent of children living with only one parent merit further discussion. We included this variable in the regressions as a proxy for changes in family struc- ture-declines in marriage rates that have left many individuals with no source of support other than their own earnings. This variable accounts for a significant amount of SSI application growth as well as DI-concurrent application growth-on the order of 5.0 percent of annual growth over the 1988-92 period. Effects were somewhat larger for women than for men, were larger for younger age groups than for older age groups, and were con-
Chart 2.-Percent of the working age population that is disability insured, 1975-92
Percent 90 60 70 60 50 40 i 1 -c Men
centrated in the mental disorders cat- egory. A negative association between severe mental illness and marriage has been documented in the mental health literature; individuals who are mentally ill are less likely to marry than others, and are more likely to get divorced if they do marry (Bartel and Taubman 1986). Our findings are consistent with the notion that declines in the availability of economic, physical, and emotional support from a spouse may be contribut- ing to growth in applications and awards.
The data available to study the preva- lence of disabling health conditions is limited, especially for analyzing trends. Long-term trends in the prevalence of disabling conditions may be influencing long-term growth in applications and awards (in some cases negatively), but
under40 --% Women under 40
‘+ 40-64 --t 40-64
Total a-.- Total
-__
30
1975 1976 1977 1978 1979 1980 1981 1982 1983 1984 1985 1986 1987 1988 1989 1990 1991 1992
Year
with one exception (AIDS/HIV), we did not fmd convincing evidence of health trends explaining the recent acceleration of application and award growth. As will be discussed later, however, expansion of the population with qualifying disabilities due to legislative and regulatory changes and increased awareness of disabling conditions might have substantially con-tributed to application and award growth.
The incidence of AIDS/HIV grew at
an annual rate of 9.3 percent from 1988 to 1992. Our regression estimates for
1988-92, along with counts of the num- ber of applications in the AIDS/HIV impairment category, suggest that AIDS/ HIV accounts for between 0.6 and 0.9 percentage points of both DI and SSI application growth over this period.
SSI applications from legal aliens and those living in the United States under the color of law grew much more rapidly than those from citizens-at an average annual rate of 17.4 percent from 1988 to 1992, versus 9.8 percent for citizens- although the share of all applications from the former group is still small (6.8
Chart 3.-Percent of persons in poverty before transfer payments, by age, 1979-92 Percent 30 25 2c 15 IO 5 I-~~ O-17 - 18-24 -+‘- 25-44 + 45-64 Cl 1979 1980 1981 1982 1983 1984 1985 1986 1987 1988 1989 1990 1991 1992 Year
percent in 1992). We previously have hypothesized that the Immigration Re-form and Control Act (IRCA) explained the relatively rapid growth among appli- cations from this population. National time series data of IRCA legalizations show a striking resemblance to national time series data for SSI applications from
legal aliens (Lewin-VHI 1994). Because
IRCA legalizations are concentrated in a relatively few States, we expected that any impact of IRCA legalizations would be clearly distinguished in the application and award analysis for 1988-92. In fact, however, the findings were very weak. To verify the econometric findings, the number of annual SSI awards to IRCA immigrants in a lo-percent sample of all SSI applications was tabulated for the period from 1989 (the first year of IRCA legalizations) to 1994. The number iden-tified as IRCA immigrants turned out to
be very small-peaking at an estimated
3,200 of the 88,500 applications from all legal aliens in 1993. Thus, the rapid growth in legal alien applications over this period appears to be partly due to the
same factors that are behind the growth in applications from citizens. Thus, IRCA is apparently not responsible for the relatively rapid growth of applica- tions from noncitizens. In the analysis of the 1980-93 data we examined whether growth in the number of legalized immi-grants who have satisfied the 3-year waiting period could explain this phe- nomenon, but again found no significant results. Evidence from the case studies suggests that the recession had a much larger impact on the immigrant popula-tion than on citizens, but we have not tested the hypothesis empirically. It is also known that middleman fraud has played a role in helping immigrants in some areas obtain awards, but the extent of the fraud is unknown.1°
An important feature of our findings concerning population factors is that they explain why growth in concurrent appli-cations has been greater than growth in applications and awards for either pro- gram alone, and especially why concur-rent application and award growth has greatly exceeded that in the DI-only category. Female and young DI appli- cants are more likely to meet the SSI means test than are older male DI appli- cants, and growth in the disability insured population has been greatest for women and for the young to middle age groups. The effects of poverty and changes in family structure have roughly equal im- pacts on concurrent and SSI-only appli-cations and awards, but at most have small impacts on DI-only applications and awards. Finally, the effect of AIDS/ HIV on concurrent applications and awards has been substantially greater than its effects on those in either the DI- only or SSI-only categories.
Our analysis suggests that the in- creased size of both the disability insured and the poverty populations contributed to the growth of DI and SSI applications. Because of the substantial increase in the size of the poverty population and the dramatically increasing proportion of women who are DI-insured, the increase
in the size of the target population satis-fying both DI and SSI criteria appears to have grown most rapidly, explaining the preeminence of this group in both appli-
cation and award growth.
l l
Social Security Bulletin Vol. 58, No. 4 Winter 1995
Business Cycles
There have been numerous previous econometric studies estimating the effect ofthe business cycle on DI applications, awards, and caseloads. Most of the pre- vious studies used aggregate time-series methods, although some work has been conducted using State or individual level cross-sectional data (chart 4). The point estimates vary across individual studies, but no study has found substantial effects in a direction opposite from the predic- tions of economic theory. Previous stud-ies have suffered from various specifica-tion problems or low statistical power, or both.
One of the key results from our work using annual pooled cross-sectionitime- series data for States relates to our esti-mates of business cycle effects, because our ability to control for permanent dif-ferences among the States and to elimi- nate the confounding effect of national changes endemic to time-series studies makes the results obtained from our
analysis methodologically much stronger
and more credible. Strong results were found in both the 1988-92 analysis of applications and awards and the 1980-93 analysis of initial determinations and initial allowance rates (chart 4). In gen- eral, we found stronger effects for appli- cations than awards, and for the DI pro-gram than for SSI. In the 1980-93 analysis of initial determinations we found that the impact of a change in unemployment begins in the year of the change, but is greatest 2 years after the change. Such “lagged” effects are pre- sumably greater for initial determinations than for applications because of the sub- stantial lag between filing and the initial determination, but nonetheless they could be very significant. We did not examine this issue in the 1988-92 application analysis.
We were able to extend our DI initial determination analysis back to 1976, and found remarkably stable unemployment effects for DI in each of three sub-
periods-1976-79. 1980-87, and 1988-
93. We also found that unemployment effects for SSI-only initial determinations were essentially as large as for DI-only and concurrent initial determinations in
the 1980-87 period, but we did not find an unemployment effect for SSI-only initial determinations in the 1988-93 period. The latter finding may be related to the fact that the SSI-only data include children.
In the initial determination analysis we also found evidence of a discouraged- worker effect; holding the unemployment rate constant, a decline in labor-force participation as individuals give up their search for work during a recession is associated with a significant increase in initial determinations.
The findings from the five case studies add credibility to the econometric find-ings about business cycles, suggesting, if anything, that they are conservative. It is clear from the case studies that subtleties of business cycles not captured by the unemployment rate are relevant to a recession’s impact-the industrial distri-bution ofjob losses, the perceived perma-nence of layoffs, and key characteristics of workers who lose their jobs, such as age, gender, prior earnings, and skills. We believe that the econometric esti-mates of the effect of the unemployment rate do not fully account for the effects of the business cycle. First, because of errors in the measurement of the unem- ployment rate variable, the estimates tend to understate the effects of the unemploy- ment rate. Second, because the unem- ployment rate does not fully capture important aspects of the business cycle that are expected to affect applications
(for example, discouraged-worker
ef-fects), we believe that our estimates tend to provide a conservative assessment of the proportion of the application and award growth attributable to business cycle effects. The case study evidence supports this interpretation.
The business cycle findings suggest a need to search for improved program-matic responses to the business cycle. Current program incentives make it highly likely that marginally qualified applicants drawn into the program by the business cycle will provide a long-term burden for the disability rolls even if business conditions Improve and the severity of the person’s disabling condition(s) does not worsen.
We know relatively little about the
mechanisms through which business
cycles affect program growth. We
can-not determine, for instance, the extent to which our results reflect the effects of State and local fiscal responses to reces- sions rather than applications by workers with serious disabilities who lose their jobs or whose spouses lose their jobs.
The smaller estimated business cycle effects for SSI-only applications and awards-in comparison to the DI find- ings-is consistent with the hypothesis that much of the DI effect is due to job losses by workers with disabilities. Find-ings from the case studies support this interpretation as well, but they also pro- vide evidence of an important role for State and local fiscal responses to rev- enue losses, a subject we will return to later.
The dynamic aspects of business cycle impacts are also poorly understood. The considerable lagged effects found in the initial determination analysis suggest that many individuals who are induced to apply during a recession only do so after an extensive search for other sources of support.
Economic Restructuring
Many have hypothesized that eco-
nomic restructuring-the replacement of
high paying manufacturing jobs with relatively low paying service sector jobs-has had an impact on application
and award growth. The short-term effect
of economic restructuring is thought to increase applications, because disabled workers who lose their manufacturing jobs may choose to apply for disability
benefits rather than find new work in the service sector. The long-term effect may be to decrease applications, however, because service sector workers are less susceptible to disabling injuries and ill- nesses (see Loprest, Rupp, and Sandell
1995). The long-term effect may vary by impairment group; for instance, some have suggested that the effect is negative for physical impairments but positive for mental impairments.
We previously speculated that the large business cycle effects found in the 1988-92 application analysis may partly reflect the short-term, positive impact of
l l
Chart 4.-Estimates of the effect of a 1 -percentage point increase in the unemployment rate on disability program
growth for adults
Estimated effect of a 1- percentage
Studv Data tvne I Period ooint increase in unemnlovnicnt
Applications
(Hambor. 1975) Quarterly, national 1964-71 7% for DI
(Lando, 1974) Quarterly. national 1962-73 2 - 4% for Dl
(Lando. Coate, and Krauss, Quarterly. national 1964-78 2 - 7% for Dl
19791 I
.’ “/
(Halpern, 1979) Quarterly, national 1964-78 Negligible for Dl
(Muller, 1982) Annual, individual. cross-section 1972 Negligible for Dl
(Levy and Krute, 1983) Annual, individual, cross-section 1978 Ncgli&ible for Dl
f Hambor. 1992) Annual. national 1970-91 Negligible for DI
4% for DI-only.
(Stapleton. Coleman. and Annual. pooled, cross- 4% for DI-concurrent.
Dietrich, 1995) scctionitime-series 1988-92 2% for SSI
Initial determinations
(Stapleton and Dietrich, Annual, pooled cross- 1980-93 2% in year of change.
1995) sectionitimc-series 3% after I year.
(SSI-only includes children) 5% after 2 years
2% in year of change. 4% after 1 year. 5% after 2 years 0% in year of change 1% after I year 3% after 2 years Awards
(Hambor, 1975) I Ouarterlv. national I 1964-71 1 2 - 4% for Dl
(Lando, 1979) Annual, State-level cross-section 1975 ! 5 - 6% for DI
(Muller. 1982) 1 Annual. individual. cross-section 1 1972 1 Negligible for DI
\- ~~~~~ I I I
(Levy and Krute. 1983) Annual. individual. cross-section 1978 ! Negligible for DI
(Hambor, 1992) Annual. national 1 1970-91 1 Negligible
I 3% for DI-onlv. i
(Stapleton, Coleman, and Annual, pooled, cross-section/ 2% for DI-concurrent.
Deitrich 1995) I time-series 1988-92 I 2% for SSI
I
-Initial allowance rate
(Stapleton and Dietrich, Annual. pooled cross- 1980-93 Dl- 0 points in year 01
1995) section/time-series only change,
(SSI-only includes children) -1 point after 1 y’ear,
-1 noint after 2 vears
Con- 0 points year of change.
cur- -1 point after I year.
rent -2.points after 2 years
SSI- 0 points year of change.
only -I point after I year,
-2 Points after 2 y’ears
Beneficiaries
1
(Thompson and Van de
Water. 1975) Quarterly. national 1963-74 1% for Dl
I I I
(Cromwell ct al.. 1986) Quarterly, poo~le~i$!$tte-lcvcl cross- Ncgligiblc for SSI Medicaid
1975-83 enrollees
economic restructuring (Lewin-VHI 1995b). In the 1980-93 initial determina- tion analysis we tried to capture this effect using the percent of employment in manufacturing as an additional explana-tory variable. We did find the expected negative effect for the DI-only category, but it was small and not replicated for other program categories. We also devel- oped two indices of job-related injuries and illnesses to capture the longer-term impact of economic restructuring, but found no significant results. Although it may be that measurement and other specification errors account for the weak findings, this is also consistent with the hypothesis that business cycle effects overwhelm the effects of economic restructuring in the periods we have examined.
Oiher Support Programs
Just as economic theory suggests that the relative value of disability cash ben-
efits to potential earnings affects the decision to apply, it is reasonable to ex- pect that the availability and relative value of benefits through other programs should also affect the decision to apply. This is an important topic, particularly in light of substantial secular changes in the relative value of public benefits such as
general assistance (GA-the generic term
for welfare programs funded entirely by State and local governments), Aid to Families with Dependent Children
(AFDC-a State/Federal program that
primarily provides support for low in-come, single-parent households), Medic-aid, and Medicare.
Other programs can be classified as either “substitutes” or “complements” for DI and/or SSI, in the economic sense of these terms. Substitute programs are those for which an expansion in the value of benefits reduces applications and awards for the SSA programs; benefit expansion for complementary programs increases applications and awards. AFDC is a clear example of a substitute program for SSI. Individuals cannot receive benefits from both programs, and if eligible for both AFDC and SSI, must choose which benefits to receive. In-creases in the relative value of AFDC benefits are expected to decrease the
relative attractiveness of SSI, while de-creases in the relative value of AFDC benefits should have the opposite effect. Medicaid and Medicare are clearly complements of SSI and DI, respectively; most SSI recipients are automatically eligible for Medicaid, while DI beneficia- ries receive Medicare coverage after a 2- year waiting period. Increases in the cash value of Medicaid and Medicare benefits increase the relative attractive-ness of SSA’s disability programs, and hence the demand for their benefits. Changes in eligibility rules for other programs can change the degree to which they are substitutes or complements for the SSA disability programs. For ex-ample, expansion of Medicaid to indi- viduals who are not sufficiently poor to qualify for SSI or universal health insur- ance coverage would reduce or eliminate the complementarity between medical insurance and disability programs.
In our State-level analysis for the 1988-92 period, we found strong evi-dence of effects for State and local gen- eral assistance programs both on applica- tions and awards. GA reductions in seven States and the District of Columbia had highly significant, positive effects on SSI applications and awards for both men and women, and on concurrent applica-tions and awards among men. Estimated effects on applications and awards were nearly identical, and the elasticities were often large, particularly for younger men, and for applications and awards in the mental disorders category.” We later found similar results for initial determi- nations in both the 1980-87 and 1988-93 periods. For the 1980-87 period we also found evidence that both reductions in AFDC benefits and increases in State SSI supplements increased SSI initial deter- minations, but these findings were not replicated in the 1988-93 analysis. The lack of findings for the later period may simply reflect lack of large changes in either AFDC or State SSI supplements.
These findings are the first clear econometric evidence we are aware of demonstrating that changes in other in- come and in-kind transfer programs have an impact on SSI applications and awards, but the lack of previous progress
in this area may just reflect the difficulty
of measuring such effects and the virtual absence of serious research efforts in this area to date. One reason for the lack of previous research is a common belief that anyone who is eligible for SSI as well as either AFDC or GA would already have applied for SSI because SSI benefits are greater. As several welfare administra-tors and other welfare experts have told us, this reasoning neglects the fact that the SSI application and appeals process is prohibitively difficult for many who can much more readily qualify for GA or
AFDC+specially those with mental
disorders.
A primary objective of the case stud- ies was to learn more about the impact of changes in State and local welfare pro-grams on SSI applications and awards. We found that cuts in GA benefits during the 1988-92 period represent only a frac- tion of State and local efforts to shift
welfare recipients-primarily GA recipi-
ents-onto SSI. The most dramatic
ex-ample of shifting efforts from this period occurred in Michigan, which terminated its GA program and, simultaneously, launched a large, coordinated effort to help GA recipients obtain SSI awards. Interviews with State and local officials and others in Michigan as well as follow- up empirical analysis confirmed that the termination of GA, and the coordinated efforts to help former GA recipients, ex-plain why SSI award growth in Michigan was the second highest in the nation dur- ing this period (Bound, Kossoudji, and
Ricart-Moes 1995). We also found new
or intensified efforts to shift GA and other welfare recipients to SSI in other case study States, and significant efforts in many other States have been reported as well (see, for instance, Bordelon 1995).
The findings from the case studies suggest that the econometric models un-derstate the impact of the combination of GA cuts and other State and local shifting efforts. The GA cuts variable used for the analysis is a crude proxy for general State and local welfare changes and shifting efforts; we believe that its estimated coeffi- cient probably understates the impacts of these changes because it fails to capture the effects of shifting efforts that do not in- volve cuts in GA benefits.
Although the findings from the case studies and econometric analysis provide much less support for the hypothesized effect of AFDC benefit changes on SSI, the AFDC findings for 1980-87, a long- term decline in the value of AFDC ben-efits relative to SSI benben-efits (from 1975 to 1992 the level of median AFDC ben-efits for a family of four declined by 37 percent relative to the value of Federal SSI benefits for couples) and evidence that a substantial share of AFDC mothers have disabilities (see Adler 1993) suggest
that AFDC program changes have con- tributed to long-term SSI application and
award growth. Proposed future reforms
to both AFDC and GA programs could have a substantial positive impact on SSI caseloads.
We also attempted to estimate the effect of the rising value of Medicaid benefits on SSI applications and awards, but were not successful in identifying an effect. It seems likely, however, that the absence of a positive finding reflects the difficulty of measuring the value of the benefits rather than the absence of true effects. Welfare administrators and other experts generally attest to the importance of Medicaid benefits to SSI applicants, and recent research on the related topics of “continuation of coverage” mandates (Gruber and Madrian 1993), the effects of Medicaid on AFDC caseloads (Moffitt and Wolfe 1992; Congressional Budget Office 1993; and Yelowitz 1994) confirm
the importance of medical benefits to ,
labor-force and program participation decisions. Yelowitz (1995) explores the effects of Medicaid on SSI.
In the case studies, we found that the burden of health care costs on State and local governments and health care pro- viders was a major factor behind efforts to shift GA recipients and others onto SSI. Health care expenses for indigent patients who are not Medicaid recipients are usually paid by State and local gov- ernments or, implicitly, by providers themselves. When an individual who is not Medicaid eligible obtains eligibility via SSI, the Federal Government begins to pay at least half of these expenses. State and local savings from reduced health spending may be greater than savings from reduced cash benefits. The
fact that AFDC beneficiaries are also eligible for Medicaid helps explain why State and local efforts have focused on GA recipients.
Medicaid reform or general health care reform could have a significant effect on SSI caseloads. Medicaid block grants, which would result in Federal payments to States that are not tied di- rectly to Medicaid enrollment, would significantly reduce the incentives to shift State and local welfare recipients onto SSI. Cutbacks in Medicaid benefits could also have a negative effect. Mak-ing Medicaid benefits available to per- sons with disabilities independently of SSI, or otherwise increasing their access to health insurance, would also be likely to reduce SSI caseload growth.
Features
of
SSA ‘s DiwbilityPrograms und Other Supply Fclctors Features of SSA’s disability pro-grams-such as the real value of benefits, legislative and administrative actions affecting eligibility determination, work incentive provisions. and SSA outreach activities-might substantially affect applications and awards. Other supply factors-such as judicial rulings on ap-
pealed cases-also play a role. Research
on the effects of these factors is, unfortu- nately, extremely difficult to perform. for three reasons:
(1) there is only limited variation in the data;
(2) most changes that do occur tend to affect the whole program, so there are no natural comparison groups; andlor
(3) it is extremely difficult to disen- tangle the effect of programmatic factors from potential confounding factors. Nevertheless. we review here several research directions with some promise of a better un- derstanding of the role of program- matic factors.
Previous econometric work has ad- dressed some important programmatic factors. Most importantly, there is a considerable body of econometric work since the pioneering work of Parsons and Leonard focusing on the effect of wage replacement rates on labor-force and
disability program participation. This body of econometric work has been plagued by serious identification prob-lems, and has produced a wide range of estimates. An alternative
quasi-experimental approach using rejected applicants as a comparison group (Bound 1989) raised fundamental questions about the validity of these estimates, but relies on somewhat questionable assumptions as well. In the future, potential new insights might be gained in this important area by using information on changes in the benefit fomrula that occurred during the seventies to identify the effects of the relative value of DI benefits.
Economic theory suggests that the expected probability of award and future benefit streams should affect applica-tions, and, therefore, changed eligibility rules and their enforcement might be important directly in determining not only awards, but also the pool of appli- cants. Two pioneering studies that per- formed State-level analysis for the 1970’s that is similar methodologically to our own analysis for later years focused on the impact of changes in initial denial rates on DI applications and labor-force participation, taking advantage of what appear to have been exogenous changes in State denial rates. Parsons (1991) estimated that a 1 O-percent increase in denial rates from 1977 to 1978 decreased applications by 4.5 percent from 1978 to 1980. Gruber and Kubik (1994) refined Parsons’ analysis in some respects, but came to essentially similar conclusions. One limitation of both studies is that they did not control for changes in unemploy- ment at the State level or growth and aging of the population during this pe- riod. We replicated Parsons’ findings and then found that controlling for the unemployment rate and growth and aging of the population reduced the size of the estimated effect by about 50 per- cent. Clearly more work is needed in this important area, and the focus of econo- metric work should be extended to re- lated areas, such as the effect of other important features of the disability deter-mination process (such as processing times) on application behavior. Such studies would be particularly timely in light of current efforts to streamline the disability determination process.
-Social Security Bulletin l Vol. 58. No. 4 l Winter 1995
![Table I.-Regression estimates from the analysis of applications and awards for the 1988-92 period [Dependent variable: Logarithm of per-capita application or incidence rate in gender/program category]’](https://thumb-us.123doks.com/thumbv2/123dok_us/9728527.2463497/23.897.39.826.83.460/regression-estimates-analysis-applications-dependent-logarithm-application-incidence.webp)