Journal of Chemical and Pharmaceutical Research, 2015, 7(3):2532-2540
Research Article
CODEN(USA) : JCPRC5ISSN : 0975-7384Development of evaluation method of residual stress measurement for gear
tooth root based on ultrasonic actuation by piezoelectric wafer
Qinxue Pan
1,2*, Xin Jin
1, Dingguo Xiao
1,2and Shuai Liu
11
School of Mechanical Engineering, Beijing Institute of Technology, China
2Key Laboratory of Fundamental Science for National Defence for Advanced Machining Technology, China
_____________________________________________________________________________________________
ABSTRACT
Gears are widely used as machine transmission parts to transfer power and change the speed and direction of rotation. The main failure modes of the gear are broken teeth and tooth surface wear, caused mainly by large residual stress. Traditional inspection methods, such as X-rays, cannot measure tooth root residual stress accurately due to the special structure of the tooth root. In this paper, an ultrasonic method involving the longitudinally critically refracted (LCR) wave was used to measure the gear tooth root residual stress. The special
sensor was actuated by a piezoelectric wafer. An examination of the transmission principle of ultrasonic waves in the gear revealed that measurements of the residual stress of the gear’s tooth root using LCR waves were feasible.
Keywords: Gear tooth root; piezoelectric wafer; residual stress; ultrasonic
_____________________________________________________________________________________________
INTRODUCTION
Gears are widely used in machine transmission parts to transfer power and change the speed and direction of rotation[1]. The measurement of the gear tooth root is critical due to the potential for tooth fracture from large residual stress.
Residual stress is an inherent stress that tends to maintain an internal balance in the component in the absence of external influences. During fabrication, residual stress is created in the gear by forging, turning, carburizing and
quenching, and grinding[2–3]. The residual stress can lead to serious outcomes, including broken teeth, tooth
surface wear, tooth surface erosion, and the formation of tooth surface glue. However, the service life of a gear can be enhanced when compressive stress exists in the gear. As a result, it is very important to improve the state of residual stress in the gear by exploring effective methods for testing residual stress.
To successfully control and make use of residual stress, a method for accurate detection and assessment is required. Rossini et al.[4] provide a detailed summary of testing methods for residual stress in mechanical components. The pipe weld stress are simulated by Jun Liu et al.[5]. Shu Jie Liu predicted life due to residual stress under condition monitoring[6].
= + 2 + [ 4 + 10 + 4 + + 2 ] (1)
where V is the longitudinal wave propagation velocity of the stress, is the density of the material, λ and µ
represent the second-order elastic constants in the material, l and m are the third-order elasticity coefficients, and is the stress value. Positive values indicate tensile stress, whereas negative values denote compressive stress.
If the derivative of both sides of Eq. (1) is obtained, then the relationship between the variation in the ultrasonic velocity and the variation in the stress can be written as follows[11]:
= − (2)
where is the residual stress change, is the acoustic time difference, k is acoustic elasticity coefficient, is
acoustic time of zero stress, = − 2 !⁄ , with K denoting the stress constant.
Equation (2) describes the measurement method used in this study to determine the relative residual stress values. Variations in the acoustic wave facilitate determination of the relative residual stress, providing the key measurement principle of gear residual stress.
2.2 Basic principle of LCR
Within the elastic limit, ultrasonic stress evaluation relies on the linear relationship between the stress and the
velocity or travel time change. The critically refracted longitudinal wave (or LCR wave) is a longitudinal ultrasonic
wave that is used to measure the residual stress. The LCR wave can spread tens of centimeters in a medium and retain
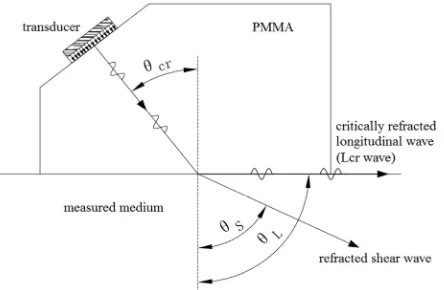
a good waveform. Figure 1 shows the LCR wave, which propagates parallel to the surface at a shallow depth. The
depth depends on the frequency of the ultrasonic transducer.
According to Snell’s law, the ultrasonic longitudinal wave experiences refraction as it propagates from a medium having a lower wave velocity (slower medium) to a faster medium (e.g., from organic glass to steel). If the longitudinal wave refraction angle is 90°, then the longitudinally refracted wave will spread along the surface of the
second medium; this describes the LCR wave. The incident angle is called the first critical angle. The calculation
formula is given below:
#$%= &'()*
*⁄ (3)
where *is the ultrasonic longitudinal wave propagation velocity of the slower medium (m/s−1), is the
ultrasonic longitudinal wave propagation velocity of the faster medium (m/s−1), #$% and is the first critical angle (°)
FIGURE 1. Generation principle of LCR
EXPERIMENTAL SECTION
3.1 Sensor design
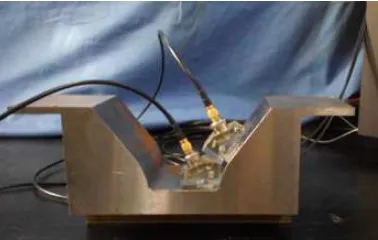
[image:3.595.201.414.366.479.2]In this study, the gear tooth root was measured using the method of chips on a wedge. According to the nature of the involute gear and Snell’s theorem, the angle of the wedge was calculated with respect to limiting wafer movement. The frequency of the wafer was 5 MHz, and the length and width of the wafer were 10 and 5 mm, respectively. The wedge was separated in the middle to eliminate interference. Using the ultrasonic pulse echo method (figure 2), we obtained the acoustic velocity of the organic glass and gear, as described by Eqs. (4) and (5), respectively. The first critical angle is given by Eq. (6), from Eq. (3). The sensor design is shown in figure 3.
FIGURE 2. Acoustic velocity measurement
FIGURE 3. Fabricated sensor
FIGURE 4. Ultrasonic transmission validation
[image:4.595.186.425.497.618.2]FIGURE 5. Time required for LCR to be received in the two different thicknesses of the specimen
FIGURE 6. Ultrasonic propagation path near the root
3.3 Measurement system
The measurement set-up (shown in figure 7) consisted of a computer and two ultrasonic transducers with piezoelectric wafers. The computer set-up includes a data acquisition card and an ultrasonic sending and receiving card. Different frequencies were used to evaluate the residual stresses throughout the gear thickness. The piezoelectric wafer (length: 10 mm; width: 5 mm) was assembled on a united poly(methylmethacrylate) (PMMA) wedge. The data acquisition card consisted of a 100 MHz ultrasonic testing device with pulsar signal–internal clock synchronization capabilities to control an analog-to-digital (A/D) converter, which controls the A/D converter.
0 5 10 15 20 25 30
-2000 -1000 0 1000
m
v
0 5 10 15 20 25 30
-2000 -1000 0 1000
us
FIGURE 7. Measuremental setup
3.4 Gear tooth root residual stress measurement method validation
To verify the accuracy of the ultrasonic measurement of the tooth root residual stress, we machined specimens having the same gear shape. The relationship between stress load and acoustic time are shown in figure 9.
[image:5.595.216.396.396.612.2]FIGURE 9. The relationship between stress load and acoustic time
3.5 Evaluation of the stress constant between the two sensors
We prepared a tension specimen to evaluate the stress constant. The tension sample material was the same as the material used for the measured gear. The tensile stress cannot exceed the material yield strength. The distance from
the ultrasonic transducer was approximately 30 mm. To evaluate the residual stress from Eq. (2), the value t0 was
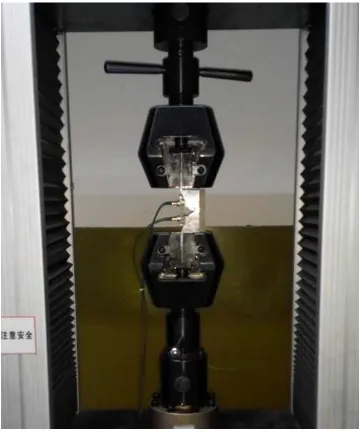
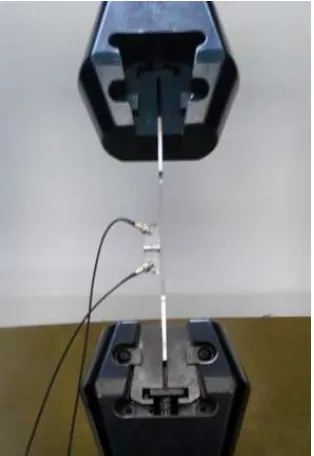
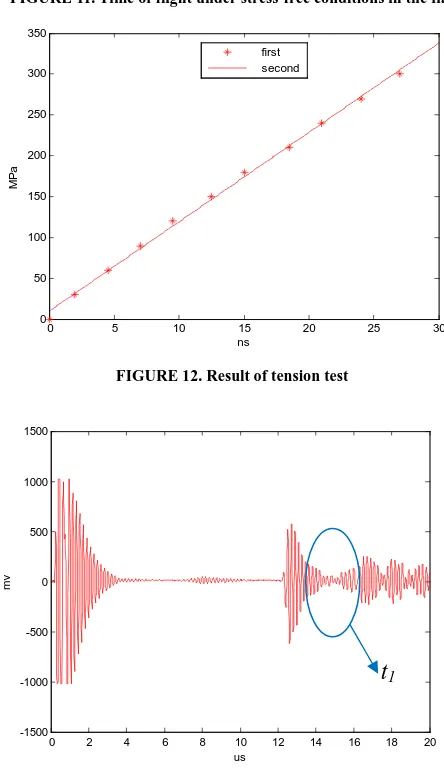
measured directly from the stress-free sample, and the stress constant was deduced experimentally from a uniaxial tension and compression test associated with the ultrasonic measurement, as shown in figure 7. The stress can be calculated according to Eq. (9) under different tensile stress. The load on the specimen ranged from 0 to 300 MPa, using 30-MPa step increments. The experiment was repeated twice. The stress constant was obtained from the slope of the relative variation curve using time-of-flight measurements and the applied stress values (as shown in figure
12). For the tensile specimen, K0 was 10.68 MPa ns
−1, and t
0 was 14.32 µs (as shown in figure 11). Equation (2) was
used to obtain ! 1.2775 × 10)ABCD)*. The ultrasonic propagation time in the gear was t
1 = 12.51 (as shown in
figure 13). The stress constant in the gear is given by
σ = F G⁄ (9)
where
F
is the stress, and S is the cross-sectional area.*=
H= 12.52 BCD (&
⁄ (10)
0 1 2 3 4 5 6
0
[image:6.595.228.385.494.722.2]FIGURE 11. Time of flight under stress-free conditions in the flat
FIGURE 12. Result of tension test
0 5 10 15 20 25 30 35 40
-1500 -1000 -500 0 500 1000 1500 us m v
0 5 10 15 20 25 30
0 50 100 150 200 250 300 350 ns M P a first second
0 2 4 6 8 10 12 14 16 18 20
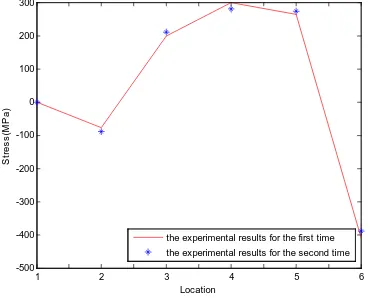
[image:7.595.190.412.269.655.2]FIGURE 14. Axial direction of the gear stress distribution in the tooth root
FIGURE 15. Teeth root stress distribution in 23 tooth gear
CONCLUSION
This study verified that the ultrasonic method can be used to measure the residual stress in a gear tooth root. The
transmission path of a LCR wave can be obtained between the teeth using the method described. The stress constant
in the gear was obtained numerically. Our results are summarized below.
1) The LCR wave propagated near the gear tooth root.
2) The LCR wave was capable of measuring complex curved surface residual stress, such as that associated with
gears.
3) Ultrasonic stress testing is a reliable method for stress indication. 4) The stress constant in the gear was obtained from numerical calculations.
5) The residual stress and the sound change in the gear exhibited a linear relationship. 6) The gear stress distribution was nonuniform without heat treatment.
Acknowledgments
This project is supported by National Natural Science Foundation of China (Grant No.51305028), and Beijing Higher Education Young Elite Teacher Project.
REFERENCES
1 2 3 4 5 6
-500 -400 -300
Location
the experimental results for the first time the experimental results for the second time
[image:8.595.194.407.319.486.2][3] W. T. Song, Q. X. Pan New Technology & Application., 2013, 73-76.
[4] N.S.Rossini, M. Dassisti, K.Y Benyounis. Mater. and Des., 2012, 35 572–588. [5] Jun Liu, Xing Hei Computer Modelling & New Technologies., 2014, 18(5) 7-13
[6] Shu Jie Liu, Ya Wei Hu, Computer Modelling & New Technologies., 2014, 18(5) 55-60 [7] R. Daniel Acoustical Society of America., 2008, 123(2) 599–601
[8] M. Duquennoy, D. Devos, M. Ouaftouh Acoustical Society of America., 2006, 119(6) 3773-3781 [9] M. Ya, P. Marquette, F. Belahcene Materials Science and Engineering., 2004, 257-264
[10] D. Vangi Experimental Mechanics., 2007, 617-623