73:6 (2015) 31–35 | www.jurnalteknologi.utm.my | eISSN 2180–3722 |
Full paper
Jurnal
Teknologi
Simulation Study on Electrical Resistance Tomography using Metal Wall
for Bubble Detection
Suzanna Ridzuan Awa*, Ruzairi Abdul Rahimb, Mohd Hafiz Fazalul Rahimanc, Elmy Johana Mohamadd, Fazlul Rahman Mohd Yunusb, Yasmin Abdul Wahabe, Naizatul Shima Fadzilb, Juliza Jamaludinb
aFaculty of Electrical & Automation Engineering Technology, Terengganu Advance Technical Institute University College (TATiUC), Jalan Panchor, Telok Kalong, 24000, Kemaman, Terengganu, Malaysia
bProcess Tomography and Instrumentation Engineering Research Group (PROTOM-i), Infocomm Research Alliance, Faculty of Electrical Engineering, Universiti Teknologi Malaysia, 81310 UTM Johor Bahru, Johor, Malaysia
cSchool of Mechatronic Engineering, Universiti Malaysia Perlis, Pauh Putra Campus, 02600 Arau, Perlis, Malaysia
dDepartment of Mechatronics and Robotics, Faculty of Electrical and Electronic Engineering, Universiti Tun Hussein Onn Malaysia, 86400, Johor, Malaysia
eDepartment of Instrumentation & Control Engineering (ICE), Faculty of Electrical & Electronic Engineering, Universiti Malaysia Pahang, 26600, Pekan, Pahang, Malaysia
*Corresponding author: [email protected]
Article history
Received : 15 August 2014 Received in revised form : 5 January 2015
Accepted : 10 February 2015
Graphical abstract
Abstract
Industrial process pipelines are mostly known to be constructed from metal which is a conducting material. Bubbles or gas detection are crucial in facilitating the bubble columns performance. By employing the Electrical Resistance Tomography (ERT) technique, a simulation study using COMSOL has been conducted to investigate the effect of excitation strategy, bubble sizes and locations towards the metal wall system. As for the current excitation strategy, conducting boundary protocol has to be applied when it comes to metallic vessel to overcome the grounding effect. Bubbles with a greater size than 2 mm and especially the one that is located near the wall boundary are much easier to detect. Further potential improvements to the current design and image reconstruction of the ERT system are desirable to improve the detection of small and centred bubble.
Keywords: Electrical resistance tomography; metal wall; conducting boundary; bubble
© 2015 Penerbit UTM Press. All rights reserved.
1.0 INTRODUCTION
Gas holdup is a very important parameter for mass transfer operation in bubble columns. The average gas holdup is a global parameter and it is important in deciding the size of reactor. The radial gas holdup distributions will give local gas concentration, and help understanding the flow pattern. The development and the application of non-intrusive and non-invasive measuring technique capable of investigating gas holdup distributions will greatly facilitate current efforts to predict and improve reactor performance. Neal and Bankoff [1] first made measurement of radial gas holdup distribution in the two-phase flow using an electrical resistivity probe. Since then, many measurements using different techniques have been reported. Various conventional measuring techniques such as the hot wire probe, electro-resistivity probe, optical fiber probe as well as pressure tap and shutter plate, have been devised. However, these are not suitable
because the measurement themselves interfere the motion of bubbles, and consequently vary the hydrodynamics of the system [2].
potential of providing both qualitative analysis by providing the data required for measurement of some flow parameters, such as velocity distribution, and flow regime identification [19]. As a non-intrusive, fast visualization tool, close attention has been paid to ERT in multiphase flow research. Compared with conventional measurements, ERT can provide real-time cross-sectional images of conductivity distribution within its sensing region. Other parameters, for example local and global gas hold-ups and radial velocity maps, can be extracted from the reconstructed images [20].
This technique has been applied in many areas, including medical imaging, environmental monitoring, and industrial processes. There are many examples of ERT used to qualitatively image the material distributions of multiphase processes within electrically insulating (non-conducting) walls. However, only a few studies deploying ERT within electrically conducting vessels have been reported, and these have provided primarily qualitative results for the purpose of process monitoring [21]. A simulation study using ERT techniques to monitor the gas volume fraction, which is the phantom of bubble for the application of conducting bubble column reactor, is investigated.
2.0 THEORETICAL BACKGROUND
[image:2.612.377.504.387.490.2]The basic idea of ERT is that the conductivity of different media is distinct from each other. Thus, the medium distribution of the measured area can be identified if the conductivity or resistance distribution of the sensing field is obtained [22, 23]. The operation mode of an ERT system is to provide the sensing field with exciting current (or voltage) and measure the potential difference (or current) via electrodes mounted on the boundary of the domain [24, 25]. Usually, the operating principle of the ERT system is current exciting and the output voltage is measured. The exciting current is applied into the measurement section through a pair of electrodes and excites the sensing field. When the conductivity distribution varies, the sensing field varies with it and results in the change of the electric potential distribution. Likewise, the boundary voltage of the sensing field changes accordingly. The measured voltage contains information on the conductivity in the sensing field, and the internal flow status can be obtained from further information processing [23]. This is shown in Figure 1. In the case of the conducting pipes or vessels, the electrodes need to be insulated from the conducting wall [26].
Figure 1 Operating principle of ERT [23]
A measurement strategy is necessary, especially in ERT, to define the experiment which involves a metal or conducting vessel. In ERT, quantitative data which describes the state of the conductivity distribution inside the vessel is obtained. Good data collection strategies are very important because generally misleading images can be rebuilt if a full set of independent
measurements is not collected [27, 28]. For all intents and purposes, selecting the strategy that has good distinguished ability and high sensitivity to conductivity changes in the process is necessary in ERT. There are four main strategies in ERT: the adjacent strategy, conducting boundary strategy, opposite strategy and diagonal strategy. The injection and measurement protocol for each strategy are different for each other. Details on it can be referred from [29].
The first application of ERT only considered electrode arrangements operating within vessels having insulating walls and applied the adjacent measurement strategy which is the common one. This strategy is as illustrated in Figure 1. In this strategy, current is injected between an adjacent pair of electrodes and voltage is measured from successive pairs of neighbouring electrodes. The injection pair is switched through the next electrode pair until all independent combinations of measurements have been completed. However, the majority of the process vessels in industry have conducting walls and therefore provide an additional current sink during the measurement process. This gives rise to both reduced sensitivity in the bulk of the material and increased difficulty in obtaining stable measurements referenced to the injected currents [30].
[image:2.612.85.262.524.634.2]Before applying ERT to an electrically-conducting vessel, an electrical path passing through the vessel wall must be taken into consideration. The adjacent strategy is unsuitable for application to the conducting vessel since much of the electrical current from the injection electrode would travel to ground through the wall material rather than through the multiphase mixture, greatly reduce the sensitivity. This is called as the grounding effect of the vessel. One possible method of accounting for the conducting vessel wall is to use the wall itself as the ground electrode [31].
Figure 2 Conducting boundary strategy [21]
Conducting boundary strategy, as in Figure 2, has been proposed and developed in [32] for the conducting vessel wall to overcome the grounding effect. The injection and measurement pair of 16 electrodes using this strategy is tabulated in Table 1. The number of unique measurements, N, in the conducting boundary or ‘metal wall’ strategy can be defined as follows:
𝑁 = 𝑛(𝑛−1)2 , (1)
where n is the total number of electrodes [30]. For adjacent and opposite strategies, the total numbers of independent measurements are given by (2) and (3) respectively:
𝑁 = 𝑛(𝑛 − 3)/2 (2)
𝑁 = 𝑛4(3𝑛2 − 1) (3)
Table 1 Measurement strategy for conducting boundary
Receiver
Source e1 e2 e3 e4 e5 e6 e7 e8 e9 e10 e11 e12 e13 e14 e15 e16 No. of measurement
e1 X 15
e2 x 15
e3 x 15
e4 X 15
e5 x 15
e6 x 15
e7 x 15
e8 x 15
e9 x 15
e10 x 15
e11 x 15
e12 x 15
e13 x 15
e14 x 15
e15 x 15
e16 x 15
Total Measurements 240
3.0 RESEARCH METHODOLOGY
Modeling and simulation of the system in 2D was done by using COMSOL Multiphysics software (simulation software package for various physics and engineering applications). This simulation study aimed to investigate and analyze the effect of varying bubble location and size towards the potential distribution of ERT using conducting bubble columns.
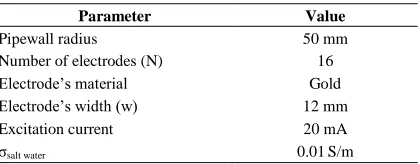
[image:3.612.332.555.197.311.2]Sixteen rectangular electrodes were implemented. The electrodes were attached evenly along the circumference of a stainless steel pipe wall. And, the electrodes are ensured to be insulated from the metal wall. The parameters being applied throughout the simulation are shown in Table 2.
Table 2 Simulation parameters with COMSOL 4.2a
Parameter Value
Pipewall radius 50 mm
Number of electrodes (N) 16
Electrode’s material Gold
Electrode’s width (w) 12 mm
Excitation current 20 mA
σsalt water 0.01S/m
Prior to building a model using COMSOL Multiphysics, users need to specify the desired space dimension, select physics interfaces and study type. In the simulation study, the Electric Currents interface under the AC/DC branch was used. The interface was chosen since it would produce an electrical field and has the electrical potential distribution required for the analysis. It also contains the equations, boundary conditions, and current sources for modelling electric currents in conductive media, solving the electric potential. After the modelling stage, the following steps were taken:
i. Create a physical model using available geometries ii. Define materials for each domain in the created
model
iii. Assign input and output for the system built iv. Mesh the model
v. Run the simulation vi. Pre-process the data
To overcome the grounding effect of the vessel, a conducting boundary strategy was implemented on the model. The strategy considered that each electrode would act sequentially as a current source whilst the whole of the conducting vessel behaved as a grounded current sink. In this strategy, all the voltage measurements were referenced to the same earth potential of the conducting boundary [33]. By adopting the conducting boundary strategy, a constant current was applied at source electrode, es and the output voltages from 15 pairs of electrodes from e1 to e15 were measured. Meanwhile, the column itself was grounded and acted as the current sink. The model under investigation is shown in Figure 3.
Figure 3 Investigated model
In this simulation study, firstly the adjacent versus conducting strategy were simulated on the model using stainless steel pipe to investigate the theory mentioned beforehand. After that, using conducting protocol, the homogeneous and nonhomogeneous systems with varying bubble location from A to E as in Figure 3 are simulated. The effect on potential distribution and its sensitivity are analysed for the 10mm bubble’s radius. Last but not least, authors analysed the effect of varying bubble size for the system.
4.0 SIMULATION RESULTS AND DISCUSSION
The superiority of the conducting boundary strategy over the adjacent protocol for a metallic vessel is confirmed in an experiment conducted by [21]. For this simulation study, authors had simulated a homogeneous model in COMSOL with conductivity of 0.01 S/m for a metal pipe wall using adjacent and conducting strategy. The results attained for the surface electric potential and current density streamline are illustrated in Figure 4 and Figure 5.From the results, the theory mentioned earlier has been proven where the pipe wall itself need to be grounded when using metal wall. The adjacent strategy on a metal pipe will cause the equipotential lines around the centred object radiate from the centre of the pipe. Thus, when applying ERT on a metallic bubble column, conducting boundary approach need to be implemented.
Stainless steel pipe (Sink/Ground)
Air Bubble Electrode
Insulator
Source
[image:3.612.71.281.432.514.2]Figure 4 Metal wall and adjacent strategy
Figure 5 Metal wall and conducting strategy
Next, the simulation is carried on the nonhomogeneous medium to investigate the effect of bubble size and location towards the potential change ∆V/Vh with respect to the corresponding potential in the homogeneous medium. The responses are shown in Figure 6 and Figure 7 respectively. The bubble is placed at the centre of the pipe wall initially and was simulated for numbers of radius, i.e. 0.5 mm, 1 mm, 2 mm, 3 mm, 5 mm, 7 mm and 10 mm. The results show that bubble of 0.5 mm and 1 mm radius are approximately the same as the homogeneous medium. This indicates that the centred bubbles are quite difficult to be detected especially for bubble that has a very small radius. The responses for bubble of radius 5 mm and above are far more sensitive towards the current injection compared to a smaller bubble as can be seen in Figure 6. This means that bigger size of bubbles is much easier to be detected for centred bubble in ERT. Owing to the higher current densities near source electrode, es, the
potential difference for bubbles of 3 mm radius and above are positive for electrodes located near to the source. The potential difference corresponding to the homogeneous medium drops to a negative value for e4 to e12 as the current densities deteriorate as it
[image:4.612.321.555.60.265.2]travels through the medium.
Figure 6 Effect on varying centred bubble size
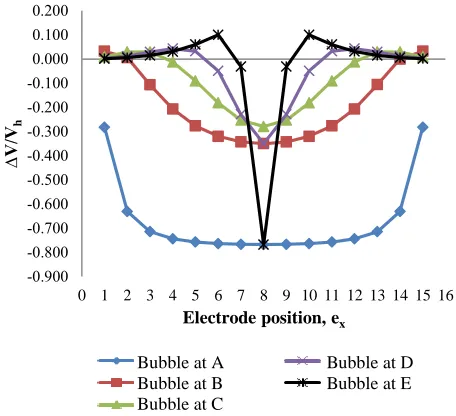
The potential change ∆V/Vhwith respect to the corresponding potential in the homogeneous medium in Figure 7 is investigated when the location of the bubble of 10 mm radius is varied. Bubble at A refers to the bubble located nearest to the source, es. Then it
is moved to B, C, D and E accordingly as illustrated in Figure 3 above. The data obtained from the simulations provide a greater potential difference for the bubble at A which is the nearest from source electrode. This is due to the higher current densities at es.
As the bubble travels farther from the source, the surface potential for each electrode will deteriorate and become less sensitive towards the detection. Thus, it is obvious that ERT system is more sensitive to the bubble near source electrode.
[image:4.612.321.549.443.651.2]Bubble at A Bubble at D Bubble at B Bubble at E Bubble at C
Figure 7 Effect of varying bubble location
5.0 CONCLUSIONS
A simulation study has been carried out to investigate the detection of bubble in a metal wall using ERT of 16 electrodes system. Obviously a conducting boundary approach needs to be
-0.3 -0.28 -0.26 -0.24 -0.22 -0.2 -0.18 -0.16 -0.14 -0.12 -0.1 -0.08 -0.06 -0.04 -0.02 0 0.02 0.04 0.06
0 1 2 3 4 5 6 7 8 9 10 11 12 13 14 15 16
∆
V
/Vh
Electrode Position, ex
-0.900 -0.800 -0.700 -0.600 -0.500 -0.400 -0.300 -0.200 -0.100 0.000 0.100 0.200
0 1 2 3 4 5 6 7 8 9 10 11 12 13 14 15 16
∆
V
/Vh
considered when applying ERT on metal wall to avoid the grounding effect. Higher potential difference between the homogeneous and nonhomogeneous medium shows that bigger size bubble and the one located near to source electrode are easier to be distinguished. Higher current excitation or injection strategy is recommended in detecting centered and smaller size bubble in addition to improvement of the system performance in ERT. The conductivity distribution to generate the tomogram can be acquired from the surface potential in the proposed system.
Acknowledgement
The authors are grateful to the PROTOM Research Group UTM and for financial support from MyBrain15 Programme and TATi University College.
References
[1] L. G. Neal and S. G. Bankoff. 1964. A High Resolution Resistivity Probe for Determination of Local Void Properties in Gas–Liquid Flow. 490– 494.
[2] M. D. Supardan, Y. Masuda, A. Maezawa, and S. Uchida. 2007. The Investigation of Gas Holdup Distribution in a Two-phase Bubble Column Using Ultrasonic Computed Tomography. Chemical Engineering Journal. 130: 125–133.
[3] M. Fransolet, P. Crine, P. Marchot, and D. Toye. 2005. Analysis of Gas Holdup in Bubble Columns with Non-newtonian Fluid Using Electrical Resistance Tomography and Dynamic Gas Disengagement Technique.
Chemical Engineering Science. 6118–6123.
[4] M. Hamidipour and F. Larachi. 2010. Characterizing the Liquid Dynamics in Cocurrent Gas-liquid Flows in Porous Media Using Twin-plane Electrical Capacitance Tomography. Chemical Engineering Journal. 165: 310–323.
[5] H. Jin, Y. Lian, Y. Qin, S. Yang, and G. He. 2012. Distribution Characteristics of Holdups in a Multi-stage Bubble Column Using Electrical Resistance Tomography.
[6] H. Jin, M. Wang, and R. A. Williams. 2007. Analysis of Bubble Behaviors in Bubble Columns Using Electrical Resistance Tomography.
Chemical Engineering Journal. 130: 179–185.
[7] H. Jin, S. Yang, M. Wang, and R. A. Williams. 2007. Measurement of gas Holdup Profiles in a Gas Liquid Cocurrent Bubble Column Using Electrical Resistance Tomography. Flow Measurement and Instrumentation. 18: 191–196.
[8] M. A.-D. Junli Xue, M. P. Dudukovic, R. F. Mudde. 2007. Bubble Velocity, Size, and Interfacial Area Measurements in a Bubble Column By Four-point Optical Probe. AICHE. Wiley online.
[9] J. Kourunen, T. Niitti, and L. M. Heikkinen. 2011.Application of Three-dimensional Electrical Resistance Tomography to Characterize Gas Holdup Distribution in Laboratory Flotation Cell. Minerals Engineering.
24: 1677–1686.
[10] A. Shaikh and M. Al-Dahhan. 2005. Characterization of the Hydrodynamic Flow Regime in Bubble Columns via Computed Tomography. Flow Measurement and Instrumentation. 16: 91–98. [11] V. P. Chilekar1, M. J. F. Warnier1, J. van der Schaaf, B. F. M. Kuster, J.
C. Schouten, J. R. van Ommen. 2005. Bubble Size Estimation in Slurry Bubble Columns from Pressure Fluctuations. AICHE. Wiley online. [12] M. R. Widyanto, M. B. Utomo, K. Kawamoto, B. Kusumoputro, and K.
Hirota. 2006. Local Gas Holdup Measurement of a Bubble Column Using SONIA-ultrasonic Non-invasive Method. Sensors and Actuators A: Physical. 126: 447–454.
[13] Z. Cao and L. Xu. 2012. Direct Image Reconstruction for 3D Electrical Resistance Tomography by Using The Factorization Method. In 2012 IEEE International Instrumentation and Measurement Technology Conference, I2MTC 2012, May 13, 2012–May 16, 2012, Graz, Austria. 1919–1922.
[14] J. K. L M Heikkinen, T. Savolainen, P J Vauhkonen, J P Kaipio and M Vauhkonen. 2006. Real Time Three-dimensional Electrical Impedance Tomography Applied in Multiphase Flow Imaging. Measurement Science and Technology. 17.
[15] H. Jin, S. Yang, G. He, M. Wang, and R. A. Williams. 2010. The Effect of Gas-liquid Counter-current Operation on Gas Hold-up in Bubble Columns Using Electrical Resistance Tomography. Journal of Chemical
Technology and Biotechnology. 85: 1278–1283.
[16] Y. Xu, H. Wang, Z. Cui, and F. Dong. 2009. Application of Electrical Resistance Tomography for Slug Flow Measurement in Gas/Liquid Flow of Horizontal Pipe. In 2009 IEEE International Workshop on Imaging
Systems and Techniques, IST 2009, May 11, 2009 - May 12, 2009, Hong
Kong, China. 319–323.
[17] F. Dong, E.-P. Li, and B.-B. Wang. 2007. Optimization Design of Electrical Resistance Tomography Data Acquisition System. In 6th International Conference on Machine Learning and Cybernetics, ICMLC
2007, August 19, 2007–August 22, 2007, Hong Kong, China. 1454–1458.
[18] F. Dong, C. Tan, J. Liu, Y. Xu, and H. Wang. 2006. Development of Single Drive Electrode Electrical Resistance Tomography System. IEEE
Transactions on Instrumentation and Measurement. 55: 1208–1214.
[19] M. Sharifi and B. Young. 2012. Qualitative Visualization and Quantitative Analysis of Milk Flow Using Electrical Resistance Tomography. Journal of Food Engineering. 112: 227–242.
[20] C. Yang, H. Wang, and Z. Cui. 2012. Application of Electrical Resistance Tomography in Bubble Columns for Volume Fraction Measurement. In 2012 IEEE International Instrumentation and Measurement Technology Conference, I2MTC 2012, May 13, 2012–May 16, 2012, Graz, Austria. 1199–1203.
[21] B. D. Grieve. 2002. On-line Electrical Impedance Tomography for Industrial Batch Processing. Degree of Doctor of Philosophy, Department of Chemical Engineering, UMIST Manchester, UK.
[22] M. S. B. A. Plaskowski, R. Thorn and T. Dyakowski. 1995. Imaging Industrial Flow. London: IOP Publishing Ltd.
[23] C. Tan and F. Dong. 2009. Gas-Water Two-Phase Flow Regime Identification with Feature Fusion from an ERT System and a VCone Meter. IEEE. 2: 218–222.
[24] S. Hosseini, D. Patel, F. Ein-Mozaffari, and M. Mehrvar, "Study of solid-liquid mixing in agitated tanks through electrical resistance tomography,"
Chemical Engineering Science, vol. 65, pp. 1374-1384, 2010.
[25] C. Tan, F. Dong, and M. Wu. 2007. Identification of Gas/Liquid Two-phase Flow Regime Through ERT-based Measurement and Feature Extraction. Flow Measurement and Instrumentation. 18: 255–261. [26] S. J. Stanley and G. T. Bolton. 2008. A Review of Recent Electrical
Resistance Tomography (ERT) Applications for Wet Particulate Processing. Particle and Particle Systems Characterization. 25: 207–215. [27] M. Kaminoyama, K. Nishi, R. Misumi, and A. Tagawa. 2007. Presented
at the 5th World Congress on Industrial Process Tomography, Bergen, Norway.
[28] L. Pakzad, F. Ein-Mozaffari, and P. Chan. 2008. Measuring Mixing Time in the Agitation of Non-newtonian Fluids Through Electrical Resistance Tomography. Chemical Engineering and Technology. 31: 1838–1845. [29] F. Dickin and M. Wang. 1996. Electrical Resistance Tomography for
Process Applications. Measurement Science and Technology. 7: 247– 260.
[30] J. L. Davidson. 2004. Three-dimensional Electrical Impedance Tomography Applied to a Metal-walled Filtration Test Platform.
Measurement Science and Technology. 15: 2263–2274.
[31] S. G. Liter, J. R. Torczynski, K. A. Shollenberger, and S. L. Ceccio. 2002. Electrical-Impedance Tomography for Opaque Multiphase Flows in Metallic (Electrically-Conducting) Vessels. Sandia National Labs., Albuquerque, NM (US); Sandia National Labs., Livermore, CA (US). [32] M. Wang, F. J. Dickin, and R. A. Williams. 1994. Electrical Resistance
Tomography of Metal Walled Vessels and Pipelines. Electronics Letters.
30: 71–773.
[33] J. L. Davidson, L. S. Ruffino, D. R. Stephenson, R. Mann, B. D. Grieve, and T. A. York. 2004. Three-dimensional Electrical Impedance Tomography Applied to a Metal-walled Filtration Test Platform.
![Figure 2 Conducting boundary strategy [21]](https://thumb-us.123doks.com/thumbv2/123dok_us/8765324.896103/2.612.85.262.524.634/figure-conducting-boundary-strategy.webp)