Journal of Chemical and Pharmaceutical Research, 2014, 6(7):1070-1075
Research Article
CODEN(USA) : JCPRC5
ISSN : 0975-7384
Interactive data mining framework for Chinese traditional
therapeutic evaluation
Yuhai Zhao and Ying Yin
Department of Computer Science and Engineering, Northeastern University, Shenyang, China
_____________________________________________________________________________________________
ABSTRACT
Data mining, which aims at extracting interesting information from large collections of data, has been widely used as an effective decision making tool. This paper broke through traditional therapeutic evaluation method with only by individual experience and proposed an interactive data mining framework, by which therapeutic evaluation will be automatically implement to maximize the adaptive capacity of data mining. During the processing, a series of data mining algorithms be applying and domain expert may affect the mining behavior as a object factors and how they affects the behavior is also discussed. The experiment results demonstrate that the proposed a series of algorithms enable the Therapeutic Evaluation system robust and efficient. It is also observed that medical application of the model in therapeutic evaluation offers the advantages of data mining and there is an emerging need for mining medical application with data mining techniques.
Key words: Data Mining; Interesting Rules; TC-Cluster
_____________________________________________________________________________________________
INTRODUCTION
Clinic Syndrome Differentiation and Therapeutic Evaluation is the fundamental for surviving and development in Chinese Medicine. For example, every year many people are affected by pneumonia, and some of them die. It is important that pneumonia disease is diagnosed early and accurately, especially for some heart disease [1-3]. The traditional clinical diagnosis and therapeutic evaluation of pneumonia are in the manner of recording and summarizing the alleviate of symptoms with subjectivity and libitum or by manually operating some data analysis tools, e.g. SPSS. However, this is a labor intensive process, and the comparison is very difficult to be exhaustive and it is very difficult to apply to high level interactions.
Data mining is an important technology and a lot of novel methods dealing with large data sets for different domains have been proposed in the recent years. There are many publications in data mining, but very few of them focus on applications on medical data. The following are some possible limitations: 1) Understandability of results. Although data mining can help reveal patterns and relationships [4], it does not tell the user the significance of these patterns. Much effort is necessary for domain experts to turn the results to practical use; 2) Amount of results. Some results by many data mining method are often unmanageable. For example analytical specialists need to analysis and interpret the output. However, it is quite impossible for domain experts to review a huge number of rules; 3) Interestingness measure. In medical applications, we not only want to see mined patterns but interesting for medical domain. Hence this requires a special measurement [5] of interestingness. This paper broke through traditional research method of therapeutic evaluation system. The main contributions of this paper are summarized as follows:
(2) We proposed two new patterns: important pattern and common pattern based the interesting measure.
(3) We propose a new clustering model, namely t-cluster, which take into consideration the fact that attributes with strong correlation do not have to bespatially close in correlated subspace. t-cluster capture not only the coherent patterns but also the time-shifting coherent patterns.
(4) Utilizing the important pattern and common pattern discovered to perform a causal analysis of a medical data set, which are more clear than association rules. From the viewpoint of biomedical researcher, it is more suitable to analysis the medical data set.
The rest of this paper is organized as follow: Section 2 introduces the global framework of CMDM and we also describe the key approach of CMDM. Finally, we conclude with a summary of our results and directions for future research in Section 3.
THE CMDM FRAMEWORK
We propose an interactive framework which considers interactive factors during data mining process. Figure 1 shows the system architecture of the interactive data mining framework based on Chinese Medicine. There are there steps in our CMDM framework: Precessing, Syndrome Differentiation and Therapeutic Evaluation. In the framework, we obtain the Syndrome Differentiation system of objective by implementing an adaptive clustering algorithm and medical interesting pattern mining algorithm. The two steps mentioned above are premise of the last step which is the key step, therapeutic evaluation. For further processing therapeutic evaluation, we designed the temporal association rules for mining time-shifting patterns, exception detection and other techniques to assistant the decision support system for medical diagnosis applications. Limited by space, we only summarize the main algorithms below [6-9].
Fig1. The Chinese Medicine Data Mining Framework based on pediatrics Pneumonia
Interesting Measure
( ) ( )
( )
( ) ( )
k k
k
k k
Supp P T Supp P T
OR P T
Supp P T Supp P T
¬ ¬
→ =
¬ ¬
U U
U U
Where, Supp is abbreviation of Support. Supp(P∪Tk) denote the support of pattern P and Tk emerging simultaneity, Supp(P∪¬Tk)=Supp(P)-Supp(P∪Tk), Supp(¬P∪Tk)=Supp(Tk)-Supp(P∪ Tk), and Supp(¬P∪ ¬ Tk)=1-Supp(P )-Supp(Tk)+Supp(P∪Tk).
Interesting Association Rules Mining
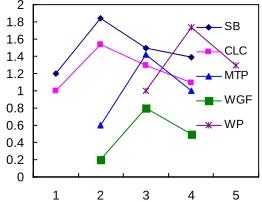
Association Rule (AR) Mining is one of the fundamental data mining tasks and has been widely accepted by a wide range of application because of the simplicity of the problem statement and the effectiveness of pruning by support. However, an intrinsic problem of mining association rules is that a prohibitively large number of rules can be easily generated not all of the rules are interesting. The large size of the mining result makes further analysis very difficult, especially for a special domain. Hence it is important to select the right measure for a given application domain. Utilizing the appropriate measure, some uninteresting rule will be prune efficiently. In medical applications, the important patterns usually exist in every types of the diseases. interesting rule discovery uncovers rules that maximize an interestingness measure, because it can prune some uninteresting itemsets. So, interesting rule discovery is significantly more efficient than association rule discovery. We can draw a conclusion that our algorithm(IR) only generate the maximal interesting rules which reduce the redundant rules dramatically shows in Figure 3. In Figure 4, we compute the pattern’OR value [7, 10] in different phenotypes. We clearly see that each pattern’OR value is different in different phenotypes, which illuminate the different signification of the same pattern in di erent outcome phenotypes and the impoff rtance of interesting measure.
Algorithm 1 Interesting Association Rules algorithm(IAR) Input: Data set D, minimum Support θ
Output: Pattern sets R
1: Set R = φ
2: Count support of 1-patterns in every phenotype 3: Generate 1-pattern set
4: Count supports of 1-pattern in different phenotype
5: Select 1-pattern respectively and add them to R 6: new pattern set ← Generate(2-pattern set) 7: while new pattern set is not empty do
8: Count Supp(P,Tk) of candidates in new pattern set
9: For each pattern P in (l+1)-pattern set 10: IF Supp(P→ Tk)< γ
11: remove pattern S;
12: Else if there is a sub pattern P’ in l-pattern set 13: Supp(P’)= Supp(P) or
14: Supp(P’,¬Tk)=Supp(P,¬Tk)
15: Then remove pattern P; 16: Count the OR value; 17: Select IAR to R; 18: ENDIF 19: end while
20: new pattern set ← Generate(next level pattern sets) 21: Return R;
The algorithm 1 discuss the support-based pruning and OR-based pruning. Existing algorithms to find an interesting rule sets are to post-prune an association rule set but this may be very inefficient when the minimum support is low and it will be generate a mount of redundancy rules. Our IAR algorithm makes use of the interestingness measure property to efficiently prune uninteresting rules and save only the maximal interesting rules instead of all ones, and this distinguishes it from an association rule mining algorithm [11-13].
Tendency-based Clustering Algorithm
[image:3.595.192.426.336.588.2]In this paper, we proposed the pattern-based biclustering algorithm TC-cluster, which take into consideration the fact that attributes with strong correlation do not have to be spatially close in correlated subspace. We partition the original dataset into two experiment dataset and validate dataset, By a series experiments, we draw a conclusion that our TC-cluster is efficient in Figure 2. Where, mint presents minimal time points; ming presents minimal patterns.
Algorithm 2 T-cluster algorithm Input: Data Set D, δ, mint, ming
Output: maximal T-Clusters
1: M ←∅; l=1;
2: Create initial T-tree for 1-layer with height 2, T2
3: if mint = 2 then
4: Insert those in T2 into M as maximal T-clusters if they satisfy the conditions
5: end if
6: Call DFS(Tl, lf)
7: Insert those in Tlinto M as maximal T-clusters if they satisfy the conditions;
8: Return M;
Procedure: DFS(Tl, lf)
1: for the leftmost layer lf do
2: branch lfto l’f
3: if the result on l’f is maximal then
4: output it to M 5: end if 6: DFS(Tl, l’f)
7: end for
The t-Cluster algorithm has two main steps: (1) Construct initial T-tree. The coherent-tendency information and preliminary t-clusters of all 1-leyer are preserved in this step; (2) Develop initial T-tree recursively to find all maximal t-Clusters. Unlike the previous algorithms, we take a "first breadth-first and last depth-first" searching strategy, which make the algorithm more efficient. Where, the task of mining is to find all maximal t-clusters, and all the given thresholds. mint: minimal time points; ming: minimal patterns.
EXPERIMENTAL SECTION
The interactive data mining framework was support by national nature science fund. All the pneumonia data in this paper come from eight hospital institutions. The data set contains 20000 cases, where belong to six different pneumonia. Patients are described by 112 attributes, but not all the attributes are useful to mining. Some information including age, sex, household address, telephone number are excluded during the preprocessing.
In figure 2, we compute the pattern’OR value in different phenotypes. We clearly see that each pattern’OR value is different in different phenotypes, for example, pattern HF’OR value is great differentation in different phenotype, HF is important pattern in phenotype1 but not in phenotype 3, which illuminate the different signification of the same pattern in different outcome phenotypes and the importance of interesting measure.
0 0.5 1 1.5 2 2.5 3 3.5 4
TFW RT HF FN SPP LF Pattern
O
R
V
a
lu
e
Phenotype1 Phenotype2 Phenotype3
0 0.2 0.4 0.6 0.8 1 1.2 1.4 1.6 1.8 2
1 2 3 4 5 SB
CLC
MTP
WGF
[image:4.595.137.274.565.665.2]WP
[image:4.595.343.474.569.670.2]0 50 100 150 200 250 300 350 400 450
0.01 0.02 0.03 0.04 0.05 0.06 0.07
Phototype Support R u n T im e s (m s ) AR Closed AR IAR 10 100 1000 10000
1 2 3 4 5 6 7 the layer th
N u m b e r o f ru le s AR Closed AR IAR
Fig. 4(a) Run times vs. support Fig. 4(b) The numbers of rules vs. algorithms
We nd a group of similar tendency characters from t-cluster 8. Obviously, not any pair of the 5 genes shows similar pattern under the same time sequence, but any pair shows the general similarity. So our t-cluster algorithm can successfully identify this similar tendency patterns.
Figure 4 (a) compare the runtime of rules with the different support(range from 0.01 to 0.07) with different algorithms(AR, closed AR and IAR). Figure 4 (b) compare the runtime of rules with the same support by different layer-th. We can see that IAR algorithm always consume the least time, because it prune the redundant rules in each level.
Further, Our goal is to identify the differentiate characters from multiple pneumonia phenotypes. We set the support as 0.01. It returned 6 phenotypes and corresponding characters. The following are three important representative patterns and two common patterns for phenotype Tk.
Important Pattern: OR=18.52, Significance test: χ2 = 6.24, P<0.05, High Fever = 38.50C∼400C
Cough = ”frequency” Moist Rales = ”short”
it illuminate the pattern is relevant to phenotype Tk. Common Pattern: OR=1.102 Significance test: Fever = 36.50C ∼ 370C
Moist Rales = ”normal”
Limited by space, we don’t list all the experiment results.
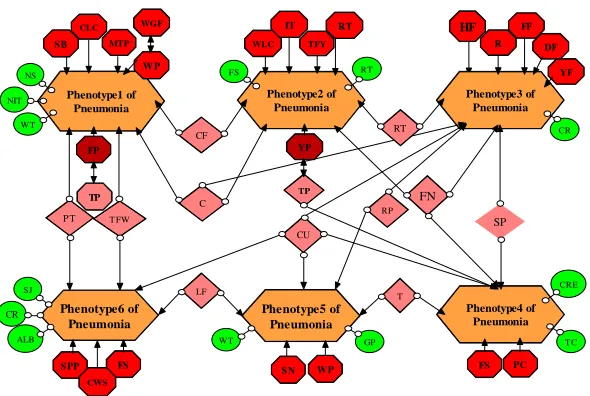
Phenotype5 of Pneumonia Phenotype6 of Pneumonia Phenotype1 of Pneumonia Phenotype2 of Pneumonia HF CLC Phenotype3 of Pneumonia Phenotype4 of Pneumonia FN CF C CU T LF
T FW RP
MTP WLC W P P T RT SP NS SB W P WGF FP TP YP TP IT RT TFY R FF DF YF FS PC
S PP FS SN
[image:5.595.82.525.67.200.2]NIT WT FS RT GP WT SJ CR ALB TC CRE CR CWS
Fig. 5: Causal analysis graph of multiple phenotype pneumonia
[image:5.595.160.455.476.674.2]2. Bidirected edges (←→) indicating the two patterns are appearance together. It means one pattern’s appearance go with another pattern’s appearance together.
3. Directed edges with a small circle at its tail (o→) also indicate a cause-effect. It means the pattern are common cause for more than two phenotypes. It will not be the highest important pattern.
4. Edge with circles at both ends (o–o) indicate that either could be causing the other. It means the pattern would be the protect pattern.
CONCLUSION
This paper broke through traditional therapeutic evaluation method with only by individual experience and proposed an interactive data mining framework, by which therapeutic evaluation will be automatically implement to maximize the adaptive capacity of data mining. The experiment results demonstrate that the proposed a series of algorithms enable the Therapeutic Evaluation system robust and efficient. It is also observed that medical application of the model in therapeutic evaluation offers the advantages of data mining and there is an emerging need for mining medical application with data mining techniques.
Acknowledgment
This work was supported by National Natural Science Foundation of China under grants (No. 61100028, 61272182, 61073062); the NewCentury Excellent Talents in University Award(NCET-11-0085); the Ph.D. Programs Foundation of Ministry of Education of China(youngteacher) (No.20110042120034).
REFERENCES
[1]Liu Xiao-lan. China Sport Science and Technology. 1984, 29(13), 46-49.
[2]Luo Yang-chun. Journal of Shanghai Physical Education Institute. 1994, 23(12), 46-47. [3]Wan Hua-zhe. journal Of Nanchang Junior College. 2010, 3, 154-156.
[4]Li Ke. Journal of Shenyang Sport University. 2012, 31(2), 111-113.
[5]Zhang Shu-xue. Journal of Nanjing Institute of Physical Education. 1995, 31(2), 25-27. [6]Pan Li. Journal of nanjing institute of physical education(natural science). 2004, 19(1), 54-55. [7]Li Yu-he; Ling Wen-tao. Journal of Guangzhou Physical Education Institute. 1997, 17(3), 27-31. [8] Xu Guo-qin. Journal Of Hebei Institute Of Physical Education. 2008, 22(2), 70-72.
[9] Chen Qing-hong. China Sport Science and Technology. 1990, 21(10), 63-65
[10] Tian Jun-ning. Journal of Nanjing Institute of Physical Education. 2000, 14(4), 149-150.
![Figure 3. In Figure 4, we compute the pattern’OR value [7, 10] in different phenotypes](https://thumb-us.123doks.com/thumbv2/123dok_us/8765428.896155/3.595.192.426.336.588/figure-figure-compute-pattern-value-different-phenotypes.webp)