Journal of Chemical and Pharmaceutical Research, 2014, 6(4):334-339
Research Article
CODEN(USA) : JCPRC5
ISSN : 0975-7384
A model of predicting hog prices based on hadoop and SVM
Ziliang Liang and Ying Chen*
Agriculture and Forestry University of Zhe Jiang, China
_____________________________________________________________________________________________
ABSTRACT
In order to improve the result reliability of predicting hog prices, this paper proposes a model of predicting hog prices based on Hadoop and support vector machine (SVM). First, the pig information is mined from the websites about pigs by the distributed computing technology provided by Hadoop. Second, the multiple regression model is constructed by adding arguments from the pig information gradually which can obtain the key indicators of affecting the pig price fluctuation. Then, through rewriting the map and reduce functions in Hadoop, the corresponding data sets of key indicators are extracted. Finally, the model of training and testing hog prices is established by the method of SVM on the basis of key indicators and corresponding data sets. The experimental result shows that the model of predicting hog prices based on Hadoop and SVM is more reliably.
Keywords: hadoop, svm, multiple regression model, key indicators, predict hog prices
_____________________________________________________________________________________________
INTRODUCTION
With the rapid development of internet technology, a growth trend about the information of pigs is shown on the web. Through mining data from the web, the valuable information about hog prices can be obtained. Just Hadoop is a distributed system infrastructure developed by the Apache Foundation, which provides the distributed computing technology of underlying package, task allocation, parallel processing, fault tolerance and so on [1-2]. So Hadoop can process mass data on the web well [3-5] , which provides a solution of mining pig information. In view of the pig is the main source of meat for urban and rural residents which has an important impact on the quality of life for residents, how to extract pig information and better predict hog prices becomes an important research topic of domestic and foreign scholars.
As opposed to the way of getting key indicators and accessing to key indicator data, just applying old annual data or selecting the rate of change or price index compared to the previous year, in this paper we propose a method of analyzing and handling with data by rewriting the map and reduce function in Hadoop and extracting key indicators by the multiple regression model. In addition, from the experimental results, we can see that the method proposed in this paper has higher accuracy on forecasting hog prices.
2. Extract key indicators of affecting hog prices 2.1. Access to pig information
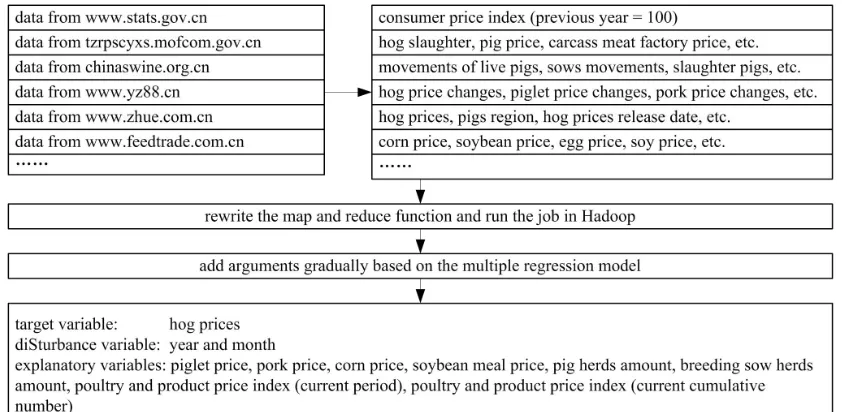
[image:2.612.96.517.209.415.2]On the website, there are a lot of information about the pigs, such as the monthly consumer price index released by the National Bureau of Statistics and the pig herds trend described in the national pig situation report. The specific information is shown in Figure 1.
Figure 1. Extracting key indicators of affecting hog prices from pig information
Just Hadoop is the open source framework which core is composed by the distributed file system (HDFS) and MapReduce [18]. HDFS is a stable file system that provides data storage and block location services by data node. And MapReduce implements a distributed programming model, which makes the program distributed to the cluster be executed concurrently. So the pig information can be acquired by transfering the files from the website to HDFS and rewriting the map and reduce functions in Hadoop. The main steps of rewriting the map and reduce functions are given as follows:
(1) Create the public class of PriceMapReduce which extends Configured implements Tool. Then in the class of PriceMapReduce, the static class of PriceMapper which extends MapReduceBase implements Mapper<LongWritable, Text, Text, Text> is created and the map function is overrided by taking the year and month field as its key and other fields as the corresponding value.
(2) Create the static class of PriceReducer which extends MapReduceBase implements Reducer<Text, Text, Text, Text> in the class of PriceMapReduce, and override the reduce function by taking the string output of map as its input and removing the missing data fields.
(3) Override the run function by configuring the job in the class of PriceMapReduce: setJobName: PriceMapReduce
setOutputPath: output
(4) Run the job by calling the runJob function.
Through the above steps the information related to pigs can be obtained.
2.2. Extract key indicators
Third-order headings, as in this paragraph, are discouraged. However, if you must use them, use 10-point Times New Roman, boldface, initially capitalized, flush left, preceded by one blank line, followed by a colon and your text on the same line.
There are many factors of affecting hog prices. What factors are selected is important to assess hog prices. So the extraction of the key factors have been considered by making use of the obtained pig information. Here a multiple regression model is established which specific form is as follows:
y = a0+ a1x1+ a2x2+ …… + anxn+ δ (1)
In the formula 1,yrepresents the hog prices,a0is a constant term,δrepresents the disturbance variable,xirepresents explanatory variables.
Then applying the software of statistical product and service solutions (SPSS), the regression analysis of this model is carried out by adding arguments gradually. If thepvalue of theFstatistic is sufficiently small, then at each step, considering all the independent variables of the regression equation, the variable which makes the equation have the smallestFstatistic is added in this equation. However, if thep value of theFstatistic becomes relatively large, the variable just added will be removed from the equation. The standard of adding a variable is that thepvalue of theF
statistic ofyis less than or equal to 0.05.
These regression operations can not be stopped until no variable can be removed from the regression model and no outside variable can be added in the regression model. At this moment, the key indicators are obtained, that is the explanatory variables seen Figure 1 specifically.
2.3. Obtain the data of key indicators
In the light of the key indicators has been obtained, the data of these key indicators can be got by rewriting the reduce function again in Hadoop by only keeping the fields of key indicator and deleting unrelated fields.
3. Establish the SVM model of hog prices 3.1. Categorize hog prices
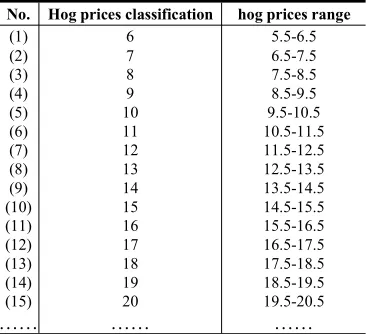
[image:3.612.215.398.539.706.2]In order to facilitate the follow-up model training, the hog prices are categorized by the method of rounding, the classification categorized is as follows (Table 1):
Table 1. Hog prices category(yuan/kg)
No. Hog prices classification hog prices range
(1) 6 5.5-6.5
(2) 7 6.5-7.5
(3) 8 7.5-8.5
(4) 9 8.5-9.5
(5) 10 9.5-10.5
(6) 11 10.5-11.5
(7) 12 11.5-12.5
(8) 13 12.5-13.5
(9) 14 13.5-14.5
(10) 15 14.5-15.5
(11) 16 15.5-16.5
(12) 17 16.5-17.5
(13) 18 17.5-18.5
(14) 19 18.5-19.5
(15) 20 19.5-20.5
As shown in Table 1, when the hog prices is between 5.5 and 6.5 yuan per kilogram, the corresponding classification is 6 yuan per kilogram.
3.2. Establish the training and predictiving model of hog prices
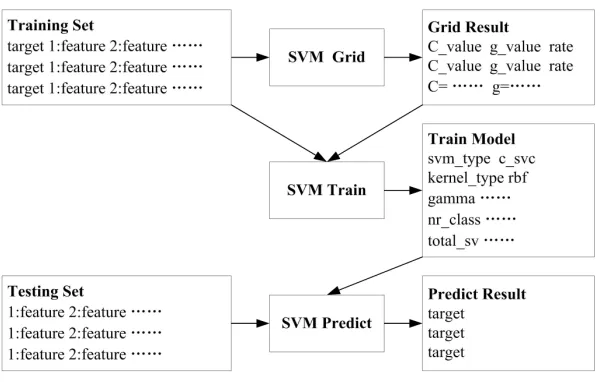
[image:4.612.157.457.137.328.2]The training and predicting model of hog prices based on SVM [19-20] is shown in Figure 2.
Figure 2. The training and predicting model of hog prices based on SVM
One important part of this model is to choose the kernel function and determine its parameters. Given the RBF kernel function can handle non-linear relationship between the tags and attributes which can map sample nonlinear to a higher dimensional space and be applicable to the arbitrary distribution of the sample by choosing the parameters, the RBF kernel function is selected for the model in this paper. The form of the kernel function is as follows:
K(x, y) = exp(-||x-y||2/2σ2) (2)
In the formula 2,σis greater than zero which represented by g behind. The function involves two parameters: the error penalty parameter (C) and gaussian kernel parameter (g).Candg are determined by the bilinear web search method because of the bilinear search method has the characteristics of a small amount of computation and the web search method has higher learning accuracy [21]. In the condition of limiting the range of error between 2-10and 210, the parameters are being adjusted constantly. Finally the optimum parameters are obtained: the optimumCis 64.0 and the optimumgis 0.00390625.
The SVM model is trained by the training algorithm making use of the training set and the adjusted C and g
parameters. Then by the predicting algorithm applying the trained model and the test set, the classification of hog prices can be predicted.
EXPERIMENTAL SECTION
The experimental platform is built based on the tool of SPSS and on the open source software of Hadoop [22] and LibSVM [23]. And for using Hadoop, it is needed to setup the environment of Cygwin and config the path of JAVA_HOME. The rewritten map and reduce functions also need to be packaged into a jar file and the information related to pigs can be obtained by running the command as follows:
bin/hadoop jar hadoop-0.19.2-price.jar PriceMapReduce input output
RESULTS AND DISCUSSION
The predictions based on the SVM model are shown in the following table:
Table 2. Results of predicting of prices
Year and month Actual value Predicted value Hog prices range
201305 12.86 13 12.5-13.5
201306 14.40 14 13.5-14.5
201307 14.82 15 14.5-15.5
201308 15.93 16 15.5-16.5
From the Table 2, the classification result of hog prices in May 2013 is 13 which corresponding hog prices range is bewteen 12.5 and 13.5, the actual hog prices is 12.86 yuan per kilogram just within this range. And in August 2013 the hog prices is 15.93 yuan per kilogram is also within the range between 15.5 and 16.5. The results are shown that the model of predicting hog prices based on Hadoop and SVM is effective which can predict hog prices more reliably.
CONCLUSION
Mastering the fluctuation of hog prices may reduce the risk of pig producers, increase the incoming of those who provides hog and stabilize the cost of living for consumers. So the paper proposes a method of predicting hog prices which mines the pig information by Hadoop and extracts the key indicators by the multiple regression model and gets the key data by rewriting the map and reduce function in Hadoop which are taken as the input data of the SVM training model. Experimental results show that this method is more reliably than previous.
However, this model is just a simple and preliminary model, how to dig out more efficient hog prices data and choose the most appropriate characteristic variables of affecting hog prices are need to be further explored.
Acknowledgment
The authors would like to thank the anonymous reviewers for their helpful reviews. The work is supported by the Students Science and Technology Innovation Activities Scheme and Emerging Artists Talent Program of Zhejiang under No. 2013R412040 and by the Students Science and Technology Innovation Activities Program project of Zhejiang Agriculture and Forestry University under No. TMKC1356.
REFERENCES
[1] Wongoo Lee, Yunsoo Choi, Minho Lee. IJACT: International Journal of Advancements in Computing Technology, 2013,Vol. 5, No. 12, pp.138-143 .
[2] Xun-Yi Ren, Yu-Zhu Qi.Journal of Applied Sciences,2013,Vol. 13, No. 12, pp. 2178-2181.
[3] Yannan Wang, Hui Liu, Shudong Zhang.JCIT: Journal of Convergence Information Technology, Vol. 8,2013, No. 9, pp.130-137.
[4] Miao Cheng and Huaping Chen.Journal of Computer Engineering,2011, Vol. 37, No. 11, pp. 37-39.
[5] Guangmin Hu, Liang Zhou and Linxin Ke.Journal of Computer Knowledge and Technology,2010, Vol. 6, No. 22, pp. 65-69.
[6] Shoujun Zhao and Gaofeng Ju.Journal of Rural Economy and Technology,2012, Vol. 23, No. 2, pp. 98-100. [7] Degang Ji, Jing Zhou, and Chunlan Li. “Time Series Analysis Model in the Application of Predicting and Analyzing Hog Prices”.Journal of the Market Modernization,2008.
[8] Xiaowu Ma, Ting Wang, and Xia Dong.Journal of Animal Science of China,2007, Vol. 43, No. 23, pp. 4-6. [9] Xiongwei Ma and Zaiqing Zhu.Journal of Inner Mongolia Agricultural University (Social Sciences Edition),
2008, Vol. 10, No. 4.
[10] Ruiying Zhao, Huiying Chen, and Xuecheng Yang.Journal of Operations Research and Management,2008, Vol. 17, No. 4, pp. 128-131.
[11] Rong Yang.Journal of Livestock Economy,2011, Vol. 47, No. 18, pp. 6-10.
[13] D. Ingco Melinda. “Econometric and Arima Models in Predicting Cattle and Hog Prices All Evaluation”. Master thesis, Michigan State University,1983.
[14] Kiran, M., Kumar, Amresh, Mukherjee, Saikat, Ravi Prakash G. International Journal of Computer Science
Issues (IJCSI),2013, Vol. 10, No. 3, pp. 317-325.
[15] Caruana, Godwin, Maozhen Li, and Man Qi. "A Map Reduce based Parallel SVM for Large Scale Spam Filtering." Fuzzy Systems and Knowledge Discovery (FSKD), 2011 Eighth International Conference,2011, Vol. 4, pp. 2659-2662.
[16] Md. Wasi-ur-Rahman, Nusrat Sharmin Islam, Xiaoyi Lu, et al. "High-Performance RDMA-based Design of Hadoop MapReduce over InfiniBand". Proceedings of the 2013 IEEE 27th International Symposium on Parallel and Distributed Processing Workshops and PhD Forum. IEEE Computer Society,2013, pp. 1908-1917.
[17] Rama Krushna Reddy and Rajesh R. Nair.Journal of Earth System Science,2013, Vol. 122, No. 5, pp. 1423-1434.
[18] Feng Zhou and Xuwei Li.Journal of Computing Technology and Information Development,2009, Vol. 6, No. 25, pp. 100-104.
[19] Yuanchun Ding, Falu Weng, Hui Liu, Ji Ge, IJACT: International Journal of Advancements in Computing Technology,2013, Vol. 5, No. 9, pp. 79-85.
[20] Wu Fengping, Pan Wenwen,IJACT: International Journal of Advancements in Computing Technology,2013, Vol. 5, No. 2, pp. 801-808.
[21] Donghui Liu, Jianpeng Bian, Ping Fu, and Zhiqing Liu. Journal of Hebei University of Science and Technology,
2009, Vol. 30, No. 1, pp. 58-61.