© 2018, IRJET | Impact Factor value: 6.171 | ISO 9001:2008 Certified Journal | Page 4929
Airplane Crash Analysis Using LDA
Sudesh Rao
1, Shruthi
2, Shruthivinaya M
3, Prashanth Rao
4, Sarvesh Ramesh Naik
51
Asst. Prof. Dept of CSE, Srinivas School of Engineering, Mangalore.
2,3,4,5UG student, Dept of CSE, Srinivas School of Engineering, Mangalore.
---***---Abstract -
Data mining is defined as a process used toextract usable data from a larger set of any raw data. It is used in the many area, like medicine, environment, education, crime, etc. In this research work crash investigation and analysis of the flights are done. Flight crashes may be caused due to pilot error, mechanical failure, bad weather, sabotages or human error. This research paper investigates international flight crashes since 1908 to 2009 through K-Means clustering data mining technique and LDA. Clustering helps to put objects into the same group. LDA measure helps in finding similarity among different texts. The research work is done for identifying aboard/ground fatality rate with location as well as to find comparison among the flight crashes.
Key Words: Clustering, data mining, LDA,K-Means
clustering.
1. INTRODUCTION
Air accident is caused due to pilot error, mechanical error, bad weather, sabotages or human error. these error can be happened any time. air accident is also called flying mischance. aeronautics misfortunes can happened at any time .flying mischance cases have a Great degree complexity .aircraft crashes cause harm to the population as it may lead to the deaths of people or may even cause Injuries to the people. crash investigation is a major research area and the major techniques used for this investigation are statistics ,grid computing, cloud computing, digital image processing and data mining .with data mining ,we can parse through extremely large amount of data and find out unknown patterns of air mischance. The Major of our project is to use data mining techniques to find out unknown patterns in the international flight crash dataset. the research is carried on aircraft crash and fatalities data collected from the year 1908 to 2009.This work is carried out using k-mean clustering data mining technique and cosine similarity measure.
The paper is further structured as follows theoretical background, methodology, experimental setup, analysis and conclusion Aircraft crashes are fundamental to weather (thunderstorm, strong winds, etc.), pilot error, etc. There is a necessity to study these issues. The study helps to understand who all are suffering, what is the reason for the crash and what harm is it causing to the general population and how can we prevent them. The crashes may cause loss of human life as well as loss of natural resources.
Finding designs in the aeronautical data physically is impracticable because of the mass measure of data delivered each day. This vast amount of data can be analyzed and
measured using various computing techniques. Data mining is a computing technique that can be used to discover unknown patterns from the massive dataset. , produced to make expectations for future data in light of examples found in gathered data. Data Mining techniques can be classified as classification, prediction, association and clustering. The table given below depicts the various techniques used to analyze aircraft related issues (Refer Table I).
Clustering is a procedure of forming a group of abstract objects into categories of similar objects. Clustering algorithms can be split into partitioned and hierarchical clustering. Partitioned clustering algorithms aims to find out the groupings present in the data by optimizing a specific objective function and iteratively enhancing the quality of the partitions. They are also called prototype-based clustering algorithms [2].
2. THEORETICAL BACKGROUND
The most common reasons for plane accidents are pilot error, mechanical failure, human error, etc. These parameters are explained as follows:
1. Pilot Error – Roughly 50% of the aircraft losses incur due to pilot error. There are many chances for The pilots to cause errors from failing to program correctly to miscalculation of the required fuel.
2. Mechanical Failure - Despite developments in model and manufacturing standards of the aircrafts, mechanical failures account for 20% of aircraft losses.
3. Weather - Despite of having multiple electronic aids, aircrafts still struggle to function properly when the weather turns out to be unpleasant like in storms, snow and fog.
4. Sabotage - The dangers posed by sabotage are much less than many people seem to believe. Approximately 10% of aircraft losses occur due to sabotage.
© 2018, IRJET | Impact Factor value: 6.171 | ISO 9001:2008 Certified Journal | Page 4930
3. LITERATURE SURVEY
“Flight Crash Investigation Using Data Mining Techniques”. The research work is done for identifying aboard/ground fatality rate with operators and locationas well as to find similarity among the plane crashes [3].
Analysing relationships between aircraft accidents and incidents. In proceedings of the international conference on research in air transportation. In this research he employed a data mining technique to conduct the holistic analysis of aircraft incident data in relation to the accident data. The analysis identifies the relation between the accident and incident data and finds the patterns of casual and contributory factors which are significantly associatively with the aircraft accident [4].
Improvement of aircraft accident investigation through expert systems. In this research presented in this paper shown that expert system methodology is a robust approach to analyzing the aircraft accident investigation [3].
“ data clustering algorithms and applications ”,CRC press. In this research the data clustering algorithm and application provides complete coverage of area of clustering from the basic method to more refined and data clustering approaches.it pays special attention to the in graphs, social networks [6].
4. METHODOLOGY
In natural language processing, Latent Dirichlet
allocation (LDA) is a generative statistical model that allows
sets of observations to be explained by unobserved groups
that explain why some parts of the data are similar. For example, if observations are words collected into documents, it posits that each document is a mixture of a small number of topics and that each word's creation is attributable to one of the document's topics.
Fig -1: methodology.
The methodology to be adopted for the research is depicted in Flight Crash Dataset - The flight crash dataset contains structured as well as unstructured dataset. It contains various attributes like date, time, location, operator, flight number, route, plane type, registration, cn/ln, aboard, fatalities, ground and summary. It was collected from opendata.socrata.com [7].
Latent Dirichlet allocation (LDA) -is a generative
statistical model that allows sets of observations to be
explained by unobserved groups that explain why some
parts of the data are similar. For example, if observations are words collected into documents, it posits that each document is a mixture of a small number of topics and that each word's creation is attributable to one of the document's topics.
Data Reduction/Pre-processing - The dataset has structured (date, time, location, etc.) and unstructured (summary of the airplane crash) data. The dataset is reduced by considering certain attributes for the analysis and by removing the empty rows. The reduced numerical dataset contains the following attributes: location, operator, route, aboard, fatalities and ground while the reduced unstructured dataset contains only 1 attribute, i.e. summary. The numerical dataset is used to find out the fatality rate of air crashes while the unstructured dataset is used for finding content similarity from the summary.
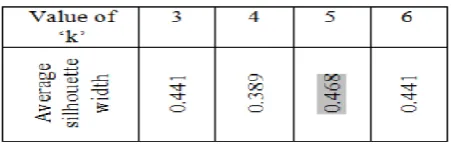
[image:2.595.321.547.491.563.2]Identifying the value of ‘k’ - The value of ‘k’ is verified using the average silhouette operator. The value of ‘k’ which has the highest average silhouette width is selected. In this case, ‘k’=’5’ is selected (Refer Table I).
Table -1: selecting the value of 'k'.
K-Means clustering - is the most broadly utilized partitioned clustering algorithm. It begins by randomly taking ‘K’ representative points as the initial centroids. Each point is then appointed to the nearest centroid based on a particular proximity measure picked. Once the clusters are formed, the centroids for every cluster are updated. The algorithm iteratively repeats until the centroids don’t change. K-Means clustering is a greedy algorithm which is guaranteed to converge to a local minimum, but the minimization of its score function is known to be NP-Hard.
Algorithm for K-Means clustering: “
1. Select K points as initial centroids.
© 2018, IRJET | Impact Factor value: 6.171 | ISO 9001:2008 Certified Journal | Page 4931 a. Form K clusters by assigning each point to its closest
centroid.
b. Re-compute the criterion of each cluster.
3. Until the convergence criterion is met.”
5. EXPERIMENTAL SETUP
A. Dataset Used
The flight crash dataset was taken from the website [7]. It consists of flight crash details dated from 1908 to 2009. The attributes of the dataset are date, location, operator, summary, etc.
Original Dataset:-
Total number of rows in dataset are 5269.
Total number of columns in the dataset are 21.
Attributes in the dataset are date, time, location, operator, flight number, route, plane type, registration, cn/ln, aboard, fatalities, ground and summary.
Reduced/Pre-processed Numerical Dataset:-
The number of rows considered after data cleaning is 3535.
The number of columns considered for analysis is 6. The attributes considered for analysis after data reduction are location, operator, route, aboard, fatalities and ground. A screenshot of the pre-processed numerical dataset is shown in Fig. 2.
Reduced/Pre-processed Unstructured Dataset:- The number of rows considered after data cleaning is 3535.
The number of column considered for analysis is 1. The attribute considered for the analysis after data reduction is summary. A screenshot of the pre-processed unstructured data is shown in Fig. 3.
[image:3.595.310.565.85.239.2]Fig -2: Pre-processed Numerical Dataset.
Fig -3: Pre-processed Unstructured Dataset.
5.1. Clustering of Numerical Dataset
The factors considered in the analysis are as follows:
1. Fatality rate with operator
2. Fatality rate with location
The above factors were considered for ground/aboard fatality.
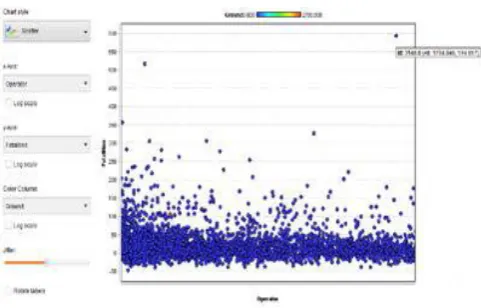
[image:3.595.309.550.415.569.2]5.1.1. Case Study 1: Fatality rate with Operator
Fig -4: operator v/s fatality with respect to ground.
The ID 3148 refers to the highest fatality rate, i.e. 583, that was caused by the Pan American World Airways/KLM at
Tenerife, Canary Island while travelling from Tenerife to Las Palmas. The Id 3148 resides in cluster 2. The range for ground is 0 to 2750 (Refer Fig. 4) which can be referred from the different colors scaled above the graph (blue, green, red).
[image:3.595.41.291.569.715.2]© 2018, IRJET | Impact Factor value: 6.171 | ISO 9001:2008 Certified Journal | Page 4932 5.1.2.1. Result Analysis for Cluster 0.
Fig -5: location v/s fatality with respect to ground/aboard.
The countries having equal to or greater than 50% of 290(50% of the highest fatality rate from cluster 0) were considered
(Refer Fig. 5). The highest fatality rate is 290 over the Persian Gulf, near Bandar Abbas in Iran. Chicago O'Hare, Illinois in
USA with 271, near Sakhalin Island in Russia with 269, near Mt. Erebus in Antarctica with 257, near Ban Nong Rong in
Thailand with 223, off Bandra in India with 213, near Donetsk in Ukraine with 170, off Abidjan in Ivory Coast with 169, near
Alma-Ata Kazakhstan with 166, Tripoli in Libya with 157 and near Konigs Wusterausen, Germany with 156.
5.1.2.2. Result Analysis for Cluster 1
The countries having equal to or greater than 50% of 329(the highest fatality rate from cluster 1) were considered (Refer
Fig. 6).
Fig -6: location v/s fatality with respect to ground/aboard.
The highest fatality rate is 329 over the Atlantic Ocean, 110 miles west of Ireland. Lockerbie in Scotland with 259, near
Uchuduk in Uzbekistan with 200, Mt. San Pietro, near Ajaccio, Corsica in France with 180, near Krasnaya Polyana,
Russia with 174, near Omsk in Russia with 174, Maravatio in Mexico with 167 and near Kathmandu in Nepal with 167.
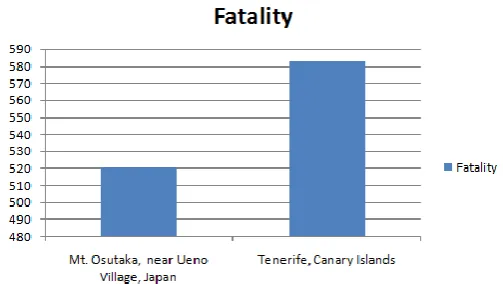
5.1.2.3. Result Analysis for Cluster 2
The countries having equal to or greater than 50% of 583(the highest fatality rate from cluster 2) were considered (Refer
Fig. 7). The highest fatality rate is 583 at Tenerife in Canary Islands and the second highest fatality is 520 at Mt. Osutaka
near Ueno Village in Japan. The countries having equal to or greater than 50% of 583(the highest fatality rate from cluster 2) were considered (Refer Fig. 7). The highest fatality rate is 583 at Tenerife in Canary Islands and the second highest fatality is 520 at Mt. Osutaka near Ueno Village in Japan. The countries having equal to or greater than 50% of 583(the
highest fatality rate from cluster 2) were considered (Refer Fig. 7). The highest fatality rate is 583 at Tenerife in Canary
[image:4.595.35.293.103.244.2]Islands and the second highest fatality is 520 at Mt. Osutaka near Ueno Village in Japan.
Fig -7: location v/s fatality with respect to ground/aboard.
The countries having equal to or greater than 50% of 583(the highest fatality rate from cluster 2) were considered (Refer
Fig. 7). The highest fatality rate is 583 at Tenerife in Canary Islands and the second highest fatality is 520 at Mt. Osutaka near Ueno Village in Japan.
6. CONCLUSION
[image:4.595.309.561.440.582.2] [image:4.595.38.289.585.732.2]© 2018, IRJET | Impact Factor value: 6.171 | ISO 9001:2008 Certified Journal | Page 4933 maximum fatality, i.e. 4266, of all the other operators. The
route Tenerife - Las Palmas has got the maximum number of fatalities. The research work can be extended using other clustering techniques like Density Based, Hierarchical clustering. The summary report of the dataset is used to identify better clusters using distance measures like cosine similarity. Cosine similarity is used for finding the similarity among the crashes. Majority of the flights crashed in USA. The flights with id This study covered accidents and incidents pertaining to commercial flights within the United States. A similar study could be conducted on the General Aviation (GA). Depending on the availability of the data, the studies could be extended to regions in other countries.
REFERENCES
[1] Zhang, J. (2007).Visualization for information retrieval(Vol. 23). Springer Science & Business Media.
[2] Shagun Sharma,Ms. A.Sai Sabitha “Flight Crash Investigation Using Data Mining Techniques”. The research work is done for identifying aboard/ground fatality rate with operators and location as well as to find similarity among the plane crashes.
[3] Nazeri, Z., Donohue, G., & Sherry, L. (2008). Analyzing Relationships Between Aircraft Accidents and Incidents. In Proceedings of the International Conference on Research in Air Transportation.
[4] Milosovski, G., Bil, C., & Simon, P. (2009). Improvement of aircraft accident investigation through expert systems. Journal of Aircraft, 46(1), 10-24.
[5] Aggarwal, C. C., & Reddy, C. K. (Eds.). (2013). “Data Clustering: Algorithms and Applications”. CRC Press.
[6] .https://opendata.socrata.com/Government/Airplane-Crashes-andFatalities-Since-1908/q2te-8cvq.
[7] Gaikwad, S. V., Chaugule, A., &Patil, P. (2014). Text mining methods and techniques. International Journal of Computer Applications, 85(17).
BIOGRAPHIES
Sudesh Rao is a Asst. professor in Srinivas School of Engineering Mangalore. He has 2 year of experience in computer science department.
Shruthi is a final year student in computer science department in Srinivas School of Engineering, Mangalore.
Shruthivinaya M is a final year student in computer science department in Srinivas School of Engineering, Mangalore.
Prashanth Rao is a final year student in computer science department in Srinivas School of Engineering, Mangalore.
Sarvesh Ramesh Naik is a final year student in computer science department in Srinivas School of Engineering, Mangalore.