© 2017, IRJET | Impact Factor value: 5.181 | ISO 9001:2008 Certified Journal | Page 1270
Efficiency of Neural Networks Study In the Design of Trusses
Shaikh Afran Akram
1, Dr. R. J. Fernandes
2, Basavaraj.G
31
Shaikh Afran Akram, P.G student, Dept. of Civil Engineering, SDMCET Dharwad, Karnataka, India
2Dr. R. J. Fernandes, Professor, SDMCET Dharwad, Karnataka, India
3
Basavaraj.G, Assistant Professor, SDMCET Dharwad, Karnataka, India
---***---Abstract -
Neural network are simply known as biological nervous system. An Artificial Neural Network (ANN) is an information processing system that is inspired by the way biological nervous systems, such as the brain, process information. This paper examines the efficiency of neural network. Taking into consideration types of ANNs such as Generalized Regression (GR) neural network, Radial Basis Function (RBF) neural network, Linear Layer (LL) neural network efficiency of ANNs is checked in the design of trusses. The neural networking tool available in MATLAB(8.1) is used. To train ANNs, various input and output data are provided using an analysis and design package STAAD PRO. The ANNs are trained with some values and are tested for both interpolation and extrapolation. Then percentage error is calculated in all three ANNs. Based on percentage error, the efficiency of each ANN is compared in the design of trusses. The study is made by increasing number of trainings, by increasing number of input and output variables, by training in the matrix form etc. From these results, suitability of each ANN is studied and conclusions are drawn.Key Words: Artificial Neural Networks, Generalized Regression, Radial Basis Function, Linear Layer neural networks.
1. INTRODUCTION
The progressive work of McCulloch and Pitts (1943) was the establishment stone for the development of neural system designs. In their paper, McCulloch and Pitts proposed the unification of neuro – physiology with scientific rationale, which gave significant results in neural network research. Infact, the McCulloch – Pitts demonstrate even impacted Von Neumann to attempt new outline innovation in the development of EDVAC (Electronic Discrete Variable Automatic Computer).ANN are great at solving algorithmic and math problems, but often the world can't easily be defined with a mathematical algorithm. Facial recognition and language processing are examples of problems that can't easily be expressed into an algorithm, however these tasks are of importance to humans. Neural networks are typically arranged in layers. Layers are made up of a number of interconnected 'nodes'. These interconnected nodes contain an 'activation function'. Patterns are sent to the network through the 'input layer', which communicates to one or more 'hidden layers' where the actual processing is done through a system of weighted 'connections'. The hidden layers are then connected to an 'output layer' where the answer is output. ANNs are used in optimization of
structures, in the field of concrete technology, character recognition, image compression, etc.
1.1 Methodology
1 To develop ANN model for truss analysis, a neural networking tool available in MATLAB is used. 2 The analysis is carried out by considering single, two
and three input parameters. To train ANN, various input and output data are necessary.
3 The ANN has been analyzed by using the STAAD. Pro 2006 results. Once ANN is trained it is tested for several values within trained range effectively and calculating their percentage error by comparing with STAAD. Pro 2006 results. After analyzing the neural network performance one over the other and from these results conclusions are drawn.
4 The network is then trained and used in solving untrained instances of the problem in the design of trusses.
2. TYPES OF ANNs USED FOR STUDY
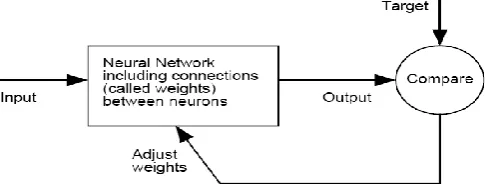
[image:1.595.311.554.585.678.2]Regularly neural systems are prepared and examined with the goal that a specific input gives particular target output. Such a condition is demonstrated as follows. There, the system is balanced, in view of a correlation of the output and the objective, until the point when the system output coordinates the target. Regularly numerous such input/target sets are utilized, in this directed learning, to prepare a system.
Fig -1: Flow chart for training of neural network
© 2017, IRJET | Impact Factor value: 5.181 | ISO 9001:2008 Certified Journal | Page 1271
2.1 Radial Basis Neural Network (RBNN)
[image:2.595.326.556.60.239.2]RBF’s are embedded in a two layer neural network, where each hidden unit implements a radial activated function. The output units implement a weighted sum of hidden unit outputs. The input into an RBF network is nonlinear while the output is linear. In order to use a Radial Basis Function Network we need to specify the hidden unit activation function, the number of processing units, a criterion for modeling a given task and a training algorithm for finding the parameters of the network. Finding the RBF weights is called network training. If we have at hand a set of input-output pairs, called training set, we optimize the network parameters in order to fit the network outputs to the given inputs. Radial basis functions are embedded into a two-layer feed-forward neural network. Such a network is characterized by a set of inputs and a set of outputs. In between the inputs and outputs there is a layer of processing units called hidden units. Each of them implements a radial basis function.
Fig -2: Radial Basis Neural Network
2.2 Generalized Regression Neural Network
(GRNN)
The General Regression Neural Network (GRNN) is one of the most popular neural networks. They have a parallel structure where the learning is one fold that is input to structure to output there is no iterative learning present such as in the case of Multi Layer Perceptrons (MLP) making them fast to some extents. GRNN are being used in medical classification, predictive and diagnostics problems because a lot of noisy data is present is such cases.
The GRNN infrastructure consists of four layers input, hidden, summation and output layer.
The input layer merely transports the data attributes to the next layer in a parallel archetype. The second layer consists of all the training
samples.
In the summation layer the summation units or neurons perform a dot product on the attributes of the weight vector of the second layer.
[image:2.595.55.271.336.442.2] Then in the output layer the respective local outputs are divided to get the predictions.
Fig -3: Generalized Regression Neural Network
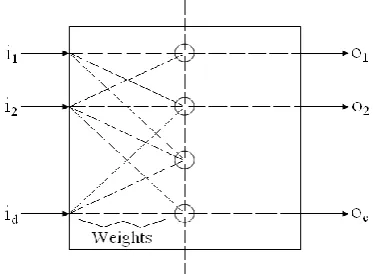
2.3 Linear Layer (LL) Neural Network
Linear layer neural networks are the structures formed by considering linear units, i.e., units with an input/output (I/O) mapping that is linear. These units are important for several reasons:
1. They allow visualization of mappings.
2. They allow simplified analysis using techniques from linear algebra and geometry.
3. They have a rich history.
4. They provide a starting place for consideration of nonlinear units.
5. In themselves, they provide many useful mappings.
Each artificial neuron input has an associated weight indicating the strength of its connection with either an external input or another neuron output. w ij represents the strength of the connection to neuron unit i from (either) neuron unit j or input j.
[image:2.595.330.517.526.663.2]© 2017, IRJET | Impact Factor value: 5.181 | ISO 9001:2008 Certified Journal | Page 1272
[image:3.595.61.268.129.309.2]3. MODEL VALIDATION
Fig -5: TRUSS 1
[image:3.595.312.567.334.485.2]Truss 1 consists of vertically downward load of 10KN at the top, young’s modulus is 200KN/mm2, cross-sectional area of each leg is 2000mm2. Height is 5m.
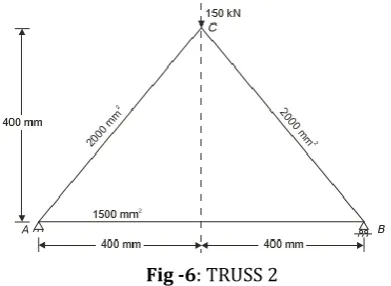
Fig -6: TRUSS 2
Truss 2 consists of vertically downward load of 150KN at the top, modulus of elasticity is 200GPA. Cross- sectional area of diagonal legs is 2000 mm2 and bottom leg is 1500mm2, height is 400mm and length is 800mm.
Fig -7: TRUSS 3
Truss 3 consists of vertical downward load of 150KN at the top and horizontal load of 100KN, young’s modulus is 200GPA. Cross- sectional area of diagonal legs is 2000 mm2 and other legs with cross-sectional area of 1000mm2, height is 3000mm and length is 4000mm.
4. ANALYSIS OF TRUSSES
4.1. TRUSS 1 – Results Of Spread Constants on the
Performance of GR & RBF Neural Networks
ANNs are trained for various heights varying from 5m to 10m with values 5, 6, 7, 8, 9, 10m. These ANNs are interpolated for heights varying from 5.25m to 9.75m with several values such as 5.25, 5.75, 6.25, 6.75, 7.25, 7.75, 8.25, 8.75, 9.25, 9.75m. These ANNs are tested for spread constants varrying from 0.7, 0.8, 0.9, 1.0, 2.0 & 3.0. The percentage error is calculated for these spread constants in case GR & RBF neural networks for interpolation.
0 1 2 3 4 5
S.C(0.7) S.C(0.8) S.C(0.9) S.C(1) S.C(2) S.C(3)
Chart -1: Percentage error for F1
0 1 2 3 4 5
S.C(0.7) S.C(0.8) S.C(0.9) S.C(1) S.C(2) S.C(3)
[image:3.595.55.251.386.529.2]© 2017, IRJET | Impact Factor value: 5.181 | ISO 9001:2008 Certified Journal | Page 1273 0
1 2 3 4 5
S.C(0.7) S.C(0.8) S.C(0.9) S.C(1) S.C(2) S.C(3)
Chart -3: Percentage error for F1
0 1 2 3 4 5
S.C(0.7) S.C(0.8) S.C(0.9) S.C(1) S.C(2) S.C(3)
4.2. TRUSS 1 – Results Of Number Of Trainings On
The Performance Of ANNs
ANNs are trained and tested for heights varying from 5m to 10m with values 5, 6, 7, 8, 9, 10m. These ANNs are tested and analyzed for both interpolation and extrapolation for set of heights varying from 4m to 11m with values 4, 4.5, 5.25, 5.75, 6.25, 7.25, 7.75, 8.25, 8.75, 9.25, 9.75, 10.5, 11m. The percentage error is calculated.
0 0.5 1 1.52 2.53 3.5 4 4.5 5 5.5
F1 F2=F3 F1 F2=F3
G.R
R.B.F
L.L
Chart -5: Percentage error for F1, F2 & F3
4.3. TRUSS 1- Effect of Number of Output Variables
on the Performance of ANNs
The ANNs are built to find the force in each member of the truss and the displacement in X, Y – direction. i.e., number of output variables have been increased. ANNs are trained and tested for heights varying from 5m to 10m with values 5, 6, 7, 8, 9, 10m and tested for the same set of heights. The percentage error is calculated.
0 1 2 3 4 5 6 7 8
G.R
R.B.F
L.L
Chart -6: Percentage error for F1, F2, F3 & Displacement in X & Y direction
4.4. TRUSS1 - Effect Of Number Of Trainings On The
Performance Of ANNs (When The Number Of
Output Variables Are Increased)
The ANNs are built to find the force in each member of the truss and the displacement in X, Y – direction. i.e., number of output variables have been increased. ANNs are trained and tested for heights varying from 5m to 10m with values 5, 5.5, 6, 6.5, 7, 7.5, 8, 8.5, 9, 9.5, 10m and tested and analyzed for the same set of heights. The percentage error is been found.
4.5. TRUSS 2- Effect Of Number Of Trainings On The
Performance Of ANNs
ANNs are trained for various heights varying from 0.4m to 1.0m with values 0.4, 0.5, 0.6, 0.7, 0.8, 0.9, 1.0m. These ANNs are tested for both interpolation and extrapolation for heights ranging from 0.3m to 1.1m for values 0.3, 0.35, 0.425, 0.475, 0.525, 0.575, 0.625, 0.675, 0.725, 0.775, 0.825, 0.875, 0.925, 0.975, 1.05 and 1.10m. The percentage error is calculated.
© 2017, IRJET | Impact Factor value: 5.181 | ISO 9001:2008 Certified Journal | Page 1274 0
10 20 30 40 50 60
F1 F2=F3 F1 F2=F3
G.R
R.B.F
L.L
Chart -7: Percentage error for F1, F2 & F3
4.6. TRUSS 2- Effect Of Number Of Input Variables
On The Performance Of ANNs
ANNs are built to find the force in each member of the truss and spans. i.e., number of input variables have been increased. ANNs are trained and tested for heights varying from 0.4m to 1.0m with values 0.4, 0.5, 0.6, 0.7, 0.8, 0.9, 1.0 m and spans varying from 0.8m to 1.4m with the values 0.8, 0.9, 1.0, 1.1, 1.2, 1.3, 1.4 m. These ANNs is tested and analyzed for the same set of heights as in tables 4.21 and spans varying from 0.7m to 1.5m with values 0.7, 0.75, 0.825, 0.875, 0.925, 0.975, 1.025, 1.075, 1.125, 1.175, 1.225, 1.275, 1.325, 1.375, 1.45, 1.5 m. The percentage error is been found.
0 5 10 15 20 25
F1 F2=F3 F1 F2=F3
G.R
R.B.F
L.L
Chart -8: Percentage error for F1, F2 & F3
4.7. TRUSS 3 - Effect Of 2X2 Matrix Form Training
On The Performance Of ANNs
The ANNs are built up to find the force in each member of the truss for various spans and heights. The ANNs are trained and tested for spans ranging from 4m to 8m with values 4m and 8m and heights ranging from 3m to 7m with values 3m and 7m. These ANNs are tested only for interpolation for a set of spans and heights.
0 5 10 15 20 25 30 35
F1 F2 F3 F4 F5 F6
G.R
R.B.F
L.L
Chart -9: Percentage error for F1, F2, F3, F4, F5, F6
4.8. TRUSS 3 - Effect Of 3X3 Matrix Form Training
On The Performance Of ANNs
ANNs are built up to find the force in each member of the truss for various spans and heights. The ANNs are trained and tested in 3 x 3 matrix form i.e ANNs is tested for spans ranging from 4m to 8m with values 4m, 6m, 8m and heights ranging from 3m to 7m with values 3m, 5m, 7m. These ANNs are tested only for interpolation for a set of spans and heights.
4.9. TRUSS 3 - Effect Of 4X4 Matrix Form Training
On The Performance Of ANNs
ANNs are built up to find the force in each member of the truss for various spans and heights. The ANNs are trained and tested in 4 x 4 matrix form i.e ANNs is tested for spans ranging from 4m to 8m with values 4, 5.34, 6.68, 8m and heights ranging from 3m to 7m with values 3, 4.34, 5.68, 7m. These ANNs are tested only for interpolation for a set of spans and heights.
4.10. TRUSS 3 - Effect Of 3X3 Matrix Form Training
On The Performance Of ANNs
ANNs are built up to find the force in each member of the truss for various spans and heights. The ANNs are trained and tested in 5 x 5 matrix form i.e ANNs is tested for spans ranging from 4m to 8m with values 4, 5, 6, 7, 8m and heights ranging from 3m to 7m with values 3, 4, 5, 6, 7m. These ANNs are tested only for interpolation for a set of spans and heights.
4.11. TRUSS 3 – Effect Of Enlargement In The
Quantity Of Input Variables On The Results Of ANNs
© 2017, IRJET | Impact Factor value: 5.181 | ISO 9001:2008 Certified Journal | Page 1275 cross sectional area bottom member, A3 = cross-section area
of vertical members & A4 = cross- section area diagonal members. Now, the ANNs are trained and tested for the spans 4m, 8m, heights 3m, 7m, cross-sectional area of top member 600mm2, 850mm2, cross-sectional area of bottom member 150mm2, 300mm2, cross-sectional area of diagonal members 400mm2, 650mm2. i.e., the ANNs are trained in the 2x2x2x2x2x2 matrix form.
5. CONCLUSIONS
As per the analysis on the results of GR, RBF and LL neural networks the following conclusions are obtained.
Extrapolation should not be taken into
consideration in GR, RBF, and LL neural networks. Taking in account interpolation, the results of GR,
RBF is reduced as the spread constant is increased.
In interpolation, the results of RBF is excellent as compare to GR. GR shows excellent results for the values away from trained end values. RBF and LL shows good performance for all analyzed values. When ANNs are trained, analyzed and tested for
large number of values, there is little improvement in the results of ANNs.
ANNs remains constant even if output variables are increased.
If the output variables are increased there is very much improvement in the result of ANNs.
If the input variables are increased there is reduction in results of ANNs.
Taking into consideration matrix form training results of RBF is better than GR and LL and GR shows better results than LL or vice-versa. As number of trainings are increased there is improvement in the results of ANNs.
RBF proves to be deprived for large number of trainings and input variables.
Results of GR and LL is reduced as there is increase in number of input variables.
REFERENCES
[1] Adeli, H. and Park, H.S., “Counter propagation neural
networks in structural engineering”, ASCE Journal Of Structural Engineering, August 1995, pp. 1205-1212.
[2] Kaveh, A. and Servati, H., “Design of double layer grids
using back propagation neural networks”, Journal of Computers and Structures,February 2001, Vol.79, pp. 1561-1568.
[3] Adhikary, B.B. and Mutsuyoshi, H., “Artificial neural
networks for the prediction of steel plate strengthened RC beams”, Journal of Construction and Building Materials, march 2004, Vol. 18, pp. 409-417.
[4] Hadi, M.N.S., “Neural Networks applications in concrete
structures”, Journal of computers and structures, 2003, Vol. 81, pp. 373-381.
[5] Yeh, I.C., “Modelling of strength of high-performance
concrete using artificial neural networks”, Journal of Cement and Concrete Research, September 1998, Vol. 28, pp. 1797-1808.
[6] Raju , K.R., “Creation of knowledge base for design of
steel compression members in towers / trusses using artificial neural networks”, Journal of Structural Engineering, March 2004, Vol.30, pp. 247-257.
[7] Nagaradjane, V., Rajasekaran, A., Raghunath, P.N.,
Suguna, K., “ANN model for the effect of slenderness on concentrically loaded concrete cylinders confined by GFRP”, The Indian Concrete Journal, Juuly 2007, pp. 43-50.
[8] Bhavikatti, S.S., “Finite Element Analysis”, New Age