© 2017, IRJET | Impact Factor value: 5.181 | ISO 9001:2008 Certified Journal
| Page 685
Prediction of Dengue, Diabetes and Swine Flu Using Random Forest
Classification Algorithm
Amit Tate
1, Ujwala Gavhane
2, Jayanand Pawar
3, Bajrang Rajpurohit
4, Gopal B. Deshmukh
51,2,3,4
UG Student, M.E.S. College of Engineering, Pune, SPPU
5
Deparent of Computer Engineering, M.E.S. College of Engineering, Pune, SPPU
---***---
Abstract: - In this article we proposed disease predictionsystem using Random Forest Algorithm (RFA). Training dataset is used for prediction of particular disease. The main aim of this article is that to predict the disease which input symptoms is taken from patient or user. Recommend a specialized doctor for particular disease if result positive. Our algorithms are extendible to deal with mobile/online solutions to support patients as well for medical diagnostics. As a first step, we also developed web-based interfaces to support patients in calculating risk level for each medical case.
Keywords: - Random Forest Algorithm (RFA), Machine Learning, Out-Of-Bag (OOB).
1. INTRODUCTION
Supervised learning is part of Machine learning that consist training dataset which is labelled. In proposed system with the help of supervised learning we can predict the class label which from user input. Disease prediction has become important in a variety of applications such as health insurance, tailored health communication and public health. Disease prediction is usually performed using publicly available datasets.
Disease involved in prediction system as following
A. Swine Flu B. Diabetes C. Dengue
Swine flu is a respiratory disease caused by influenza viruses that infect the respiratory tract of pigs and result in a barking cough, decreased appetite, nasal secretions, and listless behavior; the virus can be transmitted to humans.
Diabetes is a number of diseases that involve problems with the hormone insulin. Normally, the pancreas (an organ behind the stomach) releases insulin to help your body store and use the sugar and fat from the food you eat.
Dengue fever is a painful, debilitating mosquito-borne disease caused by any one of four closely related dengue viruses. These viruses are related to the viruses that cause West Nile infection and yellow fever.
Disease prediction using Random forest algorithm is proposed for Dengue, Diabetes and Swine Flu diseases. Training dataset is given for predict the particular disease. Training dataset for each disease is described in III section.
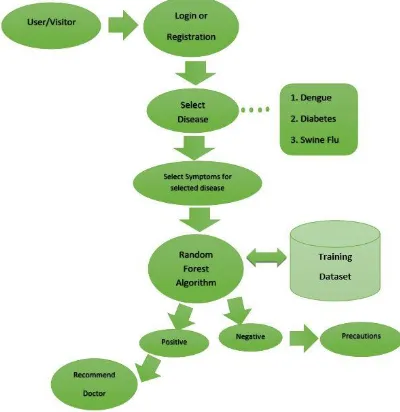
Fig -1:Proposed system for disease prediction system using Random Forest Algorithm.
In fig 1 contains detailed description of proposed disease
[image:1.595.338.538.360.566.2]© 2017, IRJET | Impact Factor value: 5.181 | ISO 9001:2008 Certified Journal
| Page 686
Positive result, then system should shows recommend doctor for those disease and user details sent to specialized doctor for that particular disease. Patients can make appointment directly through recommendation system. Doctor will response back to patient quickly. If system gives to user negative result, then system should show precautions for those disease.
2. RELATED WORK
Author introduced classification algorithms used for disease prediction and comparison of each algorithm is described in details with graph analysis such as Prediction time, Recall, Precision, TP (True Positive) rate, FP (False Positive) rate. [1]. Here our system is using Random forest algorithm because author introduced this algorithm is best for disease prediction. [1]
The Random Forest approach offers the highest accurateness rate reaching 99.9% with 9 measured factors after the reduction step. In this paper, author describes four case studies from the Lebanese health domain, Acute Appendicitis (AP), Premature Birth (PB), Coronary Heart Disease (CHD), and Osteoporosis Disease (OD). For these applications, prediction systems were developed for decision support using data mining techniques. [2]
In this paper, author proposed a model based on four years’ medical analysis data to predict the change possibility of the coming year’s FBG (Fasting blood glucose). Based on four years’ historic medical examination data, a prediction model of coming year’s FBG is offered using traditional data mining techniques with Random forest algorithm and SVM (Support Vector Algorithm). [3]
3. PROPOSED SYSTEM
Proposed system is Disease prediction system which can predict the disease with the help of training dataset and user input.
Proposed system includes the Patient healthcare, Disease prediction (Dengue, Diabetes, and Swine flu), Doctor Recommendation for particular disease, Precaution for disease, Doctor details for when patients need to contact them directly, Make an appointment with specialized doctor.
Disease prediction means that user will gives some input to our system in the form of yes or no for symptoms of particular disease and this system will proceed on that given symptoms. Finally predict the accurate disease using
training dataset and given input. Random forest will proceed on that given symptoms and predict the accurate output.
4. TECHNOLOGY OVERVIEW
Random Forest algorithm are an ensemble supervised learning method which is used as predictor of data for classification and regression. In the classification process algorithm build a number of decision trees at training time and construct the class that is the mode of the classes output by using each single tree. (Random Forests is introduced by Leo Breiman and Adele Cutler for an ensemble of decision trees). [5]
Random Forest algorithm is a grouping of tree predictors where each tree based on the values of a random vector experimented independently with the equal distribution for all trees in the forest. The basic principle is that a group of “weak learners” can come together to form a “strong learner”. Random Forests are a perfect tool for making predictions considering they do not over fit. Presenting the accurate kind of randomness makes them accurate classifiers and regression. [5]
Single decision trees often have high variance or high bias. Random Forests trying to moderate the high variance problems and high bias by averaging to find a natural balance between the two extremes. Considering that Random Forests have few parameters to tune and can be used simply with default parameter settings, they are a simple tool to use without having a model or to produce a reasonable model fast and efficiently.
Random Forests are easy to learn and use for both professionals and lay people - with little research and programming required and may be used by folks without a strong statistical background. Simply put, you can safely make more accurate predictions without most basic mistakes common to other methods.
Random Forests produces several classifications for given trees. Each tree is grown as follows:
1. If number of circumstances in the training data set is D, sample D cases at random state but with replacement, from the original dataset. This sample testing set will be the training set for increasing the tree.
© 2017, IRJET | Impact Factor value: 5.181 | ISO 9001:2008 Certified Journal
| Page 687
variables are selected at random available for the and the best splitting on these is used to splitting the node. The value of is used as constant during entire the forest growing.
3. Each tree is grown to the largest size as possible. There is no pruning an overall grownup tree.
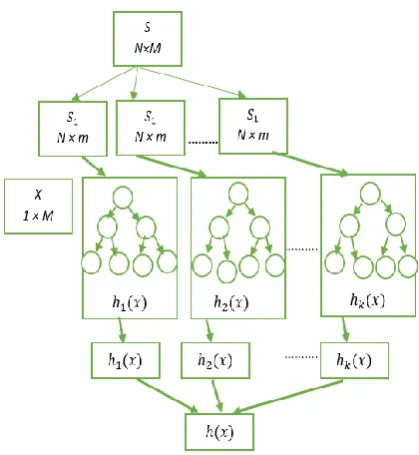
[image:3.595.52.262.348.576.2]The random forest algorithm is an ensemble classifier algorithm based on the decision tree model. It generates k different training data subsets from an original dataset using a bootstrap sampling approach, and then, k decision trees are built by training these subsets. A random forest is finally constructed from these decision trees. Each sample of the testing dataset is predicted by all decision trees, and the final classification result is returned depending on the votes of these trees. [11]
Fig 2. Process of the construction of the RF algorithm
The original training dataset is formalized as
S = {(ai, bj), i = 1, 2... D; j = 1, 2... },
Where A is a sample and b is a feature variable of S. Namely, the original training dataset contains D samples, and there are feature variables in each sample.
The main process of the construction of the RF algorithm is presented in Fig. 2[1]
The steps of the construction of the random forest algorithm are as follows:
Step 1. Sampling k training subsets.
In the first step, k training datasets are experimented from the original training dataset S in a bootstrap selection manner. Namely, N records are selected from S by a random sampling and replacement method in each sampling time. After the current step, k training subsets are constructed as a collection of training subsets S Train:
S Train = {S1, S2…….Sk}.
At the same time, the records that are not to be selected in each sampling period are composed as an Out-Of-Bag (OOB) dataset.
In this way, k OOB sets are constructed as a collection of SOOB:
SOOB = {OOB1, OOB2... OOBk},
Where k ≪ N, Si ∩ OOBi = ϕ and Si ∪ OOBi = S.
To obtain the classification accuracy of each tree model, these OOB sets are used as testing sets after the training process. [1]
Step 2. Constructing each decision tree model.
In an RF model, each Meta decision tree is created by a C4.5 or CART algorithm from each training subset Si. In the growth process of each tree, m feature variables of dataset Si are randomly selected from M variables. In each tree node’s dividing process is done, then gain ratio of each feature variable is computed, and the best one or most priority node is chosen as the splitting node. This splitting process is repeated until a leaf node is generated. Finally, k decision trees are trained from k training subsets in the same way. [1]
Step 3. Collecting k trees into an RF model.
The k trained trees are collected into an RF model, which is defined in Eq. (1):
© 2017, IRJET | Impact Factor value: 5.181 | ISO 9001:2008 Certified Journal
| Page 688
5. HOW IT WORKProposed system disease prediction system fully based on training dataset. If dataset incorrect then output could be wrong. In table no 1, described symptoms of Swine flu. In
table no 3, described symptoms of Diabetes. In table no 5,
described symptoms of Dengue.
E.g. In table no 2 user inputs are all yes for all symptoms or any input some of them is yes and some of them is no. If user select the yes for all symptoms, then result should be positive and if user select the no for all symptoms then result should be negative. Input from user can multiple possibilities such as some input could be yes and some input could be no. After that Random forest algorithm will proceed on user input and using training dataset will predict the output as Positive or Negative.
If output is positive, then specialized doctor will display on same page. Patient can make an appointment directly with specialized doctor for particular disease. Predicted result is positive then Patients details will have sent to particular doctor which is specialize in that disease.
If output is negative, then precaution of that disease will display on same page. Patient can make use of online healthcare for another disease also. Healthcare include the main disease which spread over population quickly.
Table -1: Symptoms of swine flu disease
Symptoms for Swine Flu Disease
1. Chills 2. Fever 3. Coughing 4. Sore Throat 5. Fatigue 6. Nausea 7. Vomiting 8. Diarrhea 9. Runny Nose 10. Stuffy Nose 11. Body Aches
Table - 2: Default user input for positive or negative output for swine flu
Input from user Result
yes, yes, yes, yes, yes, yes,
yes, yes, yes, yes, yes Positive no, no, no, no, no, no
no, no, no, no, no Negative
In table no 2, user input can be all yes and can be no for each symptom or can be some Yes and can be some No depend on what patient gives input. We mentioned here only two test cases for predict result first one is if user select yes for all symptoms and second is user select no for all symptoms. We need more training dataset to predict accurate output which is not mentioned in this article but another training dataset is used in proposed system.
Table - 3: Symptoms of diabetes disease
Symptoms for Diabetes Disease
1. Heavy thirst 2. Increased hunger 3. Dry mouth 4. Pain in belly 5. Fatigue 6. Nausea 7. Vomiting
8. Frequent urination 9. Unexplained weight
loss
10. Blurred vision 11. Heavy laboured
breathing
Table – 4: Default user input for positive or negative output for diabetes disease
Input from user Result
yes, yes, yes, yes, yes, yes,
yes, yes, yes, yes, yes Positive no, no, no, no, no, no
no, no, no, no, no Negative
Table -5: Symptoms of dengue disease
Symptoms for Dengue
1. Sudden high fever 2. Severe headaches 3. Severe joint and
muscle pain 4. Pain behind the eye 5. Fatigue
6. Nausea 7. Vomiting 8. Skin rash which
appears two to five days after the onset of fever
© 2017, IRJET | Impact Factor value: 5.181 | ISO 9001:2008 Certified Journal
| Page 689
Table -6: Default user input for positive or negativeoutput for dengue
Input from user Result yes, yes, yes, yes, yes, yes, yes, yes,
yes Positive
no, no, no, no, no, no
no, no, no Negative
System architecture of disease prediction system using Random Forest Algorithm described in fig 1. Classification process of disease prediction described below fig no 1. In this process user input and training dataset is compared.
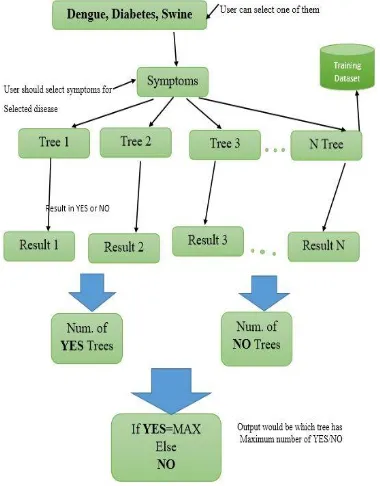
In Fig, no 1 User input will proceed using Random forest algorithm. RFA will generates the maximum number of trees with help of given training dataset and the output is in the form of Yes (Positive prediction) or No (Negative Prediction). Each tree would have single output. Fig no 3 Contains tree 1, tree 2…. tree N will have separate result. Result 1, Result 2…. Result N shows you result of given symptoms which is calculated by tree’s using training dataset in the form of Yes or No. Finally, Result is combined in two categories Yes or No, which tree has maximum number of Yes or No this result will show the final output as if Maximum tree is Yes then result should be Positive and if Maximum tree is No then result should be Negative.
Fig -3: System architecture for disease prediction system
6. RESULTS
In table no 1, symptoms of swine flu are given. Using these symptoms disease prediction system will predict result with help of user input. Swine flu output in case of positive result. In table no 2, two cases of swine flu are given for positive and negative result. Positive result should display in case of only input is Yes from user probably greater than No. Fig 4 and fig 5 contains positive and negative result respectively.
Fig -4: swine flu positive result
Negative result should display in case of only input is No from user probably greater than Yes.
Fig -5: swine flu negative result
In table no 3, symptoms of diabetes are given. In table no 4, two cases of diabetes are given for positive and negative result. Fig 6 and fig 7 contains positive and negative result of diabetes respectively.
[image:5.595.89.279.487.730.2]© 2017, IRJET | Impact Factor value: 5.181 | ISO 9001:2008 Certified Journal
| Page 690
Fig -7: Diabetes Negative ResultIn table no 5, symptoms of dengue are given. In table no 6, two cases of dengue are given for positive and negative result. Fig 6 and fig 7 contains positive and negative result of dengue respectively.
Fig -8: Dengue Positive Result
Fig -9: Dengue Negative Result
7. CONCLUSION
In proposed Disease prediction system can predict particular disease using training dataset. In this article, we proposed disease prediction system as web/mobile based online application for patient’s healthcare. Random forest algorithm maintains best accuracy as compare to others classification system. After result predict the disease, then recommendation system will work on their predicted disease. If positive result show to user, then recommended doctor will display on same page. If negative result, then precautions for same disease will display.
Reference
[1] Amit Tate, Bajrangsingh Rajpurohit, Jayanand Pawar, Ujwala Gavhane,Gopal B. Deshmukh."Comparative Analysis of Classification Algorithms Used for Disease Prediction in Data Minin" Vol. 2 - Issue 6 (Nov - Dec 2016), International Journal of Engineering and Techniques (IJET), ISSN: 2395 - 1303, www.ijetjournal.org.
[2] Ahmad Shahin, Walid Moudani, Fadi Chakik, Mohamad Khalil “Data Mining in Healthcare Information Systems: Case Studies in Northern Lebanon” Doctoral School for Science and Technology The Lebanese University Tripoli, Lebanon.
[3] Wenxiang Xiao, Jun Ji, Fengjing Shao* , Rencheng Sun, Chunxiao Xing on “Fasting Blood Glucose Change Prediction Model Based on Medical Examination Data and Data Mining Techniques” 2015 IEEE International Conference on Smart City/ Social Com /Sustain Com together with Data Com 2015 and SC2 2015
[4] Mihail Popescu ; Mohammad Khalilia “Improving disease prediction using ICD-9 ontological features” Fuzzy Systems (FUZZ), 2011 IEEE International Conference on June 2011.
[5] http://www.datasciencecentral.com/profiles/blo gs/random-forests-algorithm.
[6] Asmaa S. Hussein; Wail M. Omar; Xue Li ; Modafar Ati “Efficient Chronic Disease Diagnosis prediction and recommendation system. Biomedical Engineering and Sciences (IECBES), 2012 IEEE EMBS Conference.
[7] April Morton ; Eman Marzban ; Georgios Giannoulis ; Ayush Patel ; Rajender Aparasu ; Ioannis A. Kakadiaris “A Comparison of Supervised Machine Learning Techniques for Predicting Short-Term In-Hospital Length of Stay among Diabetic Patients” Machine Learning and Applications (ICMLA), 2014 13th International Conference on Dec. 2014(IEEE).