ScholarWorks @ Georgia State University
ScholarWorks @ Georgia State University
Physics and Astronomy Theses Department of Physics and Astronomy
Summer 8-7-2012
Time Resolved Absorption Spectroscopy for the Study of Electron
Time Resolved Absorption Spectroscopy for the Study of Electron
Transfer Processes in Photosynthetic Systems
Transfer Processes in Photosynthetic Systems
Hiroki Makita
Georgia State University
Follow this and additional works at: https://scholarworks.gsu.edu/phy_astr_theses
Recommended Citation Recommended Citation
Makita, Hiroki, "Time Resolved Absorption Spectroscopy for the Study of Electron Transfer Processes in Photosynthetic Systems." Thesis, Georgia State University, 2012.
https://scholarworks.gsu.edu/phy_astr_theses/16
This Thesis is brought to you for free and open access by the Department of Physics and Astronomy at
ScholarWorks @ Georgia State University. It has been accepted for inclusion in Physics and Astronomy Theses by an authorized administrator of ScholarWorks @ Georgia State University. For more information, please contact
TIME RESOLVED ABSORPTION SPECTROSCOPY FOR THE STUDY OF ELECTRON
TRANSFER PROCESSES IN PHOTOSYNTHETIC SYSTEMS
by
HIROKI MAKITA
Under the Direction of Professor Gary Hastings
ABSTRACT
Transient absorption spectroscopy was used to study light induced electron transfer
processes in Type 1 photosynthetic reaction centers. Flash induced absorption changes were
probed at 800, 703 and 487 nm, and on multiple timescales from nanoseconds to tens of
milliseconds. Both wild type and menB mutant photosystem I reaction centers from the
cyanobacterium Synechocystis sp. PCC 6803 were studied. Photosystem I reaction centers from
the green algae Chlamydomonas reinhardtii, and the newly discovered chlorophyll-d containing
organism Acaryochloris marina, were also studied.
The flash induced absorption changes obtained for menB mutant photosystem I reaction
centers are distinguishable from wild type at 800 nm. MenB mutant photosystem I reaction
centers displays a large amplitude decay phase with lifetime of ~50 ns which is absent in wild
type photosystem I reaction centers. It is hypothesized that this ~50 ns phase is due to the
formation of the triplet state of primary electron donor.
INDEX WORDS: Photosynthesis, Photosystem I, P700, Laser flash photolysis, Pump-probe spectroscopy, Synechocystis sp. PCC 6803, menB, Chlamydomonas reinhardtii,P740,
TIME RESOLVED ABSORPTION SPECTROSCOPY FOR THE STUDY OF ELECTRON
TRANSFER PROCESSES IN PHOTOSYNTHETIC SYSTEMS
by
HIROKI MAKITA
A Thesis Submitted in Partial Fulfillment of the Requirements for the Degree of
Master of Science
in the College of Arts and Sciences
Georgia State University
Copyright by Hiroki Makita
TIME RESOLVED ABSORPTION SPECTROSCOPY FOR THE STUDY OF ELECTRON
TRANSFER PROCESSES IN PHOTOSYNTHETIC SYSTEMS
by
HIROKI MAKITA
Committee Chair: Gary Hastings
Committee: Vadym Apalkov
Gennady Cymbalyuk
Mukesh Dhamala
Electronic Version Approved:
Office of Graduate Studies
College of Arts and Sciences
Georgia State University
ACKNOWLEDGEMENTS
First of all, I would like to express my gratitude to my advisor, Dr. Gary Hastings, for his
patience and understanding. Without his support and guidance, this thesis would not have been
possible.
I would like to thank my thesis committee members, Dr. Vadym Apalkov, Dr. Gennady
Cymbalyuk, and Dr. Mukesh Dhamala for their time and support. My gratitude also goes to my
lab mates, Nan Zhao and Dr. Hari Lamichhane, for their helpful suggestions.
Finally, I would like to thank the late Dr. William H. Nelson, who was my first scientific
TABLE OF CONTENTS
ACKNOWLEDGEMENTS ... iv
LIST OF TABLES ... viii
LIST OF FIGURES ... ix
1 INTRODUCTION ... 1
1.1 Photosynthesis... 1
1.2 The Light Reactions ... 2
1.3 Structure of Photosystem I ... 3
1.4 Electron Transfer in Photosystem I ... 7
1.4.1 Techniques and Methods for Studying Electron Transfer ... 7
1.4.2 Kinetics of Electron Transfer in Photosystem I ... 8
1.5 Directionality of Electron Transfer in Photosystem I ... 10
1.6 Mutant Photosystem I ... 12
1.7 Chlorophyll-d containing Photosystem I ... 14
2 TIME RESOLVED OPTICAL ABSORPTION SPECTROSCOPY ... 16
2.1 Laser Flash Photolysis ... 16
2.2 Laser Flash Photolysis Spectrometer ... 17
2.3 Optical Densities ... 18
2.3.1 Calculation of Optical Densities ... 18
2.4.1 First Order Decays ... 22
2.4.2 Pseudo-first Order Decays ... 23
2.4.3 Second Order Decays ... 24
2.5 Pump-Probe Spectroscopy on Photosystem I Kinetics ... 24
3 EXPERIMENTAL DETAILS ... 29
3.1 Pump-Probe Spectrometer ... 29
3.1.1 Probe Light Source ... 30
3.1.2 Pulser Unit ... 30
3.1.3 Spectrometer Controller ... 31
3.1.4 Monochromator ... 32
3.1.5 Photomultiplier Detector ... 33
3.1.6 Oscilloscope ... 33
3.1.7 Sample Compartment ... 33
3.1.8 Laser... 35
3.1.9 Software ... 35
3.2 Investigated Samples ... 36
4 SAMPLE ABSORPTION SPECTRA ... 38
6 NANOSECOND ABSORPTION CHANGES TO DISTINGUISH WT AND
MENB MUTANT PSI PARTICLES. ... 46
7 FORWARD ELECTRON TRANSFER FROM A1 TO FX IN WT AND MENB MUTANT PSI... 54
8 REPLACING PLASTOQUINONE WITH PHYLLOQUIONE IN MENB PSI. 58 9 STUDY OF GREEN ALGAL PSI PARTICLES FROM CHLAMMYDOMONAS REINHARDTII. ... 62
10 STUDY OF CHLOROPHYLL-D CONTAINING PSI PARTICLES FROM ACARYOCHLORIS MARINA ... 64
11 METHODS OF SELECTING PROBE LIGHT WAVELENGTH ... 67
12 CONCLUSIONS ... 69
LIST OF TABLES
Table 2.1 A summary of some of the reported time constants. All the constants are the
mean-lifetime. The lifetimes of two phases of the forward electron transfer from A1 and the P700+
charge recombination kinetics are reported. The state of the PSI, whether particle or whole cells,
are also noted. ... 28
Table 5.1 Summary of calculated lifetimes obtained by fitting the kinetic data at 703 nm for
menB PSI particles. The kinetics are associated with P700+ charge recombination. ... 45
Table 10.1 Summary of calculated lifetimes obtained by fitting the kinetic data at 703 nm for
menB PSI particles. The kinetics are associated with P700+ charge recombination. ... 65
LIST OF FIGURES
Figure 1.1 Simple schematic showing the overall photosynthetic process in a plant ... 1
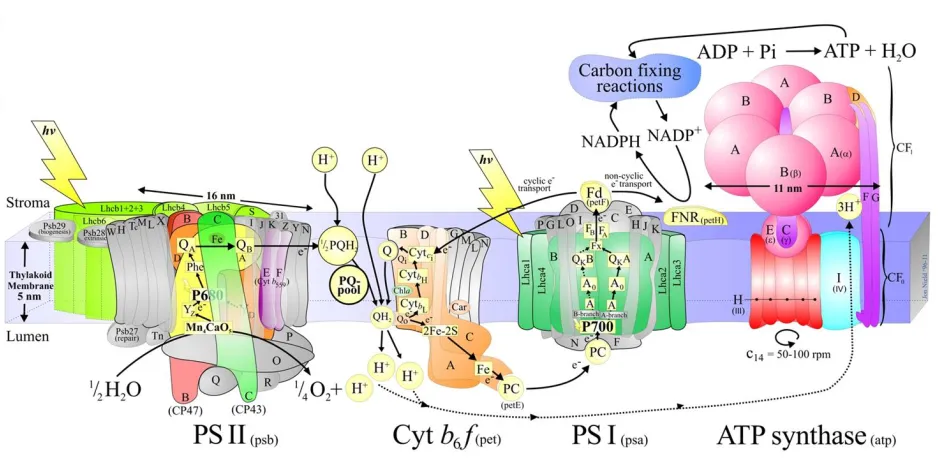
Figure 1.2 A detailed schematic model of the higher plant / green algal thylakoid membrane
with major protein complexes involved in oxygenic photosynthesis. Taken from
http://www.photosynthesis.sbcs.qmul.ac.uk/nield/psIIimages/oxygenicphotosynthmodel.html [1]
... 3
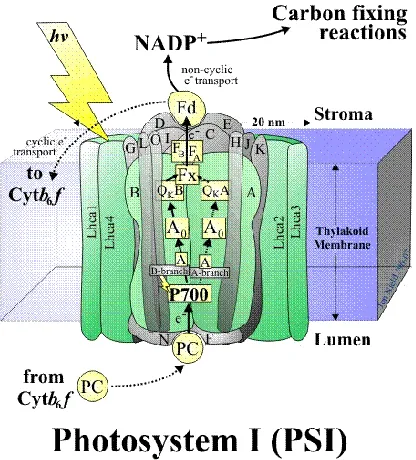
Figure 1.3 A schematic depicting the architecture of the PSI core complex embedded in the
thylakoid membrane. The possible routes of electron transfer are shown with arrows. The
subunits are labeled with alphabets. Taken from
http://www.photosynthesis.sbcs.qmul.ac.uk/nield/psIIimages/PSI.html [3] ... 4
Figure 1.4 Structural arrangement of electron acceptor and donors involved in electron transfer
in PSI [4] ... 6
Figure 1.5 a) Chemical structure of phylloquinone (Vitamin K1) which serves as the secondary
electron acceptor at A1 site. b) Chemical structure of chlorophyll-a molecule. Chlorophyll-a’,
one component of the heterodimer P700, is the 132 epimer of chlorophyll-a. Chlorophyll-a’ has
a flipped project ion of 133 carbon from the 132 carbon ... 6
Figure 1.6 The kinetics of electron transfer in PSI [6]. The various radical pair states and the
redox properties are plotted relative to the approximated standard free energies. The standard
free energy of P700 was arbitrarily set to zero. ... 9
Figure 1.7 a) The biosynthetic pathway of phylloquinone [23]. In menB mutants, the
MenB/sll1127 gene is mutated. The mutation inhibits the production of naphthoate synthase,
inhibiting the production of phylloquinone. b) Chemical structure of plastoquinone-9. ... 13
Figure 2.1 A schematic drawing of LP920 laser flash photolysis spectrometer. ... 17
Figure 2.2 a) Raw data consists of transient (red) and probe background (black). b) Calculated
from the transient and probe background in a). Even when the pulse profile is not stable,
probe background can take into account the fluctuations.
... 20
Figure 2.3 a) Raw data consists of transient (black) and fluorescent background (red). b)
Calculated from the transient and fluorescent background in a). Peaks observed in raw data,
both in transient and fluorescent background, are the contributions by fluorescence.
... 21
Figure 2.4 a) Raw data consists of transient (red), probe background (black), and fluorescent
background (blue). b) Calculated from the transient with fluorescent and probe background
subtracted. Both the fluorescent contributions and the probe pulse drift are taken in account by
having both backgrounds subtracted in calculation of . The disadvantage is the reduced
signal-to-noise ratio. ... 21
Figure 3.1 LP920 laser flash photolysis spectrometer. ... 29
Figure 3.2 A typical optical pulse profile of xenon flashlamp, Xe920, pulsed by the pulser unit
XP920. The pulse in this figure is set to be 10 ms in width and is fired at 16 Hz. The trace is an
average of 160 measurements. In an actual measurement of kinetics, a position of the pulse with
the least drift in the specified time range is chosen as the time window of the measurement. In
addition to the repetition rate, width (duration) of the pulse, height (voltage) of the pulse can
directly be adjusted by changing current. ... 31
Figure 3.3 A schematic drawing of a monochromator TMc300. Taken from reference [29]. .... 32
Figure 4.1 Absorption spectra of wild type (black) and menB mutant PSI (red) particles from
Synechocystis sp. PCC 6803.The spectra were normalized to an OD = 1.5 at 680 nm. ... 39
Figure 4.2 Averaged absorption spectrum of wild-type PSI particles from Acaryochloris marina
(black) and Chlamydomonas reinhardtii (red) normalized to OD = 1.5 at 703 nm and 678 nm
respectively. ... 39
Figure 5.1 Absorption changes at 703 nm, following 532 nm excitation of WT PSI particles.
Absorption changes were probed on a) 10 µs, b) 100 µs, and c) 4 ms time scales. The trace in c)
was fitted by a single exponential function, the result of the fitting is shown (red). The data
shown in b) and c) are averages of multiple sets of 640 measurements. The trace in a) is the
average of 640 measurements. ... 42
Figure 5.2 Absorption changes at 703 nm on six different timescales following 532 nm laser
excitation of menB PSI particles. Single exponential fits to the data are the smooth lines shown
in red. Listed time constants are also shown. For the traces on the 100 µs, 400 µs and 1 ms, time
scales 640 measurements were averaged. For measurements on the 10 ms timescale 340
measurements were averaged. The traces in 10 µs, and 4 ms are averages of multiple sets of 640
measurements. ... 44
Figure 5.3 Semi logarithmic plot of normalized transient absorption data taken from
measurements at 703 nm on six timescales (as shown in Figure 5.2). Data were normalized to an
initial OD = -3.0x10⁻³. ... 45
Figure 6.1 Flash induced absorption changes at 703 nm in a) WT and b)menB PSI, in the
absence of PMS... 47
Figure 6.2 Flash induced absorption changes at 800 nm in a) WT and b)menB PSI, in the
Figure 6.3 Flash induced absorption changes at 703 nm in a) WT and b)menB PSI, in the
presence of PMS. ... 49
Figure 6.4 Flash induced absorption changes at 800 nm in a) WT and b)menB PSI, in the
presence of PMS. Two single exponential fits (red, blue) are shown in b) and differ only on
where the fitting starts (0 or 15 ns). In either case a time constant of 34-46 ns is calculated. ... 49
Figure 6.5 Flash induced absorption changes at 800 nm in a) WT and b)menB PSI on a 200 µs
timescale. By fitting the data to a double exponential function time constants of 8.5 and 57.8 µs
are calculated for menB PSI (red in b)). ... 52
Figure 7.1 Flash induced absorption changes observed at 487 nm for WT PSI on a a) 400 ns, b)
2 µs, c) 20 µs, and d) 200µs timescale. Single and double exponential decay fits are also shown
(red or blue). ... 55
Figure 7.2 Flash induced absorption changes observed at 487 nm for menB PSI on a a) 400 ns,
b) 2 µs, c) 20 µs, d) 200 µs and e) 400 µs timescale. Single and double exponential decay fits
are also shown (red or green). ... 57
Figure 8.1 Flash induced absorption changes at a) 703 nm, b) 800 nm, and c) 487 nm on a 400
ns time scale for menB+PhQ PSI. d) Flash induced absorption changes at 800 nm for WT (red),
menB (blue) and menB+PhQ (black) PSI samples. ... 60
Figure 9.1 The traces of of C.reinhardtii PSI observed at 487 nm in time scales 400 ns,
1000 ns, and 2000 ns with a global two exponential decay fitting on three traces. Solid lines
indicate the fits, and dotted lines are the raw traces. Three residuals are also plotted together. . 63
Figure 10.1 Global two exponential decay fitting on kinetics of A. marina observed at five
different wavelengths (465, 487, 492, 505, and 512 nm) in 2000 ns time scale. Single
1 INTRODUCTION
1.1 Photosynthesis
Photosynthesis is an important biological process that occurs in plants, algae, and certain
strains of bacteria. Photosynthesis is directly or indirectly responsible for nearly all food and
fuel products available on earth. Photosynthesis is also directly responsible for the earth’s
oxygen rich atmosphere. The importance of this biological process cannot be overstated.
Photosynthesis is the term that is used to describe the set of processes that utilize solar
energy to synthesis carbohydrate (biomass) from simpler molecules. In oxygenic photosynthesis
carbohydrate is synthesized from carbon dioxide and water. The overall oxygenic
photosynthetic process can be summarized as:
[image:15.612.170.452.461.622.2]
The photosynthetic process is also outlined schematically in figure 1.1.
Photosynthetic processes are generally divided into two parts. One part requires light
while the other does not. In the “light reactions” water is split into molecular oxygen. The
protons and electrons from this water splitting are used to make ATP and NADPH (from ADP
and NADP) [1]. These latter products of the light reactions are utilized in a series of “dark
reactions” that ultimately lead to the reduction of carbon dioxide to glucose [1]. In this thesis the
focus is on only certain aspects of the light reactions.
1.2 The Light Reactions
In plants, photosynthetic processes occur inside large cellular organelles called
chloroplasts [1]. The light and dark reactions occur in spatially distinct regions inside the
chloroplasts. The light reactions occur in a series of stacked membranes called the thylakoid
membrane. In the regions of the thylakoid membrane where the light reactions occur there are
four protein complexes that function cooperatively to split water and reduce NADP (and produce
ATP). The four protein complexes are called: photosystem II (PSII), cytochrome b6-f,
photosystem I (PSI), and ATP synthase (Figure1.2).
Photosystems II and I are large membrane spanning protein complexes that contain or
bind a large number of chlorophyll molecules/pigments that absorb solar energy. The light
reactions begin when light energy or solar photons are absorbed by PSII. The light energy is
used to transfer electrons vectorially across the thylakoid membrane via a series of bound
pigment acceptors (Figure 1.2). The electrons are transferred from PSII to the cytochrome b6-f
complex, and to PSI. The electrons receive the light energy again at PSI as the complex absorbs
the light. The electrons travel through PSI and across the membrane and is ultimately accepted
by NADP in stroma, which is reduced to NADPH. Transferring electrons across the thylakoid
gradient across the membrane is used by ATP synthase to make ATP. The end products, ATP
and NADPH, are then spent in the dark reactions to reduce CO2 to carbohydrate. Of four major
[image:17.612.74.544.148.381.2]protein complexes involved in the light reactions, photosystem I is focused on in this thesis.
Figure 1.2 A detailed schematic model of the higher plant / green algal thylakoid membrane with major protein complexes involved in oxygenic photosynthesis. Taken from
http://www.photosynthesis.sbcs.qmul.ac.uk/nield/psIIimages/oxygenicphotosynthmodel.html [1]
1.3 Structure of Photosystem I
Photosystem I is a membrane spanning protein complex that catalyzes light induced
electron transfer across the thylakoid membrane. The cyanobacterial PSI is composed of 12
protein subunits, 96 chlorophylls, 22 carotenoids, 3 iron-sulfur clusters, 2 phylloquinones, and 4
lipids [2].
In higher plants and algae, the collection of incident light is achieved by functional units
called light-harvesting complexes (Lhc in Figure 1.2), which are found in the exterior region of
PSI. The light-harvesting complexes contain large numbers of chlorophyll and carotenoid
light energy, and transfer it to the inner protein complex of PSI through the process of resonance
energy transfer. Between pigments in cyanobacteria instead of light harvesting complexes, 90
chlorophyll molecules and 22 carotenoids capture and transfer light energy. The inner complex
where the energy is transferred is called a reaction center (RC).
The reaction center, the core complex of PSI and the location of the primary
photochemistry transfers the electrons it receives from cytochrome through a series of its
acceptors to ferredoxin located on the stromal side of the thylakoid membrane. Of the twelve
protein subunits in the PSI core complex, nine of them: PsaA, PsaB, PsaF, PSaI, PsaJ, PSaK,
PSaL, PsaM, and PsaX, form trans-membrane subunits. The three remaining subunits, PsaC,
[image:18.612.204.412.347.577.2]PsaD, and PsaF are bound on the stromal side (Figure 1.3).
Figure 1.3 A schematic depicting the architecture of the PSI core complex embedded in the thylakoid membrane. The possible routes of electron transfer are shown with arrows. The subunits are labeled with alphabets. Taken from
The protein co-factors involved in the electron transfer are 6 chlorophyll molecules, 2
phylloquinones, and 3 iron-sulfur clusters. The co-factors are arranged along two symmetric
branches, called A and B branches. Most co-factors of electron transfer, including antenna
pigments (90 chlorophylls and 22 carotenoids), are bound to heterodimer subunits of PsaA and
PsaB. At the base of PsaA and PsaB on the lumenal side, positions labeled eC-A1 and eC-B1, is
P700. P700, heterodimer formed by chlorophyll a and chlorophyll-a’, is the primary electron
donor named after its maximum absorbance at 700 nm. Chlrophyll-a’ is a 132 epimer of
chlorophyll-a (Figure1.4.b, Figure 1.5). The two chlorophylls are oriented parallel to each other
and perpendicular to the membrane plane. P700 receives light energy from the surrounding
antenna pigments, and rapidly transfers electrons to the primary electron acceptor A0. Before the
primary electron acceptor is a pair of chlorophyll molecules designated at eC-B2 and eC-A2.
This pair of chlorophyll are not involved in the electron transfer. The primary electron acceptors
are chlorophyll-a molecules at eC-A3 and eC-B3. The secondary electron acceptors A1 are
phylloquinone (Vitamin K1) molecules (Figure1.4.a). The primary and secondary electron
acceptors are found on both side of the A and B branches. The secondary electron acceptors
transfer electrons to the three iron-sulfur clusters, Fx, FA, and FB. Fx, the iron-sulfur positioned
closest to the secondary electron acceptors, is aligned along the axis of the symmetry of the two
Figure 1.4 Structural arrangement of electron acceptor and donors involved in electron transfer in PSI [4]
Figure 1.5 a) Chemical structure of phylloquinone (Vitamin K1) which serves as the secondary
electron acceptor at A1 site. b) Chemical structure of chlorophyll-a molecule. Chlorophyll-a’,
[image:20.612.157.452.351.603.2]1.4 Electron Transfer in Photosystem I
Electron transfer in photosystem I begins when P700 receives light energy. The
excitation of P700 is followed by charge separation and electron transfer through a series of
co-factors of photosystem I, iron-sulfur clusters being the terminal electron acceptors. Each step of
electron transfer kinetics is characterized by a specific time constant. The kinetics of electron
transfer and methods of studying the electron transfer are discussed in this section.
1.4.1 Techniques and Methods for Studying Electron Transfer
A range of experimental techniques have been utilized in order to study the kinetics of
electron transfer that occurs in the timescale of picoseconds to milliseconds [5]. Two widely
used spectroscopic techniques in the study for the electron transfer are electron paramagnetic
resonance spectroscopy (EPR) and laser flash absorption spectroscopy. EPR detects the
magnetic moments of unpaired electrons of the cofactors involved in electron transfer, allowing
the observation of a species directly involved in electron transfer. One disadvantage of EPR
spectroscopy is its relatively low time-resolution. Laser flash absorption spectroscopy, also
known as pump-probe spectroscopy or laser flash photolysis, is another common method for
investigating the kinetics of electron transfer processes and is the main focus of this thesis. This
technique monitors the temporal change in absorbance of a sample excited by a short, intense
laser pulse. The details of the theory and applications to the study of the electron transfer
processes in photosystem I reaction centers are discussed in later sections and chapters. One
disadvantage to using pump-probe spectroscopy is that the optical density of the sample cannot
be too high, which limits the size of the signals obtainable. One advantage of using this
technique is the relatively high time-resolution and wide range of probe wavelengths that can be
In order to distinguish and relate the results of measurements to specific cofactors ,
modifications must be made to the sample. Common modifications include: lowering the
temperature, introducing mutations to the sample, and pre-reducing the sample. A change in
temperature changes the energetics of the electron transfer. Mutations introduced to the sample
make possible the deletion or replacement of the co-factors involved in electron transfer. When
factors are deleted the pathways in the electron transfer are inhibited. PSI with replaced
co-factors may produce altered electron transfer kinetics. Pre-reduction of the sample prohibits the
completion of electron transfer through the system and thus provides access to study the pathway
of electron transfer. Furthermore, in pump-probe spectroscopy measurements have been done in
fractioned photosystem I particles instead of whole cells. Whole cells have higher optical
densities. They also scatter light considerably. These properties make pump-probe spectroscopy
measurements difficult. Detergent isolated photosynthetic particles do not usually display the
above types of problems. However, effects of the isolation procedure may affect to the results.
1.4.2 Kinetics of Electron Transfer in Photosystem I
The overall scheme of charge separation in wild-type PSI is illustrated in Figure 1.6 [6].
The time constants associated with the electron transfer are also shown in the figure. Excitation
of the primary electron donor, P700, leads to the singlet excited state, P700*. From P700* an
electron is transferred to A0 on a picosecond timescale A0- transfers its electron to A1 with a time
constant of ~30 ps [7]. The charge recombination between A0- and P700+ occurs with a time
constant ~50 ns, which is slower by three orders of magnitude than the forward electron transfer
process [8]. Forward electron transfer from A1- to Fx is characterized by two kinetic phases with
time constants ~20 ns and ~200 ns [9-12]. These two phases of forward electron transfer are
recombination between A1- and P700+ occurs biphasically with time constants of ~10 µs and
~100 µs [13]. In a system where FA and FB are pre-reduced, charge recombination between FX
-and P700+ is occurs with a time constant ~250 µs [14, 15]. Charge recombination between FA/B
[image:23.612.85.529.205.539.2]-and P700+ is characterized by a time constant of ~80 ms [5].
1.5 Directionality of Electron Transfer in Photosystem I
In Section 1.3 where the structure of PSI is discussed two symmetric branches of
co-factors are mentioned. Furthermore, in Section 1.4.2 where the kinetics of electron transfer is
discussed, two time constants of the forward electron transfer from A1- to Fx are mentioned [6],
and it is suggested that forward electron transfer from A1 to Fx is biphasic, occurring down both
branches. The two time constants are ~20 and 200 ns, and are referred to as the “fast” phase and
“slow” phase, respectively [10]. The symmetric branches and dual phases of the forward
electron transfer rate raises the question of the directionality of electron transfer in PSI: whether
if both PsaA-side phylloquinone and PsaB-side phylloquinone are active as a bidirectional
system, or if only one of these branches participates in heterogenous but unidirectional electron
transfer [16]. The currently accepted hypothesis is that the both PsaA and PsaB branches are
active in electron transfer, with one branch being responsible for the fast phase and the other
branch the slow phase in A1- to Fx forward electron transfer.
Although the exact mechanism of the biphasic kinetics has not been revealed, a number
of experiments have been carried out to model the kinetics. One unidirectional model initially
proposed by Setif and Brettel claims the depletion of equilibrium state between A1 and Fx by
FA/FB as the source of biphasic kinetics [9]. According to this model, the fast phase originates
from the rapid equilibration between A1 and Fx. The depletion of this equilibrium by electron
transfer from the same A1 to FA/FB gives rise to the slow phase. Since one phylloquinone gives
rise to the two phases, the electron transfer is unidirectional. In contrast, one of the two models
suggested by Joliot and Joliot supports the bidirectional model [17]. The experimental result by
Joliot and Joliot showed that the relative amplitudes of the two phases are insensitive to the
result. One of the proposed models is the bidirectional pathway model, in which two
phylloquinones, one on each branch, are oxidized by Fx at different rates. The other model
suggests the unidirectional system, where a single phylloquinone gives rise to two rates by
having two different conformational states. The bidirectional model, although not proven, is
supported by numerous experimental results. The first experimental result to support the
bidirectional model was provided by Guergova-Kuras and co-workers using site-directed
mutations [18]. Site-directed mutation on green algae Chlamydomonas reinhardtii replaced the
tryptophan that is π-stacked on phylloquinone with phenylalanine. When the mutation was
introduced to the PsaA-side (PsaA-W693F), the slow phase is selectively slowed down.
However, when the same mutation was made on the PsaB-side to replace the tryptophan to
phenylalanine (PsaB-W673F), the faster phase is selectively slowed down. Cohen and
co-workers introduced another mutation on cyanobacteria Synechocystis sp. PCC 6803, which
replaced the axial methionine ligands of chlorophylls eC-A3 and eC-B3 to leucine [19]. The
transient EPR result showed an effect on the PsaA-side mutant only, indicating that the electron
transfer occurs mainly along the PsaA-side. Similarly, a mutant of C. reinhardtii which had a
methionine ligand to chlorophyll eC-A3 (PsaA-M684H) and eC-B3 (PsaB-M664H) replaced by
histidine was constructed by Fairclough and by Ramesh [20, 21]. Although the electron transfer
to the PsaA-side branch was blocked, PsaA-M684H still allowed photoautotrophic growth,
indicating that the PsaB-side branch was active and provided sufficient activity for
photoautotrophic growth. The result from PsaA-M684H and the similar results from
PsaB-M664H imply that both PsaA-side and PsaB-side branches are active in electron transport for C.
reinhardtii. Bautista and co-workers provided another experimental support for the bidirectional
pds-and zds-, had their β-carotene around their phylloquinone replaced by phytoene and
ζ-carotene respectively. The activity of their fast and slow phases was measured indirectly by
comparing the electrochromic shift of carotenoids around the phylloquinone for wild-type and
two mutants. The electrochromic shifts of the two phases are different, indicating that the
carotenoid pigments serving as electrochromic markers of two phases are also different.
Involvement of two different marker carotenoid pigments for two phases suggests that both
PsaA-side and PsaB-side phylloquinones participate in electron transport.
1.6 Mutant Photosystem I
As some examples mentioned in the previous section illustrate, mutant photosystem I
samples are widely used in the research of photosystem I electron transfer. In Section 1.5,
PsaA-W693F and PsaB-W673F, which have tryptophan replaced by phenylalanine in their respective
branches, PsaA-M684H and PsaB-M664H, which had methionine replaced by histidine, and pds
-and zds-, which had modified carotenoids around phylloquinone, were mentioned. The mutant
used for the study of electron transfer involving both to and from phylloquinone is the so-called
menB mutant of Synechocystis sp. PCC 6803 [22]. The menB gene is responsible for producing
napthoate synthase, a key component in the biosynthesis of phylloquinone (Figure 1.8). A
similar mutant, menA mutant of Synechocystis sp. PCC 6803, has a gene for phytyl transferase,
another key component of phylloquinone biosynthesis. The initial purpose of creating the menB
mutant was to disallow the biosynthesis of phylloquinone and produce an empty A1 binding site,
so that various quinones could then be reinserted into the vacant binding site to study the
contribution of phylloquinone in the A1 binding site. The binding site, however, was found to be
occupied by a foreign quinone identified as plastoquinones-9 [22]. The presence of
different kinetics than the kinetics of the photosystem I with phylloquinone present in the
binding site. Furthermore, the low binding affinity of plastoquinones-9 makes replacement by
other quinones possible [23]. Therefore the menB mutant is significant to the research of the
kinetics of Photosystem I electron transfer as it can be studied as the subject of comparison with
wild-type to investigate the contribution of phylloquinone in the binding site, or be utilized as the
sample to test a variety of quinones as the plastoquinones-9 can be replaced by the other
[image:27.612.105.510.271.656.2]quinones due to its low affinity to the binding site.
Figure 1.7 a) The biosynthetic pathway of phylloquinone [23]. In menB mutants, the
1.7 Chlorophyll-d containing Photosystem I
As discussed earlier, in almost all higher plants, algae, and cyanobacteria, the
light-induced electron transfer in PSI start from P700, the heterodimer of chlorophyll-a and
chlorophyll-a’. In addition to this special pair, chlorophyll-a molecules, four more from the
reaction center and ninety from the antenna pigment,make up the majority of the pigment
composition of PSI. Similar to other plants, algae and cyanobacteria, cyanobacterium
Synechocystis sp. PCC6803 and green alga Chlamydomonas reinhardtii, two specimens studied
in this thesis for the study of PSI electron transfer, also have this chlorophyll-a composition in
PSI. In this perspective the cyanobacterium Acaryochloris marina, discovered in 1996, , is an
exception [24]. A. marina’s pigment composition in its PSI is dominated by chlorophyll-d
molecules instead of chlorophyll-a. Of the chlorophyll molecules which compose A. marina’s
pigments, ≤5% are chlorophyll-a [24]. The difference between chlorophyll-d and chlorophyll-a
is seen at R-3 position where the vinyl group in chlorophyll-a is replaced by the formyl group in
[image:28.612.201.414.464.682.2]chlorophyll-d.
The other remarkable feature that distinguishes A. marina is that it contains α-carotene
instead of β-carotene for its antenna pigment. The primary electron donor in A. marina is
structurally similar to P700, except chlorophyll-d and its epimer make up the dimer. The
heterodimer of chlorophyll-d and chlorophyll-d’, the 132 epimer of chlorophyll-d, is called P740.
From the results of optical spectroscopic studies, the chlorophyll-a molecules found in A. marina
is believed to be acting as the primary electron acceptor A0, similar to the chlorophyll-a
containing PSI. The secondary electron acceptor is phylloquinone, also similar to the
chlorophyll-a containing PSI. The biphasic kinetics of the forward electron transfer from A1 to
FX was observed through pump-probe spectroscopy on whole cells of A. marina at room
temperature by Santabarbara and co-workers [25]. The observed lifetimes of 88 ns and 345 ns
2 TIME RESOLVED OPTICAL ABSORPTION SPECTROSCOPY
2.1 Laser Flash Photolysis
Flash photolysis was developed by Porter and Norrish in 1949 [26]. The technique
allows the monitoring of transient species produced upon light irradiation of organic molecules,
polymers, or photosynthetic units. The kinetics of transient state of a sample, which is often an
excited state of a sample, exists only for a fraction of a second. Because of this excited state’s
short lifetime, the kinetics are generally not measurable by the absorption of fluorescence
spectroscopy where measurements are made in seconds.
In order to study the absorption characteristics of excited state, a sample needs to be
excited first by ground state absorption, as excited states do not occur naturally in an undisturbed
sample. In laser flash photolysis, a laser pulse is used as a powerful excitation source (called
pump) to generate high concentration of excited state species. The absorption characteristic of
the kinetics of an excited state species generated by pump laser is monitored by the light
transmitted (called probe) through the sample.
In the study of electron transfer in a photosystem, the transition states observed are
reduced and oxidized states of the electron donors and acceptors. Through laser flash photolysis,
kinetics of these transient species or the rate of reduction and oxidation of the electron donors
and acceptors can be analyzed. These transition species, which are initially generated by a pump
laser excitation, exist in the timescale range of picoseconds to tens of milliseconds. Kinetics of
each transient species can be monitored by selecting a probe wavelength at which the transient
2.2 Laser Flash Photolysis Spectrometer
Figure 2.1 A schematic drawing of LP920 laser flash photolysis spectrometer.
The principle schematic of a laser flash photolysis spectrometer resembles the schematic
of a UV-Visible range absorption spectrometer. A probe light is focused on a sample, and the
transmitted light is measured by a detector. The detector converts the measured transmitted light
into electrical signals that are processed by the oscilloscope. The wavelength of the probe light
is selected by a monochromator that is placed either before or after the sample. In addition to
this setup, a laser flash photolysis spectrometer makes a use of a pump laser. The pump laser is
placed at an angle, usually 90 degrees, to the path of the probe light.
Furthermore, a pulsed flashlamp is used as a probe light source instead of a continuous
light source. As in any other absorption spectroscopy, a sufficient background level is required
to observe changes in transmission. In the short timescale of the laser flash photolysis
measurements, a continuous light source often does not provide enough background photon flux.
significantly, which then improves the signal to noise ratio of measurements. To protect the
sample from exposure to the probe and pump source before and after the actual timescale of a
measurement, shutters are placed between a sample and each light source. These shutters also
make certain background measurements possible.
2.3 Optical Densities
2.3.1 Calculation of Optical Densities
The change in probe light transmittance through the sample over time is measured by the
detector and processed as electrical signals by the oscilloscope, which can then be analyzed as
the change in absorption. The change in absorption of the sample before, during, and after the
pump excitation is calculated in units of change in optical density, . , expressed in
terms of the intensity of transmitted light, is:
where is the intensity of the transmitted light before the pump excitation, and is the
intensity of the light on and after excitation. The Beer-Lambert law relates optical density with
the sample concentration, path length that light travels, and the extinction coefficient of the
sample as:
Then, the general expression of for laser flash photolysis measurement can also be
where and are the extinction coefficients of the ground state species and the transient state
species respectively. and are the sample concentration of the transient species and the
ground state species, and is fluorescence spectrum of the sample. In the region of wavelengths
where ground state sample does not absorb, and assuming no fluorescence, is
indicating that is positive. If the measurement is taken in the region where ground state
absorbs more dominantly instead, shows the same decay kinetics but negatively:
2.3.2 Calculation of Background Correction
Often times, depending on the environment of the experiment, including a sample; probe
and pump stability; probe and pump wavelengths; and the timescale of a measurement,
background corrections need to be taken into account for the calculation. Two of the
corrections that can be included in the calculation are probe background correction and
fluorescence correction.
Probe background correction is measured in order to correct for probe pulse fluctuations
(Figure 2.1). The probe pulse intensity may fluctuate within the monitored time window
depending upon the timescale of the measurement, width of the pulse, and the position on the
pulse monitored. To compensate for the fluctuations in the probe, a measurement is taken
without the pulse excitation in addition to the regular measurement. The calculation of
with the probe background correction is expressed as:
presence of a laser flash, and is the intensity of the probe background over time. The first
term of the function is expressed with and , which are the constant background levels of
the transmitted light and probe background respectively before the timing of the pump excitation
in the absence of the pump pulse.
Figure 2.2a) Raw data consists of transient (red) and probe background (black).
b) Calculated from the transient and probe background in a). Even when the pulse profile is not stable, probe background can take into account the fluctuations.
Fluorescence Background correction is measured to offset a contribution from sample
fluorescence, scattered laser light, and laser noise (Figure 2.2). The background is measured by
recording the signal from the signal of the pump-excited sample while having the probe beam
blocked by the probe shutter. The calculation of with the fluorescent background
correction is expressed as:
where is the intensity of the fluorescent background, and are the intensity of
the constant background level of the transmitted light before the excitation and the intensity of
Furthermore, both the probe and fluorescence background corrections can be applied
together (Figure 2.3). In such a case, the function for the calculation of the optical density is:
Figure 2.3a) Raw data consists of transient (black) and fluorescent background (red).
[image:35.612.77.533.146.361.2]b) Calculated from the transient and fluorescent background in a). Peaks observed in raw data, both in transient and fluorescent background, are the contributions by fluorescence.
2.4 Decay Laws Associated with Molecular Kinetics
From the observed over time, the information of kinetics of transition states can be
extracted. Specifically, the lifetime of kinetics and an order of the decay process can be
determined. The lifetime of kinetics that is calculated from the observed over time is the
mean lifetime, the time at which the population of interest is reduced to . In the
previous chapter, the time constants of electron transfer in photosystem I describes the half-life,
the time at which the population of the interest is reduced to one half. The relationship between
the mean lifetime and half-life can be expressed as:
In the next section, the decay laws associated to molecular kinetics, specifically electron transfer,
are discussed.
2.4.1 First Order Decays
A first order decay depends on the concentration of only one species. In a case of laser
flash photolysis, the species could be an electronically excited molecule or a molecule in triplet
state in an absence of a quencher. More specifically, in the study of Photosystem I kinetics,
reduced or oxidized cofactors go through the first order decay in forward electron transfers or in
charge recombination reactions. Thus, the only decay law that this thesis focuses on is the first
order decay.
In the first order decay, the reaction rate r with respect to a concentration of decaying
species M is
[M0] is the initial concentration of M. Furthermore, the equation can be expressed as
Since, in laser flash photolysis, the concentration of the sample is directly related to the due
to Beer-Lambert Law, the above equation in terms of is
The mean lifetime τ and the decay constant is inversely related
Thus the mean lifetime of the first order decay can be calculated from the exponential fits of the
observed as a function of time.
2.4.2 Pseudo-first Order Decays
In a situation where a transient species is being quenched by a second species, such as in
a case where a triplet state is being quenched by molecular oxygen, an enhanced rate of decay
relative to unimolecular decay is observed. The reaction rate is then expressed as
where M is the transient species and Q is the second species quenching M. Usually, the
concentration of the quenching species is much greater than that of the quenched transient
species. The rate constant can now be expressed as
which suggests that the observed rate constant k2is greater than k1, meaning a faster decay time
2.4.3 Second Order Decays
A second order decay depends on the concentration of the two first order species. An
example of a reaction that goes through a second order decay is triplet-triplet annihilation. An
equation of this reaction can be written as
The rate equation of such a reaction is
which gives, in terms of ,
The decay is not exponential. The initial part of the decay is characterized by fast
non-exponential decay, while the final part is characterized by non-exponential decay.
2.5 Pump-Probe Spectroscopy on Photosystem I Kinetics
The application of laser flash photolysis, or pump-probe spectroscopy, on Photosystem I
has revealed much of the kinetics of electron transfer. For the laser flash photolysis experiments,
the sample used are usually whole cells or fractionated PSI particles prepared from the
specimens. Some common specimens, for both whole cells and PSI particles, are
cyanobacterium Synechocystis sp. PCC 6803, green alga Chlamydomonas reinhardtii, and
spinach leaves [6, 9, 11]. The sample is usually suspended in a buffer such as Tris·HCl at ~ pH
8.0 containing n–dodecyl β-D-maltoside, a detergent to reduce PSI aggregation [4, 22]. Glycerol
reagents such as sodium ascorbate, phenazine methosulfate (PMS), methyl viologen, and
dichlorophenolindophenol (DCPIP) are added depending on the experiments [4, 27].
To determine the lifetime of the electron transfer, time-dependent absorbance changes of
the co-factor of the interest needsto be measured over time. Therefore the wavelength of the
probe light needs to be selected so that the difference in absorbance between the ground state and
the transient state of the measured co-factor is considerably large. Absorption difference spectra,
on which the difference in absorbance between certain time intervals measured at variety of
wavelengths are plotted, relays this information.
387 nm is assigned as the maximum wavelength for the changes in the phylloquinone
absorbance. The maximum wavelength is determined from the
phyllosemiquinone-minus-phylloquinonne difference spectrum in the solution [11]. In 1988 Brettel performed pump-probe
spectroscopy measurement on PSI particles prepared from cyanobacteria Synechococus sp. at
387 nm at room temperature. The half-life obtained from the observed decay was t1/2≈ 200 ns.
The difference spectrum of the 200 ns phase was then constructed for the wavelengths between
330 nm and 500 nm at room temperature. The fast phase was not observed in this experiment.
In 1993, Brettel and Setif conducted another pump-probe spectroscopy experiment on PSI
particles at room temperature [9]. The particles were prepared from spinach and Synechocystis
sp. PCC 6803. In this experiment, two phases that correspond to the forward electron transfer
from the phylloquinone to their iron-sulfur cluster were observed. The half-lives of the fast and
slow phases at room temperature were t1/2≈ 15 ns and t1/2≈ 150 ns. Agalarov and Brettel, in
2003, investigated the temperature dependence of these two phases on monomeric PSI particles
from Synechocystis sp. PCC 6803 [12]. At room temperature, the lifetimes of the two phases
constants, are t1/2 = 9.7 ns and t1/2 = 235 ns respectively. The slow phase slowed upon cooling
while the fast phase stayed independent of temperature change.
In the blue region of the difference spectrum of A1/A1-, an absorbance decrease at ~450
nm and an absorbance increase at ~487 nm also exist. These peaks are assigned to the
electrochromic band shifts of carotenoid pigments around phylloquinone in A1. Because the
electrochromic shifts accompany A1 reduction, the wavelength in this region can be used to
probe the electron transfer in A1. Bautista and co-workers performed pump-probe spectroscopy
experiments on PSI at 380 – 390nm and 480 nm [10]. The measurements were done on particle
PSI and whole cells of Synechocystis sp. PCC 6803. Both the fast and slow phases were
observed for particle PSI and whole cells. The averaged half-lives of particle PSI analyzed at
380 – 390 nm were t1/2 = 8 ns and t1/2 = 177 ns, while the half-lives observed at 480 nm were 9 ns
and 152 ns. The measurement at 480 nm on whole cells decayed with half-lives t1/2 = 8 ns and
t1/2 = 180 ns. Another kind of the electrochromic shift is observed between 680 nm and 702 nm.
At these wavelengths, the electrochromic band shift of the chlorophyll-a pigments in the vicinity
of A1 is seen. Dashdorj and co-workers obtained the half-life time constant of 300 ± 50 ns for
the slow phase through these wavelengths for particle PSI from Synechocystis sp. PCC 6803
[28].
One of the kinetics commonly measured by the pump-probe spectroscopy other than the
forward electron transfer from A1 to iron-sulfur cluster is the P700+ charge recombination
kinetics [6]. The P700+ charge recombination kinetics can be measured at around 703 nm, the
wavelength where the absorbance peak of P700 is, or at beyond 750 nm, where P700 no longer
is reported to have lifetime of ~80 – 100 ms [6]. Shinkarev and co-workers obtained 107 ms for
a particle PSI from Synechocystis sp. PCC 6803 measured at 832 nm [4].
Although the complete mechanisms of the kinetics of the electron transfer in the menB
mutant has not been revealed yet, certain paths of electron transfer have been studied more
extensively. Two paths of the menB mutant electron transfer that have time constants confirmed
are the forward electron transfer from A1 and the P700+ charge recombination kinetics.
Semenov and co-workers determined in 2000 that the fast and slow phases of the A1 forward
electron transfer rate are τ = ~15 µs and τ = ~250 µs at 315 nm and 485 nm [22]. The P700+
charge recombination kinetics was studied by Shinkarev at 832 nm, and the lifetime of τ = 2 ms
was resultant [4].
The summary of the observed time constants are listed in the table below (Table 2.1). All
the constants are in terms of mean-lifetime. Those that are initially reported as half-lives are
T ab le 2 .1 A summ ary of som
e of the
r epo rte d ti me c onst
ants. Al
l t he c ons tants a re the me an -li fe ti
me. T
he li fe ti mes of tw o pha se s of the f or w ard e le ctron tr ansfe r fr om A 1 a
nd the P700
+ c
ha rge r ec ombi na ti
on kinetics a
re r eporte d. The state of the P S I, w he ther pa rticle or w hol e c ell s, a re a lso no ted. P7 0 0
+ r
ec o m b in atio n
- - - 154
ms 2 ms S low P ha se 2 89 ns 216 ns. 339 ns 255 ns 219 ns 260 ns 432 ± 72 ns
- 250
µs
F
ast phase
- 22
ns 13.6 ns 11 ns 13 ns 12 ns
- - 15
µ s PS I Sy ne cho cy sti s sp. P C C 68 03 pa rticle S pinac h Sy ne cho cy sti s sp. P C C 6 803 pa rticle Sy ne cho cy sti s sp. P C C 6 803 P article (monomer ic ) Sy ne cho cy sti s sp. P C C 6 803 P article Sy ne cho cy sti s sp. P C C 6 803 W hole c ell s Sy ne cho cy sti s sp. P C C 6 803 pa rticle Sy ne cho cy sti s sp. P C C 6 803 pa rticle me nB mut ant pa rticle R eporte d by: B re tt el (1988) [11] B re tt
el and Setif
(1993 ) [9] Aga lar ov a nd B re tt el ( 20 03 )
[12] Bauti
3 EXPERIMENTAL DETAILS
3.1 Pump-Probe Spectrometer
The standard setup of the laser flash photolysis spectrometer, along with modifications
we introduced, are discussed in this section. In all work reported here an LP920 Edinburgh
Instruments pump-probe spectrometer was used[29]. An overview of the setup of the LP920 is
shown in Figures 3.1 and3.2). The setup includes a probe light source, a pulser unit, a
spectrometer controller system, a monochromator, a photomultiplier detector, an oscilloscope
and a laser light source. The pulsed probe light is directed through the sample. The laser light is
also directed through the sample, perpendicular to the probe light. The probe light after
traversing the sample is then focused on the monochromator, where the wavelength of the light is
selected, and then focused onto a photomultiplier tube detector. The signal detected by the
photomultiplier tube is processed by an oscilloscope. The timing and synchronization of the
pump and probe light pulses, the laser firing, and the opening and closing of the mechanical
[image:43.612.156.460.465.693.2]shutters are all manipulated by the spectrometer control unit via a software interface.
3.1.1 Probe Light Source
The probe light source used in the LP920 is a 450 W xenon flash lamp. The flash lamp
produces a continuous spectrum in the 190-2600 nm range [29]. The lamp’s current, in the range
of 10 to 27 A, can be set from the front panel of the lamp’s power supply. The lamp is enclosed
in a rigid aluminium housing which helps limit electromagnetic interference from the lamp
source. The housing also includes a spherical reflector behind the lamp. The positions of the
lamp and the reflector can be adjusted independently horizontalyl and vertically.
A pulser unit, discussed in next section, allows the lamp to be used in pulsed mode with
the frequency up to 10Hz.
3.1.2 Pulser Unit
The pulser unit, xP920, works in combination with the probe light source Xe920 to
produce short period and high current probe pulses. As discussed earlier, the probe pulse is
crucial in increasing the background photon flux to improve a signal-to-noise ratio in short
timescale measurements. The pulse has a fast rising and falling time, giving it a rectangular
shape. The size of this rectangular pulse can be adjusted from 0.2 to 10 ms in width, and 50 to
300 A in current. The repetition rate of the pulse is 10Hz at the fastest. The lamp power, , is
determined as a product of the current ( ), pulse width ( ), repetition rate ( ), and the lamp
voltage (set at factory setting 60 and not adjustable by the user) during pulsing. The expression
of the lamp power, therefore, is
Figure 3.2 A typical optical pulse profile of xenon flashlamp, Xe920, pulsed by the pulser unit XP920. The pulse in this figure is set to be 10 ms in width and is fired at 16 Hz. The trace is an average of 160 measurements. In an actual measurement of kinetics, a position of the pulse with the least drift in the specified time range is chosen as the time window of the measurement. In addition to the repetition rate, width (duration) of the pulse, height (voltage) of the pulse can directly be adjusted by changing current.
3.1.3 Spectrometer Controller
The LP920 controller serves as the central timing unit for the spectrometer. Through the
software interface, the controller provides access to the settings of the probe pulse, pump laser,
probe and laser shutters, and the monochromator positioning. In addition, the oscilloscope
3.1.4 Monochromator
A Czerny-Turner monochromator, manufactured by Bentham Instruments (model
TMc300), with symmetrical spherical mirrors is placed between a sample chamber and a
photomultiplier detector. The monochromator is comprised of two symmetric spherical mirrors
and a plane reflection grating. Wavelength selection through grating angle adjustment is
automated by a software controlled micro-step motor. The reflection grating has 1800 grooves
per millimeter, blazed at 500 nm. The region of wavelength coverage is from 200 nm to 900 nm.
The motorized grating covers this region of wavelength in minimum step size of 0.05 nm. At
both the entrance and the exit of the monochromator are the microscrew apertures that control
[image:46.612.155.460.386.628.2]the slit size to determine the spectral bandwidth.
3.1.5 Photomultiplier Detector
A red sensitive photomultiplier tube, Hamamatsu R928, is incorporated in the detector
assembly. The photomultiplier tube covers a region of wavelength from 187 nm to 900 nm, with
peak sensitivity at 400nm. The detector assembly uses an interlock shutter that protects the
photomultiplier tube. A bias voltage can be controlled by a turning knob on the detector
assembly. The detector has two versions of the amplifier circuit: fast amplifier and slow
amplifier. The fast amplifier circuit has a rise time of less than 1 ns for an output impedance of
50 Ω, and is suitable for measurements in timescale up to 100 µs [29]. The slow amplifier
design with an impedance of 1 MΩ is chosen for measurements in timescale longer than 100 µs.
3.1.6 Oscilloscope
The oscilloscope used in this set up is the Tektronix TDS3012B digital storage
oscilloscope. The signal from a photomultiplier detector is digitally recorded on the
oscilloscope. The oscilloscope is connected to the computer by an Ethernet connection for fast
data transfer and thus accessible by the spectrometer software.
3.1.7 Sample Compartment
The sample compartment is a light tight box where a sample is placed (Figure 3.5). The
lid that provides access to the interior of the box is equipped with microswitches that trigger the
photomultiplier detector’s interlock shutter.
A sample holder is placed inside the sample compartment (Figure 3.5). While the cross
beam geometry where the probe light and pump laser intersect on the sample perpendicularly is
used in the regular setup, the holder is capable of providing other configurations such as quasi
co-linear geometry and diffuse reflectance geometry. In quasi co-linear geometry, the probe and
reflectance geometry, the probe light is reflected off samples in powder, bulk, or non-transparent
film form at an angle. The pump laser is focused on the sample surface where the probe light is
reflected. In all configurations, fixed apertures can be set on both sides of the sample to restrict
the size of the probe light.
Protecting the sample in sample holder from the two light sources are the electronic
shutters. In addition to providing protection from photo-bleaching and photo-degradation due to
prolonged exposure to the probe or pump sources, the shutters also control the timing and the
length of the exposure. The shutters can set to be fully open, fully closed, or timed via the
spectrometer software. Both shutters are synchronized and the duration of their opening can also
be controlled by the software.
Two focusing lenses are placed in line with the course of the probe light. One lens is
positioned by the xenon lamp unit and the other lens is located by the entrance of the
monochromator. The lens by the xenon lamp unit focuses the probe light source from the lamp
unit on to the sample. The lens by the entrance of the monochromator, along with the mirror
optics inside the monochromator, re-focuses the light on the photomultiplier detector. The
Figure 3.4 A sample compartment and a sample holder.
3.1.8 Laser
The laser used as a pump source for the system is Continuum Surelite I-10. The
Q-switched Nd:YAG laser produces a 4 – 6 ns pulse at 532 nm with max energy of 200 mJ. The
repetition rate of the flashlamp is set to 10 Hz.
3.1.9 Software
All of the components of LP920 are accessed and operated by the software by Edinburgh
Instruments: L900. L900 provides a platform to access each component to modify its settings,
run various kinds of measurements, and analyze collected data. Specifically, the hardware that
can be accessed through L900 are: the pump laser system, probe light system, oscilloscope, and
detector.
In pump laser setting, the flashlamp properties, Q-switch properties, and repetition rate
can be modified. The flashlamp trigger delay can be changed to shift the flashlamp trigger in
the xenon lamp pulse; Q-switch trigger delay, on the other hand, is responsible for the interval
between the timing between flashlamp trigger and Q-switch trigger, and alters the energy
intensity of the laser pulse. For the probe light setting, pulse width, pulse current, and pulse
shutter width can be adjusted within the limit of maximum power. Photomultiplier impedance
can be set as either 50 Ω or 1 MΩ depending on the timescale of the measurement. 1 MΩ is
recommended for a measurement longer than 100 µs, and 50 Ω is used for a measurement faster
than 100 µs.
For the measurement set up the timescale of the measurement, number of measurement,
types of background to use, and mode of probe light can be specified. The timescale of the
measurement, or duration of acquisition, can be varied from a hundreds of nanosecond range to a
hundreds of millisecond range. The background to be subtracted, as explained earlier, can be
selected from either no background, probe background subtracted, fluorescence background
subtracted, or both probe and fluorescence background subtracted.
The obtained measurement can be fitted to find the mean lifetime on L900, or converted
to text files which can then be analyzed on other graphing software.
3.2 Investigated Samples
The PSI complexes studied in this thesis are fractionated particles. PSI particles were
isolated from cyanobacterium Synechocystis sp. PCC 6803. The particles of menB mutant PSI
were also constructed and isolated from Synechocystis sp. PCC 6803. Both the wild-type PSI
and menB mutant PSI particles were suspended in a Tris buffer (25 mM, pH 8.3) with a 0.04 %
β-DM. The sample was placed in a 1 x 0.5 cm plastic cuvette. The probe light beam passed
through a 1 cm side of the cuvette. The reaction medium, in addition to the Tris buffer,
PSI particles from Chlamydomonas reinhardtii were also studied. The buffer and the
composition of the reaction medium were the same as the ones for PSI particles from
Synechocystis sp. PCC 6803. The sample was also measured in a 1 x 0.5 cm plastic cuvette.
Isolated particles of chlorophyll-d containing PSI from Acaryochloris marina were
studied briefly with the same buffer and the reaction medium as the ones used for chlorophyll-a
containing PSI.
All the PSI samples were frozen until re-suspension by the Tris buffer, and the
4 SAMPLE ABSORPTION SPECTRA
Absorption spectroscopy in the 400-800 nm region was used to initially characterize the PSI
particles studied. Absorption spectra of PSI particles from wild-type and menB mutants of
Synechocystis sp. PCC 6803, Chlamydomonas (C.) reinhardtii, and Acaryochloris (A.) marina
(all re-suspended in a 25 mM Tris buffer at pH 8.3 with 0.04% β-DM)in the 400-800 nm range
are shown in Figures 4.1 and 4.2. Absorption measurements were made using a Shimadzu
UV-1601 spectrometer. The spectra shown in figures 4.1 and 4.2 were normalized to the Qy peaks in
a red region, at 680 nm for the wild-type (WT) and menB mutant PSI particles from
Synechocystis sp. PCC 6803 (S6803), 678 nm for C. reinhardtii, and 703 nm for A. marina.
Although the Qy peak positions were the same for both WT and menB mutant PSI (680 nm),
the two spectra exhibit significant differences around ~498 nm (Figure 4.1). This difference in
absorption around 500 nm between WT and menB PSI was also reported in a recent study [30].
The exact cause of the increase in the absorbance in near 500 nm in menB PSI has not been
determined, but it is likely associated with a differing amount of carotenoids in the mutant PSI
particles. This observation is of some relevance because the 450-500 nm region is widely
studied in pump-probe spectroscopy of PSI particles, primarily because it is thought that
electrochromic band-shifts of carotenoid pigments occur in this region (see below). A.marina
PSI particles also display increased absorption in the 450-550 nm region, compared to that for
PSI particles from C. reinhardtii or S. 6803. Although there is no reason why the carotenoid
content in A. marina PSI should resemble that of C. reinhardtii PSI.
In all of the studies reported here we have used laser flashes at 532 nm (green light) to excite
the samples. As can be seen in figures 4.1 and 4.2, the sample absorption at 532 nm is close to
Figure 4.1 Absorption spectra of wild type (black) and menB mutant PSI (red) particles from
[image:53.612.117.432.83.339.2]Synechocystis sp. PCC 6803.The spectra were normalized to an OD = 1.5 at 680 nm.
Figure 4.2 Averaged absorption spectrum of wild-type PSI particles from Acaryochloris marina
[image:53.612.119.433.387.642.2]
![Figure 1.4 Structural arrangement of electron acceptor and donors involved in electron transfer in PSI [4]](https://thumb-us.123doks.com/thumbv2/123dok_us/9227712.990558/20.612.157.452.351.603/figure-structural-arrangement-electron-acceptor-involved-electron-transfer.webp)
![Figure 1.6 The kinetics of electron transfer in PSI [6]. The various radical pair states and the redox properties are plotted relative to the approximated standard free energies](https://thumb-us.123doks.com/thumbv2/123dok_us/9227712.990558/23.612.85.529.205.539/kinetics-electron-transfer-properties-relative-approximated-standard-energies.webp)
![Figure 1.7 a) The biosynthetic pathway of phylloquinone [23]. In menB mutants, the MenB/sll1127 gene is mutated](https://thumb-us.123doks.com/thumbv2/123dok_us/9227712.990558/27.612.105.510.271.656/figure-biosynthetic-pathway-phylloquinone-menb-mutants-menb-mutated.webp)


