ScholarWorks @ Georgia State University
ScholarWorks @ Georgia State University
Kinesiology Theses Department of Kinesiology and Health
8-7-2012
The Effects of Prosthetic Alignment over Uneven Terrain
The Effects of Prosthetic Alignment over Uneven Terrain
Linda Meurer
Georgia State University
Follow this and additional works at: https://scholarworks.gsu.edu/kin_health_theses
Recommended Citation Recommended Citation
Meurer, Linda, "The Effects of Prosthetic Alignment over Uneven Terrain." Thesis, Georgia State University, 2012.
https://scholarworks.gsu.edu/kin_health_theses/5
1
The Effects of Prosthesis Alignment over Uneven Terrain
A THESIS
Submitted on 31 July 2012 to the Department of Kinesiology and Health in the College
of Education, Georgia State University
In partial fulfillment of the requirements for the degree of Master of Science in Exercise
Science, with a Biomechanics Concentration
By
____________________________________
L. Megan Meurer
Approved:
_______________________________________
Mark D Geil, Ph.D., Advisor
_______________________________________
Jerry Wu, Ph.D., Committee Member
2
Christopher Ingalls, Ph.D., Committee Member
Table of Contents
Abstract……..……….………..3
I. Introduction…………..……….………....3-7 Statement of Question………..5
Rationale……….5-6 Hypotheses………...………...6
3
Appendix B………..37
Appendix C………...38-42
Appendix D………...………..43
Abstract
The purpose of this study was to analyze kinetic and kinematic data of individuals with
unilateral transtibial limb loss and the effect different alignments have on the individual’s gait
while they walk over uneven terrain. Individuals with lower limb loss are currently having their
prostheses dynamically aligned to ensure a satisfactory walking gait on level ground with
smooth surfaces, usually in the clinician's office or hallway. This study was looking to determine
whether or not current prosthesis alignment procedures are adequate for determining a
satisfactory walking gait on non-level and non-smooth terrains as well level smooth surfaces.
An effective and efficient walking pattern is necessary to prevent degenerative conditions within
the bones, muscles or other tissues of the body, due to compensations of the gait pattern.
Sometimes, individuals are able to mask any compensations if their safety is unaffected by their
surroundings and they are able to maintain a gait that appears normal or optimal. However, if
terrains used on a daily basis present a sense of insecurity, gait compensations could be more
problematic to the individual and they need to be addressed and corrected as best they can.
This study determined that while there were some changes in gait on the uneven surface, due
to the number of subjects it is unclear whether the changes are significant. The individuals
showed a decrease in walking speed and step length and an increase in step width. There were
also changes in the peak axial force.
4
Individuals with unilateral transtibial limb loss sacrifice comfort, stability, and mobile
efficiency due to the mechanical nature of their prosthesis and its interaction with their residual
limb. Sometimes individuals with unilateral transtibial limb loss are able to mask any
compensations and/or adaptations they may have when walking on level surfaces with their
prosthesis not aligned optimally. With the additional element of uneven terrains, individuals may
be unable to continue masking the compensations, making them observable to the clinician.
The purpose of this study was to determine if the individual’s optimized alignment while walking
on even ground was also sufficient for walking on uneven terrains. If it was insufficient,
additional methods of aligning prostheses are necessary in order to ensure comfort, stability,
and efficiency on a daily basis, and on multiple kinds of surfaces.
This study determined there was a decrease in step length and walking speed, and an
increase in step width when an individual with unilateral transtibial limb loss walked over uneven
terrain. At the same time, we also looked to see if there were changes in the peak axial force
for each step. We recruited apparently healthy adults who were at least one year post
amputation and who could walk comfortably and unassisted for at least 50 meters. The
individuals were asked to walk on both even and uneven surfaces; the uneven surface
consisted of loosely packed pebbles of varying size. There were four alignment changes done
to each individual’s prosthesis. These changes were 4 and 8 of external rotation and 4
and 8 of internal rotation. The two levels of degrees were used to determine if there was a
threshold angle where the compensations were no longer able to be masked. Each subject had
their self-selected optimized alignment identified as 0 , or neutral, and each of the changes in
rotation were done in relation to it. Overall, there were five conditions observed and compared.
The two changes in each direction help to ensure the results were more clinically relevant by
5
successfully masked. The uneven surfaces may have unmasked any gait compensations the
individual might have used successfully on even surfaces in order to get through the uneven
terrain as safely and comfortably as possible.
Statement of Question
Does a change in prosthesis alignment from an optimized state to that of a
non-optimized state in individuals with unilateral transtibial limb loss cause a change in any gait
compensations they may adopt while walking through loosely packed pebbles of varying size,
as compared to the same misaligned prostheses while walking on even terrain?
Rationale
In order to better understand the transtibial prosthesis alignment process on outdoor
surfaces, it is necessary to measure and observe gait on such surfaces. Since we are unable to
take our equipment outside, we brought one of many outdoor surfaces into the laboratory. We
used a quarter ton of various sized pebbles arranged into a path. Using gait analysis
technology to study prosthetics allows for better insight and knowledge about different
compensation strategies individuals develop in order to walk as safely as possible in their
prosthesis. Therefore, these insights can help give us information for more effective gait
training programs and also provide new knowledge for the development of new prosthetic
components (J. Rietman, K. Postema and J. Geertzen, 2002). Currently, the dynamic alignment
process consists of a prosthetist relying on clinical training in observational gait analysis and
experience performing alignment changes producing a satisfactory gait. However, this is
subjective and variable process (M. Geil and A. Lay, 2004). In addition to the process being
6
into consideration in order to achieve an optimized alignment. This results in a multitude of
information to consider for a safe and comfortable walking pattern.
Realistically, most, if not all, of the surfaces being used to walk on are neither level nor
smooth; there are inclines, declines, steps, loose rocks, gravel, sand, and other navigational
distractors that need to be taken into consideration. With the conclusion of this study we stand
to benefit from additional knowledge of the alignment procedure that can improve current clinical
alignment processes by learning that it is not necessarily enough to achieve a satisfactory gait
on even walking surfaces, but that walking satisfactorily on uneven surfaces needs to be
achieved as well. Sometimes, individuals with unilateral transtibial limb loss are able to mask
their gait compensations while walking over level terrain because they do not have insecurities
about the surfaces they are walking on, and if the individual is required to concentrate on what
they are walking on to ensure security, then any gait adaptations that could have otherwise
been masked, may be brought to the forefront and observed (Geil, 2002).
Hypothesis
When individuals with unilateral transtibial limb loss walk through loosely packed
pebbles of varying size after the alignment of their prosthesis has been re-aligned by 4 and 8
degrees of internal rotation and 4 and 8 degrees of external rotation, the individual will
compensate by decreasing walking speed and step length, and increasing step width.
There will also be changes in peak axial force caused by the changes in alignment when
an individual with unilateral transtibial limb loss walks through loosely packed pebbles of varying
size.
Delimitations and limitations
The results of this study may be generalized to apparently healthy adult unilateral
7
length to contain the iPecs prosthetic force transducer unit, and who are also able to
comfortably walk a distance greater than 50 meters and have had their prosthesis for longer
than one year. The results do not necessarily apply to individuals with unilateral transtibial limb
loss who currently experience pain associated with wearing their prosthesis or have any other
orthopedic impediments, nor do they necessarily apply to individuals with other levels of
amputation, such as trans-femoral.
We recognize there are different reasons for amputation and time frames associated
with limb loss, limited funds and sample size, as well as equipment issues. Also, the
conclusions of this study are observations of the subjects used and must not be generalized to
the rest of the population. Therefore, this study has inherent limitations associated with it.
Definitions
Unilateral Trans-Tibial Limb Loss: an amputation occurring only on one leg and below
the knee.
Contralateral Limb: limb without the amputation, intact limb.
Step Length: the distance one foot moves ahead of the other foot during the gait cycle.
Step Width: also walking base or base of support; the side-to-side distance between the
line of two feet, usually measured at the midpoint of the back of the heel.
Walking Speed: the distance covered by the whole body in a given time, measured in
meters per second.
Medial: towards the midline of the body.
Lateral: away from the midline of the body.
Peak Axial Force: the upward force applied by the ground to the foot, in response to the
8
II. Background
There have been a number of studies performed pertaining to prostheses giving us the
current knowledge we have about the ideal transtibial prosthesis alignment and how it varies
among individuals and that optimal alignment allows the individual to go about life in a more
secure, comfortable, and efficient manner. However, many of them consider the individual and
their prosthesis in either a stationary manner or walking on level ground. The amount of
knowledge currently available involving the individual’s prosthetic alignment, and in particular,
while the individual is walking over uneven terrain, is not quite as vast. Being so, it is necessary
to study individuals with limb loss and how uneven terrains influence the alignment of their
prosthesis. Achieving this will help us understand how clinicians can ensure comfort, stability,
and efficiency; not only on the ipsilateral side, but also on the contralateral side and throughout
the rest of the body.
If we first look at normal human locomotion with lower limbs intact, a better
understanding of what this study is attempting to accomplish can be achieved. Walking
coordinates multiple systems simultaneously, specifically the neurological, sensorimotor,
musculoskeletal, and visual–vestibular systems. Therefore, normal gait profiles can be used as
a reference point for disability assessment, intervention, and treatment (M. Chiu and M. Wang,
2007). Previous studies found that when individuals without limb loss walk on inclines they tend
to have a slower cadence and longer strides, and while they walk on downhill sloped surfaces,
they tend to use shorter stride lengths and a faster cadence (K. Kawamura, A. Tokuhiro, and H.
Takechi 1991; J. Sun, M. Walters, N. Svensson, and D. Lloyd, 1996). Leroux et al. (2002)
investigated postural adaptations when walking on smooth but non level surfaces, such as
9
trunk within their base of support in order to maintain a balanced center of gravity; however,
during walking, the trunk is shifted slightly ahead of the center of gravity in order to assist in
forward motion propulsion. They also explain that lower limb deficits have the potential to cause
more pronounced adaptations at the trunk and pelvis in order to maintain balance while walking
uphill and downhill. At the conclusion of their study, they clarify how “postural adaptations are
task-specific and the control requirements are different between standing and walking
conditions on an inclined surface.” With this being said, it is reasonable to also suggest that
walking on uneven terrains would require another task-specific postural adaptation since it also
has different control requirements. Normal walking requires the individual to use his or her
systems together in order to maintain a sense of security. Individuals with limb loss have some
of their systems deficient in both efferent and afferent messaging and therefore have to adapt
and compensate for those deficiencies first and then for the rest of the information being sent
throughout the rest of the body.
Before any dynamic alignments can be done, it is necessary for individuals with
trans-tibial limb loss to first have the prosthesis fitted adequately to the residual limb, including both
the alignment and tissue contact, in order to maintain both stability and walking flexibility (H.
Seelen, S. Anemaat, H. Janssen, and J. Deckers, 2003). Blumentritt et al. (1999) mentions
that prosthetic alignment has very little effect on muscle activity of the contralateral lower limb
during static standing. However, prosthetic alignment has a significant influence on the
amputee’s ipsilateral knee joint. In addition to methods of measuring static alignment, methods
for clinically measuring angular alignment are also necessary. These methods have been
explained as “shifts and tilts without a defined reference system” by Zahedi et al. (1986) after
the original method was developed at University of Strathclyde in 1978 that included an
10
angular alignment measurement system has been developed by way of a protractor that is“light,
simple to attach, easy to use and capable of accurately measuring angular alignment changes”
(G. Kerr, M. Saleh, and M. Jarrett, 1984). However, these methods are conducted while the
individual with limb loss is standing still, sitting or when the individual is not wearing the
prosthesis at all. After the prosthesis is properly fitted, the next step would be to align it
dynamically. This process involves the prosthetist watching the individual walk and using
feedback from the individual and his or her own subjective findings and determining the best
alignment. There are many methods for aligning prostheses in this manner, and for the most
part it depends on the preference of the prosthetist. As such, it is the job of the prosthetist to be
able to perceive what optimal alignment is during observation of the individual’s gait. They then
interpret the individual’s feedback and adjust the prosthesis as necessary (M. Zahedi, W.
Spence, S. Solomonidis, and J. Paul, 1986).
During dynamic aligning sessions, it has been found that when individuals with intact
limbs and individuals with prostheses were compared to each other after they walked overlevel
and uneven ground, ascended and descended stairs, and ascended and descended ramps, the
individuals with unilateral trans-tibial limb loss produced stability parameter values that were
higher, or less stable, on the contralateral side and lower values, or more stable, on the
ipsilateral side (C. Kendell, E. Lemaire, N. Dudek, J. Kofman, 2010). In other words, the limb
with the prosthesis was more stable than the limb that was still intact. Kendell et al. concluded
by stating “the prosthetic limb had consistently lower outcomes, indicating a gait strategy that
optimizes dynamic stability on the prosthetic limb and adaptation by the intact limb.” There is
agreement that the body compensates for the lack of the lower limb throughout the rest of the
body, both muscularly and skeletally. And that this possibly has degenerative effects on the
11
imbalances, and disturbances in the musculoskeletal, neuromuscular, and sensorimotor
systems (D. Sanderson and P. Martin, 1996; L. Fang, X. Jia, and R. Wang, 2007; R. Andres and
S. Stimmel, 1990). For these reasons, it is important to learn what is happening throughout the
rest of the body during movement over uneven terrain since it is probable that uneven surfaces
could be used more frequently than even terrains, depending on the individual’s lifestyle.
What could complicate these ideas further is that while the individuals with limb loss walk
on slopes, upstairs, and non-flat surface roads, pressures at the socket interface are neither
uniformly distributed nor proportionately applied (P. Dou, X. Jia, S. Suo, R. Wang, and M.
Zhang, 2006). This may be dependent on the type of non-level surfaces used; for example, a
non-level but stable surface, like asphalt or grass, versus a surface that is not only uneven but
also gives way, like sand or gravel. We are still learning about how uneven surfaces affect
individuals with limb loss and with this study, we are attempting to build on what is already
known by adding the element of an uneven surface so that we can potentially provide helpful
alignment information to the prosthetist on achieving a satisfactory gait on both level and
uneven surfaces.
III. Method
Subjects
3 volunteer adults with unilateral transtibial limb loss between the ages of 18 and 65,
with adequate pylon length, who can walk comfortably and unassisted for at least 50 meters and
have no apparent health issues were recruited for this study. The amputation must have
occurred at least twelve months prior to study. Volunteers who have other orthopedic
impediments or current pain associated with wearing their prosthesis were excluded. All
12
questionnaire (Appendix B), an activity questionnaire (Appendix C), and were compensated for
their time with $40.
Instrumentation
Kinematic data of the lower body was collected via the lower body marker system with
Plug-in-Gait by the Vicon Workstation and Nexus system (Oxford Metrics, Oxford, England).
Passive reflective markers were used on the lower body and were located on the left and right
posterior superior iliac spine, left and right anterior superior iliac spine, both thighs on the lateral
side, both knees on the lateral side at the axis of rotation, both tibias on the lateral side, each
lateral malleolus, heel of each foot, and the second metatarsal head of each foot. Kinetic data
were collected with an iPecs prosthetic force transducer unit (College Park Industries, Fraser,
Michigan) which was inserted into the pylon of each subject’s prosthesis. The equipment in the
Human Movement Lab at Georgia Tech included six Vicon M2 cameras with 1.3 Megapixel
resolution at a capture rate of 120 Hz. The data were processed and analyzed using Vicon
Nexus Plug in Gait version 1.7.1 and Polygon version 4.0.
Procedures
The subjects and their prosthesis were examined by Robert Kistenberg, Licensed and
Certified Prosthetist, and their personally defined optimized alignment was marked as 0, or
neutral. All alignment changes were based on an alignment consistency plan of using two
rotation increments and four rotation increments of the pylon adapter away from the neutral
mark both internally and externally for 4 and 8 , respectively. The subjects also stood with
their heels lined up against a level board and had the inside line of their shoe traced onto a
large piece of paper. After the subject moved from the paper, a straight line was drawn using a
13
each of the alignment changes, five lines total. We then measured the angle of the neutral line
and the first or second lines to ensure the angles were 4 and 8 degrees.
We began with the subjects walking normally with their prosthesis at their optimized
alignment along the even pathway (Figure 1) and then the uneven pathway (Figures 2 and 3)
second; both pathways were 3.66 meters long. The rest of the eight alignment changes were
tested in random order. There were five trials per condition, after the first and fifth trials the
subject was asked to give a level of comfort associated with the condition; the rating was based
on a scale from 0 to 10, with zero being “worst possible” and 10 being “best ever” (Appendix D).
After all the trials were completed, the individuals’ original prosthesis alignments were restored
and the iPecs unit was removed from their prosthesis pylons.
[image:14.612.72.214.350.565.2]
Figure 1: Even surface pathway Figure 2: Various sized Figure 3: Uneven surface pathway. taped off and bordering the built in pebbles used for the uneven
tan colored walkway. surfacepathway.
[image:14.612.395.540.353.543.2]14
A descriptive analysis was done rather than a statistical analysis due to the size
constraints necessary for the statistical analysis. The variables analyzed were step length, step
width, walking speed, and the peak axial force of each step. There were three subjects with five
condition changes (4 and 8 degrees of external rotation, 4 and 8 degrees of internal rotation,
and self-selected neutral) per subject, five trials per condition, and five steps per trial. We used
the average of all five steps per trial and all five trials per subject. Each graph consisted of only
one subject and comparisons were made among the five conditions first and between the
subjects second.
The following outcome measures were analyzed using bar graphs:
• Step width, measured as the distance between the heel markers on each
foot.
• Step Length, the right step length was measured from the toe off of the
left foot to the initial contact of the right foot and left step length was
measured from the toe off of the right foot to the initial contact of the left
foot.
• Walking speed, calculated from the time it took the individuals to walk the
distance of 3.66 meters.
• Peak axial force, representing the maximum value from the iPecs
transducer for each step.
Each variable was averaged across all 25 steps for each condition.
15
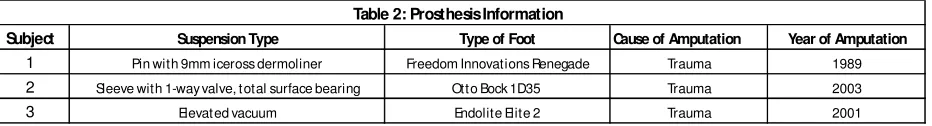
This was a descriptive study of three subjects (n=3, 1 female, 2 male) with unilateral
transtibial limb loss between the ages of 18 and 65 participated in this study (Table 1). All
subjects had different prosthesis suspensions and feet and have had their prostheses for more
than one year (Table 2). The variability of the conditions was representative of the differences
among all the trial conditions, not each individual condition; and the changes in each of the four
variables, step length, walking speed, step width, and peak axial force, were described as the
uneven terrain with relation to the even terrain.
Subject Gender Age Height, cm Weight, kg BMI
1 Male 61 180.34 100.45 30.9
2 Female 47 170.18 90.91 31.4
3 Male 42 177.8 94.09 29.8
Side of Prosthesis
Left Left Right
Table 1: Subject Information
Subject Type of Foot Cause of Amputation
1 Freedom Innovations Renegade
2 Otto Bock 1D35
3 Endolite Elite 2
[image:16.612.77.543.369.432.2]2003 2001
Table 2: Prosthesis Information
Suspension Type Year of Amputation
Pin with 9mm iceross dermoliner Sleeve with 1-way valve, total surface bearing
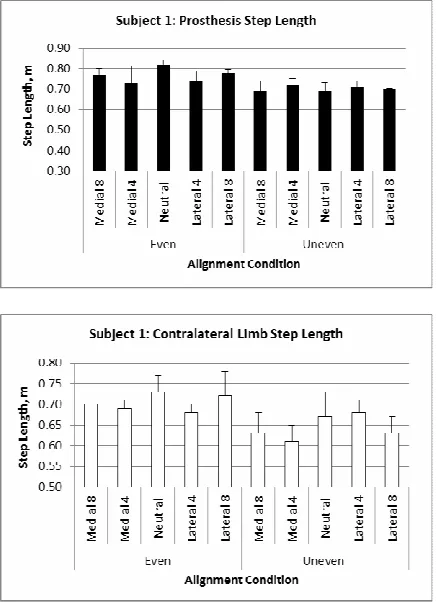
Elevated vacuum Trauma Trauma Trauma 1989 Subject 1: Kinematics
On the prosthesis side, there was a decrease in step length on the uneven surface
among all five alignment condition changes with the average step length being 0.70m ± 0.01,
compared to the average step length on the even surface which was 0.77m ± 0.04 (Figure 4).
The contralateral side also had a decreased average step length, 0.64m ± 0.03, on the uneven
16
Figure 4: Subject 1, Average Prosthesis Step Length. Figure 5: Subject 1, Average Contralateral Step Length.
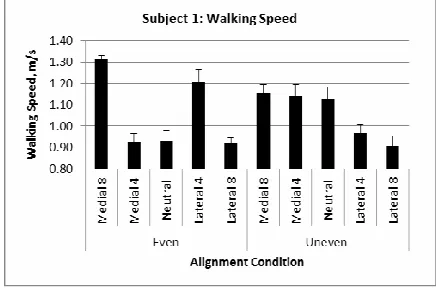
Average walking speed was maintained at the same pace on both the uneven surface
and the even surface, however, the speed was more consistent on the uneven surface, 1.06m/s
17
Figure 6: Subject 1, Average Walking Speed.
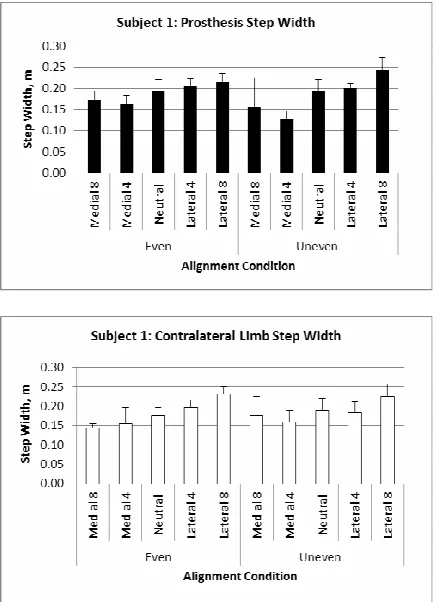
Both the prosthesis and the contralateral average step widths did not distinctly increase
on either the even or the uneven surfaces. Instead, there tended to be an overall increase from
the medial alignment changes to the lateral alignment changes on both the even and the
uneven surfaces. The average prosthesis step width on the even surface was 0.19m ± 0.02 and
on the uneven surface was 0.18m ± 0.04 (Figure 7). The average contralateral step width on
18
Figure 7: Subject 1, Average Prosthesis Step Width. Figure 8: Subject 1, Average Contralateral Limb Step Width.
Kinetics
Peak Axial Force decreased and stayed more consistent on the uneven surface than on
the even surface, where the average neutral alignment and lateral 8 alignments both brought
higher values, 1271.93 N and 1195.88 N, respectively. The average neutral alignment on the
even surface was the highest value at 1272.93 N, and the average neutral alignment on the
uneven surface was the lowest at 968.84 N. Overall, the average force for the even surface is
1136.48 N ± 93.72, and for the uneven surface is 1043.88 N ± 44.67 (Figure 9).
19
Figure 9: Subject 1, Average of the Peak Axial Force of all the steps for each condition.
Subject 2:
Kinematics
Both the prosthesis and the contralateral average step length decreased while walking
on the uneven surface. The prosthesis average was 0.94m ± 0.09 on the uneven surface and
1.11m ± 0.05 on the even surface (Figure 10). The contralateral average was 0.91m ± 0.07 on
20
Figure 10: Subject 2, Prosthesis Step Length. Figure 11: Subject 2, Contralateral Limb Step Length.
Average walking speed decreased to 0.72m/s ± 0.07 on the uneven surface from .99m/s
[image:21.612.72.290.72.375.2]± .05 on the even surface (Figure 12).
[image:21.612.198.416.509.653.2]21
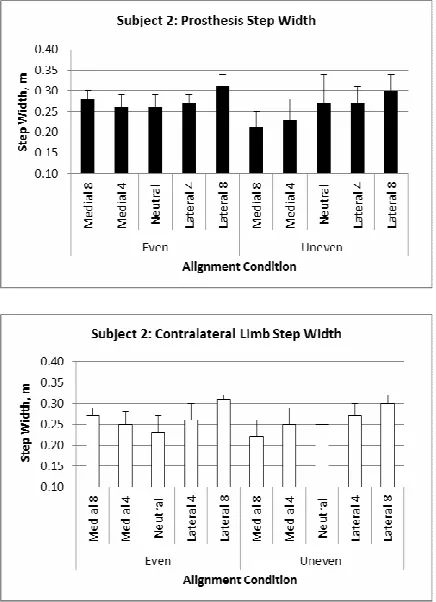
On the even surface, average step width gradually increased with each alignment
change; neutral alignment was the narrowest and the 8 medial and lateral changes brought
the largest widths. Prosthesis step width on the even surface started with neutral at 0.26m,
increased to 0.27m ± 0.01 with the 4 alignment changes, and increased again to 0.30m ± 0.02
with the 8 alignment change. On the uneven surface, there was a gradual increase in width
from the medial 8 alignment to the lateral 8 alignment; the average was 0.26m ± 0.04 (Figure
13). The contralateral side follows the same trends on both the even and uneven surfaces. On
the even surface, average step width started with neutral at 0.23m, increased to 0.26m ± 0.01 at
the 4 alignment change, and increased again to 0.29m ± 0.03 at the 8 alignment change.
The uneven surface brought a gradual increase in width beginning with the medial 8 alignment
and moving towards the lateral 8 alignment; the average was 0.26m ± 0.03 (Figure 14). Both
the prosthesis and the contralateral average step widths follow the same trends, the
contralateral side has the same width for both the even and the uneven surface, 0.26m ± 0.03.
The prosthesis side was slightly higher on the even surface than on the uneven surface, 0.28m
22
Figure 13: Subject 2, Prosthesis Step Width. Figure 14: Subject 2, Contralateral Limb Step Width.
Kinetics
The average peak axial force for all the steps for each trial condition gradually increased
on the even surface from the medial 8 alignment at 893.47 N ± 36.81 to the lateral 8
alignment at 972.13 N ± 27.73. The alignment conditions on the uneven surface followed a
similar trend, though there was a smaller range in values and with the exception of the medial
4 alignment value, which was 859.28 N ± 68.28; medial 8 alignment was 920.9 N ± 75.49
23
Figure 15: Subject 2, Average Peak Axial Force of all steps per condition.
Subject 3:
Kinematics
Average prosthesis step length on the even surface was higher than the average step
length on the uneven surface, 1.32m ± 0.05 and 1.19m ± 0.07, respectively. On the uneven
surface, step length decreased gradually from the neutral alignment to the medial and lateral 8
alignments; starting with neutral at 1.28m, decreased to 1.20m ± 0.05 at the 4 alignment
change, and decreased again to 1.14m ± 0.04 at the 8 alignment change (Figure 16). The
contralateral side stays relatively consistent on the even surface with an average of 1.33m ±
0.04, and then follows the same trend as the prosthesis side on the uneven surface. The
average neutral alignment step length was 1.28m; it decreased to 1.16m ± 0.06 at the 4
24
Figure 16: Subject 3, Prosthesis Step Length. Figure 17: Subject 3, Contralateral Limb Step Length.
Average walking speed decreased from the even surface to the uneven surface, 1.21m/s
± 0.03 and 0.94m/s ± 0.11, respectively. The speed was more consistent on the even surface
and the trend on the uneven surface decreased gradually from neutral, 1.08m/s, to 0.98m/s ±
[image:25.612.72.290.71.372.2]25
Figure 18: Subject 3, Walking Speed.
Average step width was maintained more consistently on the even surface for both the
prosthesis and contralateral sides, with both averaging 0.21m ± 0.01. The prosthesis side on
the uneven surface gradually increased from neutral at 0.19m, to 0.22m ± 0.02 at the 4
alignment, and to 0.26m ± 0.01 at the 8 alignment (Figure 19). The trend continued on the
contralateral side where neutral started at 0.19m, increased to 0.23m ± 0.02 for the 4
alignments, and increased again to 0.25m ± 0.0 for the 8 alignments (Figure 20). Overall step
width average was the same on the even surface for both the prosthesis and the contralateral
sides, 0.21m ± 0.01; and it was also the same on the uneven surface for both the prosthesis
26
[image:27.612.72.290.71.372.2]
Figure 19: Subject 3, Prosthesis Step Width. Figure 20: Subject 3, Contralateral Limb Step
Length.
Kinetics
The average peak axial force for all the steps in each condition gradually decreased in
force on the even surface from the medial 8 alignment, 1408.44 N ± 59.62, to the lateral 8
alignment, 1047.61 N ± 42.85. The uneven surface condition forces produced ranged from
1051.91 N ± 68.68 to 1307 N ± 43.9, with the exception of the lateral 4 alignment which
27
Figure 21: Subject 3, Average Peak Axial Force of all Steps per Condition
Comparison amongst All Subjects
Kinematics
When all three subjects were compared, the average walking speed was higher on the
even surface and decreased on the uneven surface (Figure 22).
Figure 22: All Subjects, Average walking speed for separated even and uneven surfaces.
Average prosthesis step width ranged from 0.21m to 0.24m on the even surface and
from 0.19m to 0.27m on the uneven surface (Figure 23). The contralateral limb step width
[image:28.612.199.415.413.554.2]28
being from 0.2m to 0.25m and the uneven surface range being from 0.21m to 0.26m (Figure
24).
[image:29.612.73.290.144.454.2]
Figure 23: All Subjects, Prosthesis Step Width Figure 24: All Subjects, Contralateral Limb Step Width separated for even and uneven surfaces. separated for even and uneven surfaces.
Average prosthesis step length decreased on the uneven surface with a range of 0.88m
to 0.98m compared to 1.04m to 1.13m on the even surface (Figure 25). The average
contralateral limb step length also decreased on the uneven surface with a range of 0.82m to
29
Figure 25: All Subjects, Prosthesis Step Length Figure 26: All Subjects: All Subjects, Contralateral separated for even and uneven surfaces. Limb step length separated for even and uneven
surfaces.
Kinetics
The average peak axial force followed opposite trends during the medial 8 and medial
4 alignments, and then followed similar trends during the neutral, lateral 4 and lateral 8
alignments for both surfaces. The range for the even surface was 1020.82 N to 1149.26 N, and
30
Figure 27: All Subjects, Average Peak Axial Force. Dorsiflexion moment of the foot.
Rate of Comfort
Subject 1 had a rate of comfort range of five to ten, Subject 2’s range was four to ten,
and Subject 3’s was one to ten (Table 3).
Trial 1 Trial 5 Trial 1 Trial 5 Trial 1 Trial 5
9 9 4 4 6 6
9 9 10 10 8 8
10 10 10 10 10 10
9 9 6 6 6 7
9 9 5 5 4 6
7 6 7 7 3 3
7 7 10 9 6 6
5 6 10 10 7 7
8 8 7 7 5 4
7 7 4 4 2 1
UNM8 UNM4 UN00 UNL4 UNL8 Condition EVM8 EVM4 EV00 EVL4 EVL8
Table 3: Rate of Comfort
Subject 1 Subject 2 Subject 3
Alignment After After After
[image:31.612.114.501.358.573.2]31
None of the subjects led sedentary lifestyles; they were all active throughout the week to
[image:32.612.70.510.122.244.2]some degree (Table 4).
Table 4: Physical Activity Questionnaire
Subject Types of Activity Frequency Duration, min/occurrence
1 bike riding, minimal walking, gardening 5-6x/week 60
2 walking, agility trials with dog 2x/day 30
3 running, cycling 1-3x/week 60
X. Discussion
All subjects were given little time to adjust to their new alignments to ensure any
compensation was collected in the data. The only chances they had to become adjusted were
walking from the chair where their alignment was changed to one of the paths, and then when
there was a change in the surface. The surfaces and alignments were intentionally randomly
selected so as to ensure acute responses, similar to a dynamic alignment session at a
prosthetist’s office. They were all very relaxed throughout the data collection and followed the
directions very well.
Subject 1
A male who weighed 100.45kg, had a height of 180.43cm, and had a left limb prosthesis.
Subject 1 decreased his step length on the uneven surface with both the prosthesis and
the contralateral limb. In this instance, both medial and lateral alignment changes resulted in the
expected pattern. The 8 alignments were expected to and did result in shorter step lengths
and the 4 alignments were expected to have longer step lengths, which they also did.
32
than the 4 alignments, which was unexpected and interesting since the uneven surface neutral
alignment trial occurred immediately after the even surface neutral alignment trial and they were
the first two trials completed. Walking speed did not decrease when the subject walked on the
uneven surface; it actually stayed the same as the walking speed on the even surface. In fact,
the speed on the uneven surface was maintained more consistently than the speed on the even
surface, which was also unexpected. The increased consistency on the uneven surface might
have been expected as a sign of a safer, more cautious gait, however, without an overall slower
walking speed as well, it does not make sense. Step width stayed about the same among all
the alignment changes and both surfaces. There was not the expected increase on the uneven
surface. Instead, on the prosthesis side, the average step width was 0.19m on the even surface
and 0.18m on the uneven surface. The contralateral limb was the opposite with .18m on the
even surface and 0.19m on the uneven surface. The two levels degree changes for the medial
and lateral alignments did not seem to have an effect on the step width for this subject. Peak
axial force was more consistent on the uneven surface than on the even surface where both the
lateral alignments brought the higher forces.
He reported the highest overall scores on the rate of comfort scale and interestingly, his
lowest scores on the scale were associated with the neutral alignment on the uneven surface. It
could be possible his alignment was not optimal and we only learned of it by his walking on the
uneven surface. Subject 1 was the only one who did not have the highest values at neutral on
the uneven surface. He was also fairly active in his daily life, taking care of the house and yard,
and looking after his grandson.
Subject 2
33
The graphs show the same basic shape for the uneven versus even surfaces on all
three kinematic variables. Step length did decrease for both the prosthesis and the contralateral
limb on the uneven surface. Step width decreased on the uneven surface as well. On the
contralateral limb the width ultimately stays the same for both surfaces. This was interesting
since the widths on the even surface followed the expected pattern and the widths on the
uneven surface gradually increased from medial 8 to lateral 8 . The prosthesis side step
width was larger on the even surface, but more variable on the uneven surface, which might
show how adjustments are necessary to work with the alignment and then to also navigate
uneven surfaces more safely. The uneven surface peak axial force was more variable than the
forces produced on the even surface, which potentially showed the adjustments to the pebbles
She reported the lowest scores on the rate of comfort scale for the even medial 8 and
the uneven lateral 8 alignments. Her highest scores were recorded for both the even surface
neutral alignment and the even surface medial 4 alignment. She stays moderately active by
practicing agility trials with her dog.
Subject 3
A male who weighed 94.09kg, had a height of 177.8cm, and had a right limb prosthesis.
Step length did decrease on the uneven surfaces for both the prosthesis side and the
contralateral limb. The contralateral limb produced results that were more expected than the
prosthesis did, which changed very little. Step width increased on the uneven surfaces in the
expected manner and was also more variable than the even surface. Walking speed decreased
on the uneven surface and showed the expected results between the neutral, 4 and 8
alignments. Peak axial force was more variable on the uneven surface, especially with the
34
is no video recorded of the trials, so I was unable to go back and look to see if something
happened.
This was the only subject whose results produced what was expected. On even terrain
he was able to maintain step length, walking speed, and step width consistently, but when the
uneven terrain was factor, the different alignments caused him to compensate by reducing step
length and walking speed and increasing step width.
Subject 3 reported the lowest scores on the rate of comfort scale at the uneven lateral
8 alignment. His highest scores were recorded on the even surface neutral alignment. While
his activities were less frequent than the other two subjects, they were more intense.
All Subjects
The variability within each condition produced no patterns. We are unable to determine
if there was a particular condition was more consistent or less consistent both in the overall
results and individually.
The lack of symmetry, between the even and the uneven surfaces could have been
caused by the compensations the individuals used to navigate the uneven surface. In the
instance of Subject 2, where the even and the uneven surfaces where symmetrical in shape, but
the uneven surface results were overall lower than the even surface results, the symmetry could
have been caused by an overall compensation to the uneven surface; not the graduated
compensations expected, as in Subject 3’s results.
With only three subjects it’s difficult to determine whether pattern was evident and if
threshold between the 4 and 8 alignments were there. Also, the one female may have
skewed the data since females tend to have slightly different parameters than males. I think
35
pattern and threshold are achieved, to do the same study with individuals with intact lower
limbs, and the same study again with individuals with transfemoral prostheses. There could
have been different factors that affected the results of this study; for instance, the age, physical
fitness, body mass index, and outdoor activities the individuals were familiar with. Compared to
subjects 1 and 2, subject 3 was the youngest and had the lowest body mass index. This may
have accounted for the results he produced.
Conclusion
The use of the two levels of alignment changes, 4 and 8 , was expected to help
distinguish a threshold angle in which the compensations were no longer able to be masked.
The pattern being the neutral alignment would be the highest value for step length and walking
speed. Then the 4 changes would bring similar, but slightly lower values to the neutral
alignment, and the 8 changes would bring the lowest values of all the alignments. The
opposite would be the pattern for step width. Individually, this pattern occurred with subject 3 on
step length, step width, and walking speed and subject 2 on the contralateral step length.
Overall, the data supported this pattern for the average of all the subjects for the step length,
both on the prosthesis side and the contralateral limb. Step width and walking speed did not
follow the same pattern.
Qualitatively, the hypotheses was supported for the step length, step width, and walking
36
remained the same for both the even and the uneven surfaces. The hypothesis was also
supported for peak axial force. However, a larger number of subjects would be needed to
determine if the changes were in fact significant. I would not recommend anything changing in
the current alignment process until a more thorough similar study has been conducted.
Acknowledgments
I would like to thank Robert Kistenberg for being the prosthetist for this study and helping
to recruit subjects, Ricky Mehta for his help with scheduling the lab and Vicon technology
support, Boris Prilutsky for the use of his lab, and Scott French for iPecs technology support.
37
References
Andres, R. O., & Stimmel, S. K. (1990). Prosthetic alignment effects on gait symmetry: a case study. Clinical biomechanics, 5(2), 88-96. doi: 10.1016/0268-0033(90)90043-6.
Berme, N., Purdey, C. R., & Solomonidis, S. E. (1978). Measurement of prosthetic alignment. Prosthetics and orthotics international, 2(2), 73-75.
Blumentritt, S., Schmalz, T., Jarasch, R., & Schneider, M. (1999). Effects of sagittal plane prosthetic alignment on standing trans-tibial amputee knee loads. Prosthetics and orthotics international, 23(3), 231-238.
Chiu, Min-Chi, & Wang, Mao-Jiun. (2007). The effect of gait speed and gender on perceived exertion, muscle activity, joint motion of lower extremity, ground reaction force and heart rate during normal walking. Gait & posture, 25(3), 385-392. doi:
10.1016/j.gaitpost.2006.05.008
Dou, Peng, Jia, Xiaohong, Suo, Shuangfu, Wang, Rencheng, & Zhang, Ming. (2006). Pressure distribution at the stump/socket interface in transtibial amputees during walking on stairs, slope and non-flat road. Clinical biomechanics, 21(10), 1067-1073.
Fang, Lidan, Jia, Xiaohong, & Wang, Rencheng. (2007). Modeling and simulation of muscle forces of trans-tibial amputee to study effect of prosthetic alignment. Clinical
biomechanics, 22(10), 1125- 1131. doi: 10.1016/j.clinbiomech.2007.07.017.
Geil, Mark D. (2002). Variability among Practitioners in Dynamic Observational Alignment of a Transfemoral Prosthesis. JPO: Journal of Prosthetics and Orthotics, 14(4), 159-164.
Geil, M. D., & Lay, A. (2004). Plantar foot pressure responses to changes during dynamic trans-tibial prosthetic alignment in a clinical setting. Prosthetics and orthotics international, 28(2), 105-114.
Kawamura, K., Tokuhiro, A., & Takechi, H. (1991). Gait analysis of slope walking: A study on step length, stride width, time factors and deviation in the center of pressure. Acta Med Okayama, 45,179–184.
Kendell, C., Lemaire, E. D., Dudek, N. L., & Kofman, J. (2010). Indicators of dynamic stability in transtibial prosthesis users. Gait & posture, 31(3), 375-379.
38
Leroux, Alain, Fung, Joyce, & Barbeau, Hugues. (2002). Postural adaptation to walking on inclined surfaces: I. Normal strategies. Gait & posture, 15(1), 64-74. doi: 10.1016/s0966-6362(01)00181-3
Rietman, J. S., Postema, K., & Geertzen, J. H. B. (2002). Gait analysis in prosthetics: Opinions, ideas and conclusions. Prosthetics and orthotics international, 26(1), 50-57. doi:
10.1080/03093640208726621
Sanderson, David J., & Martin, Philip E. (1997). Lower extremity kinematic and kinetic
adaptations in unilateral below-knee amputees during walking. Gait & posture, 6(2), 126-136. doi: 0.1016/s0966-6362(97)01112-0.
Seelen, H. A. M., Anemaat, S., Janssen, H. M. H., & Deckers, J. H. M. (2003). Effects of prosthesis alignment on pressure distribution at the stump/socket interface in transtibial amputees during unsupported stance and gait. Clinical rehabilitation, 17(7), 787-796.
Sun, J., Walters, M., Svensson, N., & Lloyd, D. (1996). The influence of surface slope on human gait characteristics: A study of urban pedestrians walking on an inclined surface.
Ergonomics, 39, 677–692.
Whittle, Michael W. (2007). Gait Analysis, An Introduction (4th ed.). China: Butterworth Heinemann Elsevier.
39
42
43
48
Appendix D