ScholarWorks @ Georgia State University
ScholarWorks @ Georgia State University
Real Estate Dissertations Department of Real Estate
8-7-2012
A Multi-Factor Probit Analysis of Non-Performing Commercial
A Multi-Factor Probit Analysis of Non-Performing Commercial
Mortgage-Backed Security Loans
Mortgage-Backed Security Loans
Philip Seagraves Georgia State University
Follow this and additional works at: https://scholarworks.gsu.edu/real_estate_diss
Recommended Citation Recommended Citation
Seagraves, Philip, "A Multi-Factor Probit Analysis of Non-Performing Commercial Mortgage-Backed Security Loans." Dissertation, Georgia State University, 2012.
https://scholarworks.gsu.edu/real_estate_diss/13
This Dissertation is brought to you for free and open access by the Department of Real Estate at ScholarWorks @ Georgia State University. It has been accepted for inclusion in Real Estate Dissertations by an authorized
i
Permission to Borrow
In presenting this dissertation as a partial fulfillment of the requirements for an advanced degree from Georgia State University, I agree that the Library of the University shall make it available for inspection and circulation in accordance with its regulations governing materials of this type. I agree that permission to quote from or to publish this dissertation may be granted by the author or, in his absence, the professor under whose direction it was written or, in his absence, by the Dean of the Robinson College of Business. Such quoting, copying, or publishing must be solely for scholarly purposes and must not involve potential financial gain. It is understood that any copying from or publication of this dissertation that involves potential gain will not be allowed without written permission of the author.
ii
Notice to Borrowers
All dissertations deposited in the Georgia State University Library must be used only in
accordance with the stipulations prescribed by the author in the preceding statement.
The author of this dissertation is:
Philip Anthony Seagraves 35 Broad Street N.W. Atlanta, GA 30303
The director of this dissertation is:
iii
A MULTI-FACTOR PROBIT ANALYSIS OF NON-PERFORMING COMMERCIAL
MORTGAGE-BACKED SECURITY LOANS
BY
PHILIP ANTHONY SEAGRAVES
Dissertation Submitted in Partial Fulfillment of the Requirements for the Degree
of
Doctor of Philosophy
in the Robinson College of Business
of
Georgia State University
GEORGIA STATE UNIVERSITY
ROBINSON COLLEGE OF BUSINESS
iv Copyright by
Philip Anthony Seagraves
v
ACCEPTANCE
This dissertation was prepared under the direction of Philip Anthony Seagraves’ Dissertation
Committee. It has been approved and accepted by all members of that committee, and it has been
accepted in partial fulfillment of the requirements for the degree of Doctor of Philosophy in
Business Administration in the College of Business Administration of Georgia State University.
H. Fenwick Huss, Dean
College of Business Administration
DISSERTATION COMMITTEE:
vi
ABSTRACT
A MULTI-FACTOR PROBIT ANALYSIS OF NON-PERFORMING COMMERCIAL MORTGAGE-BACKED SECURITY LOANS
By
Philip Anthony Seagraves
July 10, 2012
Committee Chair: Dr. Jonathan A. Wiley
Major Academic Unit: Real Estate
Commercial mortgage underwriters have traditionally relied upon a standard set of criteria for
vii
at the start of 2009 to 9.32% by the end of 20111 provides motivation for questioning
underwriting standards which previously served the lending industry well. This dissertation
investigates factors that affect the probability of Non-performance among commercial
mortgage-backed security (CMBS) loans, proposes conditions under which the standard ratios may not
apply, and tests additional criteria which may prove useful during economic periods previously
not experienced by commercial mortgage underwriters. In this dissertation, Cap Rate Spread, the
difference between the cap rate of a property and the Coupon Rate of the associated loan, is
introduced to test whether the probability of Non-performance can be better predicted than by
relying on traditional commercial mortgage underwriting criteria such as Loan to Value (LTV)
and Debt Service Coverage Ratio (DSCR). Testing the research hypotheses with a probit model
using a database of 47,883 U.S. CMBS loans from 1993 to 2011, Cap Rate Spread is found to
have a significantly negative relationship with loan Non-performance. That is, as the Cap Rate
Spread falls, the probability of Non-performance rises appreciably.
A numerical model suggests that among loans which would have passed the standard ratio tests
requiring loans to have values of LTV less than .8 and DSCR greater than 1.25, a Cap Rate
Spread criteria requiring loans to have a value greater than 1% would have prevented the
origination of an additional 1,798 CMBS loans reducing the rate of Non-performance from
14.9% with only the LTV and DSCR criteria to just 11.6% by adding the Cap Rate Spread
1 Moody’s Investor Service: U.S. CMBS loan delinquencies rise to 9.32%, Global Credit Research, New York,
viii
criteria. Of course, adding additional criteria will also lead to errors of rejecting loans which
would have performed well. Back testing with the same sample of CMBS loans, this Type I error
rate rises from 19% with only the LTV and DSCR criteria to 34% with the addition of the Cap
Rate Spread.
Ultimately, CMBS loan underwriters must individually determine an acceptable level of
Non-performance appropriate to their business model and tolerance for risk. Using intuition,
experience, tools, and rules, each underwriter must choose a balance between the competing
risks of rejecting potentially profitable loans and accepting loans which will fail. This research
result is important because it helps deepen our understanding of the relationships between
property income and loan performance and provides an additional tool that underwriters may
ix
TABLE OF CONTENTS
ABSTRACT ... vi
LIST OF TABLES ... xii
LIST OF FIGURES ... xiii
CHAPTER ONE - INTRODUCTION... 14
Background ... 14
Objectives of the Dissertation ... 21
Contribution of the Dissertation ... 22
Organization of the Dissertation ... 23
CHAPTER TWO – LITERATURE REVIEW ... 24
CMBS Background ... 24
Interest Rates ... 28
Additional Considerations ... 31
Alternative Approaches ... 35
Summary ... 36
x
CHAPTER THREE – DATA AND METHODOLOGY ... 39
Data ... 39
Methodology ... 42
Hypothesis 1 ... 46
Hypothesis 2 ... 51
Hypothesis 3 ... 52
Hypothesis 4 ... 52
Robustness Checks ... 54
CHAPTER FOUR – ANALYSIS OF RESULTS ... 56
Descriptive Statistics ... 56
Empirical Results ... 71
Cap Rate Spread: Full Sample ... 71
Cap Rate Spread: Fixed Rate Balloon Loans ... 74
Cap Rate Spread and Non-performance: Conservative Loans ... 79
Robustness Checks ... 80
xi
CHAPTER FIVE – NUMERICAL ANALYSIS ... 94
Applications ... 94
CHAPTER SIX – CONCLUSIONS AND IMPLICATIONS FOR FUTURE RESEARCH97
Conclusions ... 97
Future Research Directions ... 100
xii
LIST OF TABLES
Table 1 ■ CMBS Loan Status as of 3rd Quarter 2011 ... 15
Table 2 ■ Variables from the Bloomberg CMBS Loan Database and other sources. ... 40
Table 3 ■ Database Waterfall ... 42
Table 4 ■ Summary Statistics for Full Sample. ... 59
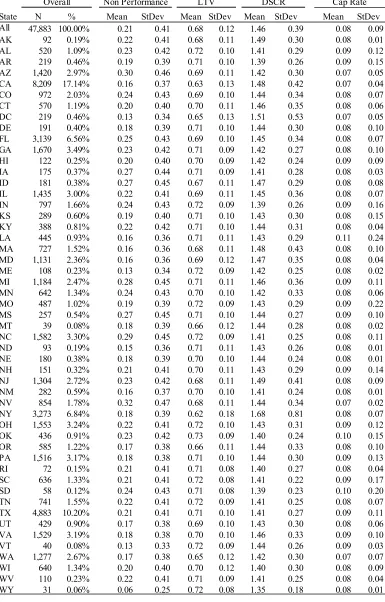
Table 5 ■ Summary Statistics by State. ... 61
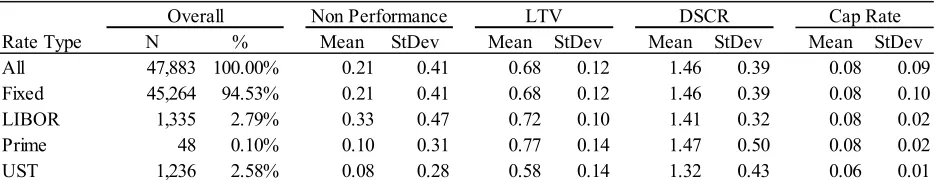
Table 6 ■ Summary Statistics by Rate Type. ... 62
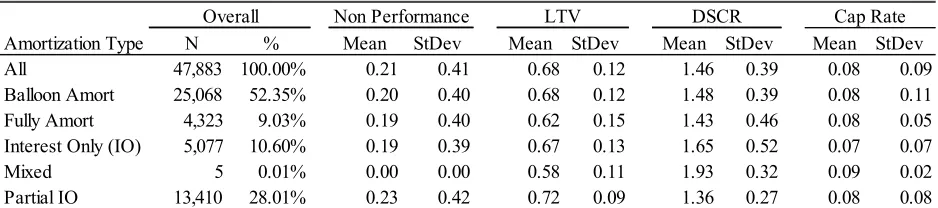
Table 7 ■ Summary Statistics by Amortization Type. ... 63
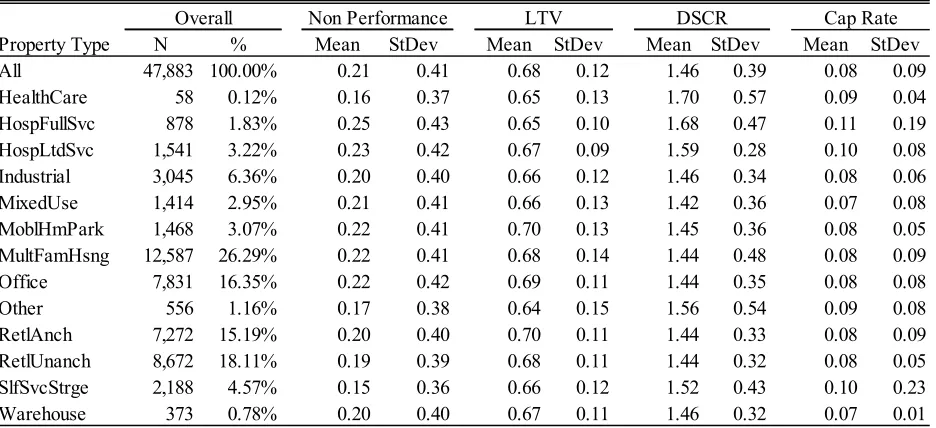
Table 8 ■ Summary Statistics by Property Type. ... 64
Table 9 ■ Summary Statistics by Originator. ... 66
Table 10 ■ Cap Rate Spread Model Results for LTV and DSCR. ... 74
Table 11 ■ Cap Rate Spread Model Results for Loan Groups. ... 78
Table 12 ■ Cap Rate Spread Model Results - LTV < .80 and DSCR > 1.25. ... 80
Table 13 ■ First Stage Model Results for Predicted Cap Rate Spread. ... 83
Table 14 ■ Second Stage Model Results for Predicted Cap Rate Spread. ... 84
Table 15 ■ Second Stage Model Results for Predicted Cap Rate Spread for loan groups. ... 86
Table 16 ■ Logistic Cap Rate Spread Model. ... 88
xiii
LIST OF FIGURES
Figure 1 ■ CMBS Loan Originations per Year ... 16
Figure 2 ■ Cap Rate Spread and Market Yield on 10-Year Treasuries ... 19
14
CHAPTER ONE - INTRODUCTION
Background
Standard underwriting models for commercial loans rely upon classic measures such as the size
of the loan relative to the value of the property (Loan to Value Ratio, LTV) and the ratio of net
income from the property to the size of the annual debt payments (Debt Service Coverage Ratio,
DSCR) for approving and pricing debt. LTV and DSCR are presented in equations (1) and (2)
respectively.
Loan to Value LTV = Original Loan Balance (LOAN)
Project Value (VALUE) (1)
DebtServiceCoverageRatio DSCR (2)
LTV is a widely used measure of loan risk and one of the most commonly cited features, along
with interest rates, used to describe individual deals and the general debt environment. As the
loan amount approaches or surpasses the value of the underlying asset, the default risk increases.
This risk is also a function of other factors such as the experience of the borrower, the type of
project, geography, the state of the economy, and competition.
DSCR is also an important criterion used by loan underwriters to determine the riskiness of a
loan. This measure provides a simple indicator of a borrower’s ability to continue making their
debt payments in the face of reduced rental income or increased expenses. As the DSCR rises,
the borrower has a greater cushion against rent pressures, tenant turnover, unexpected expenses,
15
ability of DSCR to provide a valuable risk screening function may be related to other economic
factors such as market interest rates.
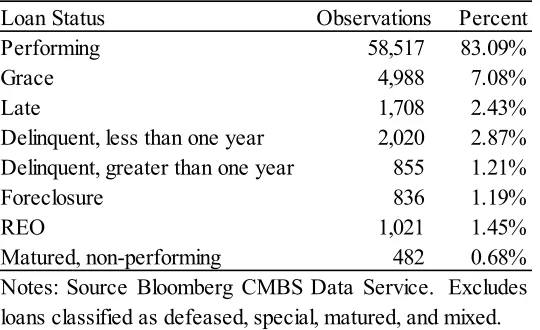
From 2009 to 2011, the rate of default for commercial mortgages rose significantly. An indicator
[image:16.612.74.344.258.423.2]of future default rates, 17% of the CMBS loans in the Bloomberg database2 on September 15, 2011, were classified as “non-performing” (See Table 1).
Table 1 ■ CMBS Loan Status as of 3rd Quarter 2011
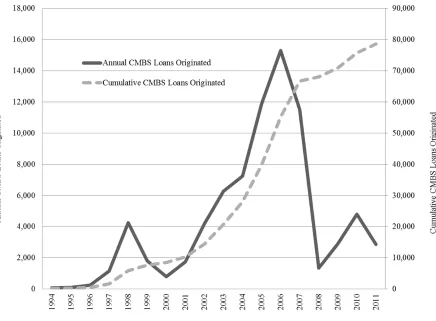
Figure 1 presents annual CMBS loan originations from 1994 through late 2011. During the
high-growth period for CMBS in the mid-2000s through the subsequent market crash, underwriters
continued to rely upon LTV and DSCR to determine the risk of loans.
2 Database including some observations subsequently eliminated for final analysis due to missing data. Final sample
size after cleaning includes 47,883 observations.
Loan Status Observations Percent
Performing 58,517 83.09%
Grace 4,988 7.08%
Late 1,708 2.43%
Delinquent, less than one year 2,020 2.87% Delinquent, greater than one year 855 1.21%
Foreclosure 836 1.19%
REO 1,021 1.45%
16
Figure 1 ■ CMBS Loan Originations per Year
LTV and DSCR provide useful but limited help in determining the risks of CMBS loans. Perhaps
other measures can aid in the analysis. Another important consideration may be the yield of real
estate projects relative to their loan value or total project value. While LTV and DSCR measures
are value/value or cash flow/cash flow measures respectively, a debt or Cap Rate measure
provides a cash flow/value view which may be sensitive to economic conditions such as interest
rates. If the overall yield of a project on either the debt or total cost is high, it is likely be that
loans experience less stress through a range of economic conditions. In this dissertation, three
alternative measures are considered, including the Debt Yield, Cap Rate, and the Cap Rate
17
Debt Yield (DYLD)= Net Operating Income (NOI)
Original Loan Balance (LOAN) (3)
Cap Rate (CAPRT) =Net Operating Income (NOI)
Project Value (VALUE) (4)
Cap Rate Spread (SPREAD) = CAPRT – Coupon, (5)
where Coupon is the net coupon rate on the loan. If LTV and DSCR were limited in their ability
to predict loan default leading up to the recent market crash, perhaps their usefulness declined as
interest rates fell. If so, other measures such as Debt Yield, Cap Rate, and the Cap Rate Spread
may have emerged as important criteria in assessing risk and should be used to complement
other methods and improve overall default prediction reliability. It can be shown that Debt Yield,
as defined above, is simply the Cap Rate divided by the LTV at origination for the loan. A
simple example makes the connection quite clear: a project valued at 100 with a loan of 70 will
have a LTV of .7 and, if the NOI is 10, the Cap Rate will be .1 and the Debt Yield .14 calculated
as either 10/70 or .1/.7. Acknowledging that both Debt Yield and Cap Rate may provide further
insights into the factors related to CMBS loan performance, I focus on the measure Cap Rate
Spread for the remainder of this dissertation.
During the critical phase of CMBS history beginning in the mid-1990s through today, interest
rates have experienced periods of both falling and rising and have dropped to less than half of
what they were at the beginning of this time period. Figure 2 shows that in the mid-1990s, rates
on 10-Year Treasuries were around 7% and eventually fell below 2% in the fourth quarter of
2011. The second series on Figure 2 (the lighter line) shows the Cap Rate Spread over the course
of the sample period. This series is expected to move in the opposite direction of interest trends
18
Prior to 2003, the negative relationship appears clear in both direction and magnitude of the rate
swings. However, the period after 2003 appears to have changed somewhat with a period of
relatively stable interest rates coupled with Cap Rate Spreads which fell from 4% in 2003 to 1%
in 2007. Even more noticeable beginning in 2007, the relationship seems to have become
positive with successive periods during which both rates appear to fall or rise together. This
seeming change provides a backdrop and further motivation for this study and may explain an
increased role for Cap Rate Spread in predicting loan Non-performance in the more recent
periods. The relationship between market interest rates and Cap Rate Spread may have changed
during this period and merits further investigation confirming the change and testing hypothetical
19
Figure 2 ■ Cap Rate Spread and Market Yield on 10-Year Treasuries
Commercial loans written during different interest rate environments could start with the same
DSCR yet have very different underlying cash flows. A future shock to the cash flows of these
different projects could lead one to default while the other project would be able to remain
current with debt service. Loans on projects with low overall returns, particularly those which
also have low spreads between the project’s Cap Rate and the rate of interest on the debt, may be
at an increased risk of Non-performance and default. Introducing Cap Rate Spread into loan
origination decision models may aid in identifying loans with an increased likelihood of
20
The main source for data used in this dissertation is the Bloomberg CMBS loan database, with
originations dating from 1967 through 2011. The full database of both domestic and foreign
loans includes 78,546 loans, as well as the 107,747 individual buildings and properties financed
with the funds. In addition to property level information, the records include limited information
about the current (recent) leases, or lack thereof, on these properties. Although the Bloomberg
CMBS database also includes international loans starting in 1967, this dissertation will focus on
U.S. loans during the period 1993-2011, during which the CMBS market grew rapidly.
This 1993-2011 period selected as the sample for this dissertation also coincides with changing
economic conditions that include periods of both rising and falling interest rates, such as the
period that began with 10-Year Treasury yields of 7% in late 1994 that dropped to 3.5% by April
2003. The shorter time period, the focus on U.S.-only loans, missing data, and outlier elimination
results in a sample size of 47,883 loans. More than half of these loans fall into just one sizable
group which combine a Rate Type of Fixed and an Amortization Type of Balloon. This group of
loans that represents a typical CMBS loan during the significant growth of the industry is
selected for more detailed investigation and analysis.
The loan data include the original loan balance, the balance as of securitization, the loan to value
at origination, the amortization type, bond type, debt service coverage ratio, NOI, current and
recent loan status, maturity and loan type, protection features, rate type, occupancy, and the
recent value of the property. The property records include location, square footage, Cap Rate,
NOI, and Net Cash Flow. The lease records (not used in this dissertation) include the tenant
name, expiration date, square footage, lease exposure in dollars, and the proportion of overall
21
Objectives of the Dissertation
The overall objective for this dissertation is to extend the body of knowledge regarding an
important aspect of the real estate debt market—the performance of loans underwritten for the
CMBS market. The specific questions of interest addressed in this dissertation are as follows:
1. Can measures other than LTV and DSCR, such as Cap Rate Spread, provide additional
information useful in predicting default of CMBS loans?
2. How do the typical Fixed Rate Balloon loans differ from other loans in their relationships
between Non-performance and underwriting ratios such as LTV, DSCR and Cap Rate
Spread?
3. During the recent financial crisis, could reliance on Cap Rate Spread have provided
additional protection against future loan Non-performance?
To answer these questions, the relationships between the probability of Non-performance and the
variables of interest, LTV, DSCR, and Cap Rate Spread are estimated with probit models. In
addition to these variables of interest, the models also include variables which control for interest
rates, recent stock market performance, loan interest rate, recent origination activity, loan size,
and indicators for categorical variables such as rate type, amortization type, originating firm and
property type. To test for sensitivity to the endogeneity between loan coupon rates and the ratios
LTV and DSCR, I estimate the Non-performance relationships with a two-stage model which
first estimates a predicted coupon rate. This predicted coupon rate is used to construct the Cap
22
Sensitivity to the distribution assumption is tested by substituting a logistic model, with a logistic
distribution, for the probit approach, which relies upon a cumulative normal distribution. Using
typical screening criteria for LTV and DSCR, the analysis is performed with a sample of loans
which would meet conservative underwriting standards to determine how Cap Rate Spread
would perform among these presumably safe loans. Finally, a numerical analysis is undertaken
to estimate the quantity of CMBS loans which would have been avoided following the
conservative LTV/DSCR criteria and the additional loans which would have been avoided by
adding a Cap Rate Spread floor. As a part of this numerical analysis, a limited type I error
rate-like approach suggests the quantity of currently performing loans which would have never been
originated had a Cap Rate Spread floor been utilized. One must be cautious in this regard as it
may be that many of these loans predicted by Cap Rate Spread to be in a non-performing state
have simply not entered this state… yet. Understanding the full extent of the Type II error, loans
that are still performing but ultimately doomed to fail, is necessarily a matter of time.
Contribution of the Dissertation
This dissertation extends the real estate finance literature by proposing and testing new
hypotheses about factors important in estimating the risks of commercial mortgages. Industry
practice and the academic literature regard the traditional measures of LTV and DSCR as the
primary criteria in underwriting commercial mortgages. This dissertation builds upon this
foundation by taking into account additional considerations which may aid in predicting the
23
This dissertation takes a fresh approach to modeling the probability of CMBS loan default. The
methodology incorporates variables described by past research, such as LTV, DSCR, and
property type, but extends the scope of past work by adding factors such as Cap Rate Spread and
exploring both the theoretical and practical implications of relying upon a Cap Rate Spread
underwriting rule for CMBS loans. Using both single- and two-stage probit regression and
numerical analysis, the expanded set of explanatory variables is incorporated into a model to
estimate the probability of CMBS loan default and provides a hypothetical view of the
consequences of relying on an additional underwriting rule based on the results.
To provide a background and theoretical foundation for the effects of regulatory and market
events, this dissertation also documents and presents a historical perspective on the outside
forces influencing origination decisions and how these decisions may have played a role in
subsequent loan defaults in the CMBS pools. By extending the literature on CMBS loan default
with factors such as recent loan origination activity, Cap Rate Spread, and introducing the
potential effects on originator behavior induced by a changing regulatory environment, this
dissertation adds to the collective knowledge of real estate finance and related disciplines.
Organization of the Dissertation
The balance of this dissertation is organized as follows: Chapter Two presents a background of
past and current literature and the hypotheses tested in this dissertation; Chapter Three describes
the data and methodologies employed in this dissertation; Chapters Four, Five, and Six present
the results, a numerical analysis, and conclusions, respectively. The dissertation concludes with a
24
CHAPTER TWO – LITERATURE REVIEW
This chapter begins with a brief background of the CMBS market and a review of the academic
research findings relating LTV and DSCR to CMBS loan performance and default. The literature
on LTV and DSCR helps establish a foundation for this research by providing guidance on
empirical methods, control variables and robustness measures. The next section discusses
research findings which suggest additional factors related to default, alternative methodologies,
related theories, and a broader look at loan default where the intersection between performance
and default theory and methodology overlap with the CMBS market.
CMBS Background
Although the earliest CMBS loans recorded in the Bloomberg database date to the 1960s, the
early-1990s saw an increasing acceptance of residential and commercial mortgage-backed
securities with the mid- to late 1990s marked by the introduction of CMBS holding loans
specifically originated for ultimate securitization. The Financial Institutes Reform, Recovery and
Enforcement Act (FIRREA), and the resulting Resolution Trust Corporation (RTC) provided the
impetus for CMBS growth through their efforts to liquidate the enormous real estate portfolios of
the failed thrifts. The sample period under study also includes a myriad of legislative initiatives
and changes such as SEC Regulation AB, Basel, the Volcker Rule, FDIC Safe Harbor, and
Dodd-Frank, which may impact the incentives and resulting behavior of CMBS loan
underwriters now and into the future.
The emergence of another securitization option in the mid2000s, collateralized debt obligations
25
environment with fewer restrictions on borrowers, the CDO alternative may have provided a
more attractive option for those wishing to access a capital market hungry for yield and willing
to invest heavily in commercial real estate. This competition for loans may have lead CMBS
underwriters to relax their standards by offering higher LTVs and lower DSCRs to stave off an
erosion of market share in a blossoming CDO market that typically provided floating rate terms
and less onerous prepayment limitations.
Commercial mortgage default, which had a significant impact on insurance companies and
pension funds throughout the 1980s, received a great deal of attention in the academic
community. Since then, subjects such as the factors contributing to default, models of default
probability, the valuation of prepayment and default options, and pricing have regularly appeared
in prominent real estate, finance, and economics journals (Kau, Keenan, Muller III, and
Epperson 1987; Vandell 1984; Vandell 1992). Research as early as the pioneering study by
Vandell (1984) points out that using the models designed for residential default are inadequate
because of the income-producing nature of commercial real estate and the differing economic
sensitivities inherent in these distinct debt instruments. Vandell (1984) also suggests that the
simple ratio tests in use at the time, such as LTV and DSCR, would not provide the intended
information to help keep default risk below some predetermined level. The author contends that
default prediction models should include information about the property such as location.
Vandell (1984) further posits that economic conditions such as interest rates, which change over
time, are also important factors that affect the performance of commercial mortgages. In a
detailed evaluation of the traditional ratio measures, the author also suggests that these ratios are
26
in a framework where cash flows and equity are volatile over time and may exhibit varying
volatility between borrowers. This observation provides an important motivation for the
investigation in this dissertation of Cap Rate Spread which makes the connection between cash
flows and equity.
In one of the first works on the growing field of CMBS, Kau, Keenan, Muller, and Epperson
(1987) identify two default scenarios: the first is when the value of the collateral is less than the
outstanding balance of the loan; the second, when the collateral is worth more than the balance
of the loan. The authors point out that for the second type of default to occur, there must be a
large spread between market and contract interest rates during the prepayment lockout period. If
not for the lockout period, prepayment rather than default would be the result when the property
value is greater than the loan balance. This insight suggests that newer loans, which are more
likely to be within the lockout period, are more prone to default with falling interest rates than
loans which are older and more likely to be past the lockout date. Loans originated later in the
sample period, thus more likely to be in the lockout period, and also faced with falling interest
rates may be particularly susceptible to entering a state of Non-performance or default. This
condition, along with the use of interest rate control variables, further motivates the study of
Non-performance and the relationship between interest rate spread measures such as Cap Rate
Spread.
The Kau, Keenan, Muller, and Epperson (1987) model assumed borrowers would exhibit what
they termed “ruthless default,” which means that borrowers would default as soon as their equity
value fell below the mortgage value. Their model also assumed no transaction costs for default.
27
rational default in the presence of transaction costs and found that surprisingly few borrowers
defaulted even when LTV exceeded 1.1, a state in which borrowers are significantly “under
water”. Allowing for the possibility that some loans with high LTV were restructured, 75-85% of
loans in this high-LTV category were retained by both borrower and lender, presumably to avoid
the high costs of default.
Although the Vandell (1992) study—which uses quarterly data to relate the incidence of default
to contemporaneous measures of LTV—focuses on contemporaneous measures influencing the
probability of default, several features of the research provide guidance for this dissertation.
Focusing on regions such as the South and the manner in which current interest rates affect the
market value of the loans, the study points out the importance of both geography and interest-rate
trends in predicting commercial mortgage default. In an interesting extension, Vandell (1992)
uses simulation to project, under varying scenarios, the future of mortgage defaults, suggesting
that foreclosure rates would double by 1993.
Following the widespread collapse of savings and loans and the subsequent large-scale
commercial real estate liquidation by the Resolution Trust Corporation, the subject of loan
default moved to the forefront in the eyes of academic researchers in a wide range of business
disciplines including finance, economics, and real estate. In an evaluation of apartment
mortgages and the factors leading to default, Archer, Elmer, Harrison, and Ling (2002) found
that LTV was not related to default. Their conclusion suggests that LTV is a primary factor in
pricing loans with lower-risk borrowers who are offered higher LTV debt structures. As a result,
loan pricing (interest rate) and LTV are jointly determined. This endogeneity hypothesis is
28
flow at the time of origination (DSCR) to be the primary factors in predicting default in their
sample of multifamily mortgages from 1991-1996. The sample of the Archer, Elmer, Harrison,
and Ling (2002) study, comprising 495 loans securitized by the RTC and FDIC, covered only a
brief period of CMBS history and a much smaller number of loans than this dissertation utilizes.
With the benefit of an increased sample size and longer period of time covering a variety of
economic conditions, this dissertation should better detect and interpret the factors related to loan
defaults while carefully considering potential endogeneity issues.
Interest Rates
As the market for CMBS was blossoming, Gallo, Buttimer, Lockwood, and Rutherford (1997)
studied the performance of mutual funds holding mortgage-backed securities (MBS) relative to a
variety of market benchmarks. Using single- and multi-index models, they found that MBS
mutual funds underperformed other mutual funds and provided evidence that this was
attributable to fund expenses, MBS selection, and timing. Gallo, Buttimer, Lockwood, and
Rutherford (1997) also found that the effects were sensitive to periods of rising and falling
interest rates.
When interest rates were rising, the MBS mutual funds underperformed, while no such result
was detected during periods of falling interest rates. The authors also found that performance
was heavily influenced by outlier periods, with performance more than two standard deviations
away from the mean monthly returns. This result suggests that influences on the performance of
29
Commercial mortgage default and prepayment may also be evaluated in a competing risks
framework wherein the borrower may, in any period, take one of three actions: prepay, default,
or remain current. Ambrose and Sanders (2003) model the prepayment option as a function of
changing interest rates relative to the loan coupon rate while taking into account the effects of
prepayment lockouts and yield maintenance provisions that may be a part of individual loan
agreements. Recognizing that interest rate expectations may affect the prepayment outcome, the
authors also incorporate a yield curve variable into their empirical method: the spread between
1-Year and 10-1-Year Treasury rates. Since their analysis views prepayment and default as options, a
measure of volatility is required to appropriately value the option. For interest rates, Ambrose
and Sanders (2003) include a rolling standard deviation of the prior 24 months of the 10-Year
Treasury.
Ambrose and Sanders (2003) find a significant and positive relationship between interest rate
spreads and the loan coupon rates. Significant relationships were also found between default and
both the term spread and interest-rate volatility, with the former being negative and the latter
positive. In contrast to other results described in this dissertation, the authors found no significant
relationship between LTV at the time of origination and default, though they did find that these
higher LTV mortgages were more likely to prepay.
Also using a proportional hazard with competing risks, Ciochetti, Deng, Lee, Shilling, and Yao
(2003) test for factors contributing to default and prepayment. In addition to the typical ratios at
the time of origination, the authors use an estimate of contemporaneous DSCR and LTV on a
quarterly basis using changes in the NCREIF property appreciation and the NCREIF income
30
were affected in the same way as the other properties represented by the NCREIF data.
Reasoning that the effects may vary depending upon the size of the loan, the authors also
incorporate dummy variables for small, medium, and large.
Ciochetti and his colleagues found that the contemporaneous DSCR was significant and
negatively related to the probability of default, while the DSCR at origination was insignificant.
Similarly, the authors found that as contemporaneous LTV rose, so did the probability of default,
though in a non-linear fashion. They also found significant increases in default probability
among medium and large loans, balloon loans, and loans with a smaller spread between the
coupon rate and 10-Year Treasury rates. The study used dummy variables for the different
property types but found none to be significantly related to default probability or prepayment. To
eliminate potential originator bias, this study used a weighting technique to make the smaller
sample better fit the population.
The Ciochetti et al. (2003) study uses a sample of 2,043 commercial loans from one large
insurance company with quarterly detail on default and prepayment. Their proportional hazard
model with competing risks takes advantage of the quarterly data and provides a clear picture of
how default and prepayment unfold over time but the larger sample of nearly 50,000 loans
collected and analyzed for this dissertation spans a longer time period and provides additional
insights into the relationships between loan features at origination and subsequent
Non-performance.
In one of the early studies of the CMBS market, Childs, Ott, and Riddiough (1996) refer to
CMBS as “a new and increasingly important class of structured debt.” Their work considers
31
approach that first estimates the points at which borrowers in the pool will default and then uses
Monte Carlo analysis to “follow” the loans through various paths while iterating interest rate and
property price state variables. The findings for the senior tranche indicate that higher rates of
default correlate with low rate outcomes. Finding positive correlation between interest rates and
property values, the authors further suggest that the low rates would be associated with larger
loans and higher probabilities of default. Their findings provide further motivation for evaluating
the relationships between Non-performance and the level of interest rates, the size of loans, and
the spread between Cap Rates and the interest rates on the loans, Cap Rate Spread.
Additional Considerations
Other factors and events such as geography, originators, property types, legislative changes,
industry dynamics, and competition from new investment vehicles may affect performance of
properties or the decision-making process at origination and lead to differences in the probability
of Non-performance or default among commercial mortgages.
While the information available at the time of origination provides valuable insight into the
probability of default of a commercial mortgage, it may also be the case that events that occur
after origination affect the ultimate performance of a loan. A downturn in local economic
conditions surrounding the properties funded by each loan may also put pressure on a borrower’s
ability to repay the debt. Conversely, a strong local economy may provide some measure of
protection against default even for highly leveraged commercial real estate projects. Using a
regional analysis, Archer, Elmer, Harrison, and Ling (2002) incorporate home price appreciation,
32
several of the regions identified by the National Council of Real Estate Investment Fiduciaries
(NCREIF).
Using only loan level data may ignore important information in estimating the probability of
default. Characteristics of the property such as type, size, and number of tenants may also
provide insight at origination as to the default probability of CMBS loans. Archer, Elmer,
Harrison, and Ling (2002) incorporate multifamily property level information such as number of
units, price per unit, year the building was completed, and whether the property is located in a
judicial foreclosure state. They found that only the property age was significant in their logistic
model.
When holding out the entire group of property level characteristics, tests for significance (change
in Pseudo R2, and Chi-Square) indicate that, as a group, the property level characteristics are more important than any other group of variables, including LTV, DSCR, financial institution,
post-origination MSA factors, and location of the collateral. Though the property level factors
dominate, property location significantly affects default probability. These results indicate that
loan underwriters do not fully adjust their origination criteria to account for these property level
and location risks. A sample with far more observations in each geographic cell may provide
further insights into this dimension of loan default outcomes.
Following the Gallo, Buttimer, Lockwood, and Rutherford (1997) study of MBS mutual fund
returns, Xu and Fung (2005) investigated the returns of an important residential MBS index.
Estimating the relationships using a VAR model with data from 1988 through 2001, the authors
found, among other factors, that index returns are related to interest rates, term structures, and
33
response techniques. The authors break their sample period into two periods to discern the
effects of the introduction of the Office of Housing Enterprise Oversight (OFHEO) in 1992.
They posit that the introduction of this governmental entity may have altered the risks inherent in
the MBS market. By analyzing the sample during these two regimes, the authors found evidence
of a structural change in the MBS market after which investors recognized that these securities
may be exposed to greater risk than previously assumed. This study suggests that the
introduction of regulatory and statutory events into a set of variables provides important insight
into how the CMBS market has developed over the last twenty years.
Titman and Tsyplakov (2010) studied the characteristics of commercial mortgage originators and
found that loans originated by recent stock price losers tended to default more often than loans of
other firms. They also found that broad financial market performance was an important factor,
with differences greater during significant market downturns. This result provides motivation for
including broad market indicators, such as interest rates, in the new models, as these may also
affect the probability of default for firms originating during these periods and may also affect
individual originators differently.
The authors ascribe the effects to firms choosing short-term profits at the expense of their
reputation. Firms earned short-term profits in the form of origination fees by lowering their
underwriting standards and taking on riskier loans. This hypothesis is supported by evidence that
ratings agencies tend to assign lower scores to pools that contain loans from underwriting firms
whose stock price have seen recent declines, firms more likely to take on riskier underwriting
34
Grovenstein, Harding, Sirmans, Thebpanya, and Turnbull (2005) tackle the seeming
inconsistency between the options theoretic prediction of LTV’s impact on default and what is
borne out in other studies by building on the notion that LTV, along with DSCR, is endogenous
to loan pricing. Expanding on the work of Archer, Elmer, Harrison, and Ling (2002), they posit
that, unlike most residential mortgage underwriters, commercial mortgage underwriters
simultaneously adjust LTV and DSCR along with other contract terms of the loans, such as the
interest rate. If, as the authors suggest, these influences are jointly determined, then seemingly
inexplicable relationships between default probability and the standard underwriting ratios make
perfect sense.
Grovenstein et al. (2005) employ a much larger sample of loans (10,547) than prior studies and
predict that there should be no unpriced LTV risk of default in commercial mortgage loans. With
the exception of the multifamily and hospitality sectors, the results support their hypothesis,
finding that LTV at origination is largely insignificant in predicting default. The authors offer
possible reasons for the multifamily and hospitality results, including investor preference for
GSE-backed multifamily properties and the 9/11 terrorist attacks.
In another recent study, Black, Chu, Cohen, and Nichols (2011) found significant differences
between types of originators and suggested that the differences arose from incentive distortions
that vary among different groups of originators, including conduit lenders and balance sheet
lenders such as insurance companies, finance companies, and commercial banks. They found a
greater likelihood of default among conduit lenders that originated all their loans for subsequent
sale to other parties. Although the authors expected adverse selection to dominate, they found
35
underwriting systems and more experienced underwriters because of the quantity of other loans
originated for their own balance sheets.
Using a technique similar to estimating the volatility of a security when the price and option
value are known, Downing, Stanton, and Wallace (2008) use the Titman and Torous (1989)
mortgage-pricing model to arrive at an implied volatility of CMBS loans. Their approach uses a
large sample (more than 14,000 loans originated from 1996-2005) to also simulate the default
rates on CMBS loans and ultimately model the subordination levels required to prevent defaults
on the various tranches, such as BBB securities. The Downing, Stanton, and Wallace (2008)
study provides an early warning of things to come as defaults on CMBS securities began to
balloon. The authors point out that while volatilities remained constant, subordination levels of
securities steadily declined, suggesting a much higher default probability than their credit ratings
indicated.
Additional sources for CMBS and commercial mortgage default research include Christopoulos,
Jarrow and Yildirim (2008), Yildirim (2008), De Leonardis and Rocci (2008), Kau, Keenan, and
Yildirim (2009), Corcoran (2009), Chen and Deng (2010), An, Deng, and Sanders (2010), An
and Sanders (2010), and Seslen and Wheaton (2010).
Alternative Approaches
The majority of research in the commercial mortgage default domain focuses either on equity
(through LTV), or cash flow (through the DSCR of a loan, either at origination or over time as
the loan seasons). Goldberg and Capone (1998; 2002) advanced a theory that these equity and
36
on commercial mortgages. They posited that relying on LTV alone would tend to overestimate
the probability of default for commercial mortgages while reliance on DSCR would tend to
underestimate the probability of default.
Goldberg and Capone (1998; 2002) suggested that their double-trigger model would better
estimate the probability of default than other approaches because the combination of negative
equity and negative cash flow would push borrowers to default even though borrowers facing
only one of these conditions may be unlikely to default. The results of this research combining
equity and cash flows into loan performance predictors in the multifamily sector from 1983-1995
provide motivation to build upon this work with other equity/cash flow measures in a more
extensive sample of commercial mortgages.
Summary
The real estate literature provides ample evidence that LTV and DSCR are important factors in
measuring risk among commercial real estate loans. Beginning with theoretical research into the
default that use hazard models to predict future outcomes, and including more recent studies that
leverage increasing years of historical data, the research has largely been silent regarding yield
measures such as Cap Rate Spread. The recent growth in the CMBS market, the rise in default
rates, and falling interest rates provides motivation to investigate an alternate measure, Cap Rate
37
Hypotheses
Motivated by empirical results of prior CMBS research, limitations of prior models to predict
CMBS performance in some circumstances, and observations of the increased level of CMBS
loan default in the wake of the recent financial crisis, the following hypotheses are tested in this
dissertation:
H1: There is a significant and negative relationship between the Cap Rate Spread of a CMBS
loan at origination and the probability of Non-performance.
While the empirical evidence is mixed on the adequacy of ratio tests at origination to predict the
likelihood of default, it is reasonable to expect that a hybrid of the typical ratio tests, one that
compares project cash flows to project value would provide additional information that would be
useful in estimating default probability. The subsequent hypotheses are tightly related to
Hypothesis 1.
H2: Among a homogenous sample of typical CMBS loans, Cap Rate Spread will have a
negative and significant relationship with Non-performance.
Hypothesis 2 recognizes that the relationship between Cap Rate Spread and Non-performance, if
any, may vary among loans with differing combinations of rate and amortization type. Due to the
wide range of loan types and borrower characteristics, the expected relationships may not be
detected in the empirical tests for Hypothesis 1. In order to test the theoretical relationship with a
relatively homogenous group of loans, fixed rate balloon loans are selected for a closer
investigation. A negative and even more significant relationship between Cap Rate Spread and
38
H3: Among loans which would satisfy typical underwriting ratio tests for LTV and DSCR,
Cap Rate Spread will have a negative and significant relationship with Non-performance.
Hypothesis 3 considers the expected outcome of policies which extend the traditional
underwriting standards to include Cap Rate Spread. In order for an additional CMBS
underwriting ratio test to be of practical value, it must provide information beyond that of the
well-known and accepted standards for LTV and DSCR. It is expected that, when a sample of
loans which would have been considered “safe” by LTV and DSCR standards is employed to
estimate the relationship between Cap Rate Spreads, the coefficient estimates for Cap Rate
Spread will be negative and significant.
H4: A Cap Rate Spread floor underwriting standard would have considerably lowered the
level of CMBS loan Non-performance during the recent financial crisis.
The theory tested under Hypothesis 4 arises from the goal of offering some practical utility as an
outcome of this research. Of course, Hypothesis 4 may be proven by simply choosing a very high
Cap Rate Spread that would eliminate all loans. Therefore, the results of tests for Hypothesis 4
should be viewed as hypothetical and merely designed to demonstrate the results of one choice
for a Cap Rate Spread floor. Although the numerical analysis used to “test” Hypothesis 4 does
not provide statistical evidence in the traditional sense, it should offer some guidance to
39
CHAPTER THREE – DATA AND METHODOLOGY
Data
This dissertation uses detailed information about loans held in CMBS from the Bloomberg
CMBS Loan database. This data source provides loan-level information from the time of
origination, the most recent period, and a record of recent status indicators. A subset of the full
CMBS loans database selected for this research consists of loan records for 47,883 U.S. loans
beginning on 1/1/1993 and ending on 9/15/2011. The second source of data, also from the
Bloomberg CMBS system, is a detailed listing of the CMBS collateral backing up the loans.
These data include the locations, area, and other property-level details. Table 2 describes select
data from the Bloomberg loans and property series. Constant maturity yields of U.S. Treasury
bond rates are provided by the U.S. Department of the Treasury. Using methods similar to
Archer, Elmer, Harrison, and Ling (2002), outliers and extreme cases in ratios such as LTV and
DSCR are eliminated.
In addition to the fields directly gathered from the sources listed above, several variables,
including many key variables of interest, were calculated as described in the introduction of this
dissertation. These variables include Cap Rate Spread, recent S&P returns, recent CMBS
Origination activity, and predicted Coupon Rate used in the first stage of the two-stage models.
Although, the Bloomberg database included CMBS loans beginning in 1967, this dissertation
40
The starting sample of 78,546 loans is reduced by 55 to 78,491 by eliminating loans prior to
[image:41.612.72.542.191.399.2]1993.
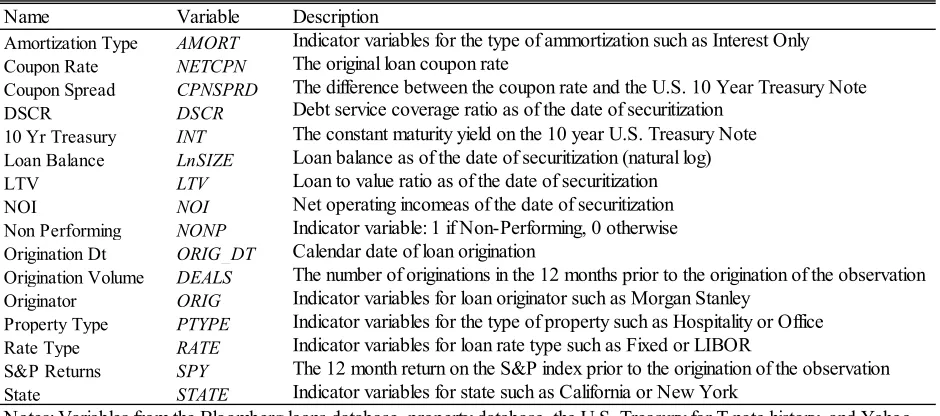
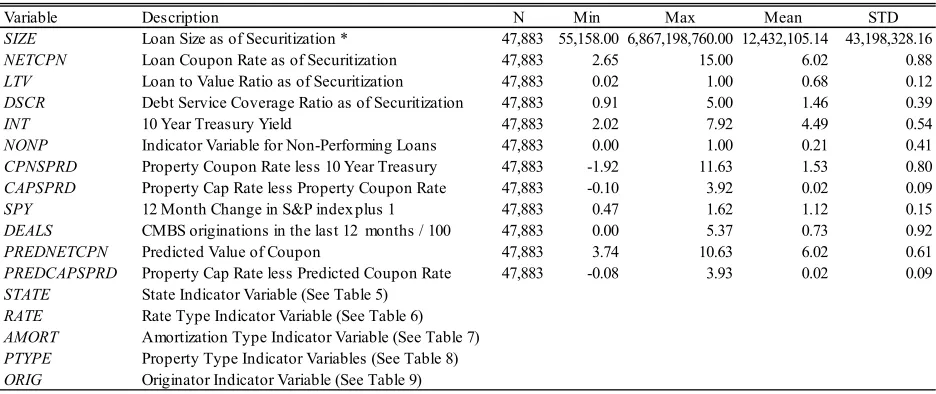
Table 2 ■ Variables from the Bloomberg CMBS Loan Database and other sources.
Because the focus of this research is on CMBS loans in the U.S. market, the final sample
includes only those loans originated for U.S. properties. Removing properties in Canada,
Mexico, Great Britain, France, Italy, Czechoslovakia, and other countries further eliminated
5,295 loans from the sample, leaving a U.S.-only sample of 73,196 loans. Because the variables
of interest and the calculated items required for the regression are not present in all observations,
some of the loans are eliminated from the sample due to missing data. Screening for observations
with a valid NOI, required for the computation of Cap Rate and Cap Rate Spread, reduced the
Name Variable Description
Amortization Type AMORT Indicator variables for the type of ammortization such as Interest Only Coupon Rate NETCPN The original loan coupon rate
Coupon Spread CPNSPRD The difference between the coupon rate and the U.S. 10 Year Treasury Note DSCR DSCR Debt service coverage ratio as of the date of securitization
10 Yr Treasury INT The constant maturity yield on the 10 year U.S. Treasury Note Loan Balance LnSIZE Loan balance as of the date of securitization (natural log) LTV LTV Loan to value ratio as of the date of securitization NOI NOI Net operating incomeas of the date of securitization Non Performing NONP Indicator variable: 1 if Non-Performing, 0 otherwise Origination Dt ORIG_DT Calendar date of loan origination
Origination Volume DEALS The number of originations in the 12 months prior to the origination of the observation Originator ORIG Indicator variables for loan originator such as Morgan Stanley
Property Type PTYPE Indicator variables for the type of property such as Hospitality or Office Rate Type RATE Indicator variables for loan rate type such as Fixed or LIBOR
S&P Returns SPY The 12 month return on the S&P index prior to the origination of the observation State STATE Indicator variables for state such as California or New York
41
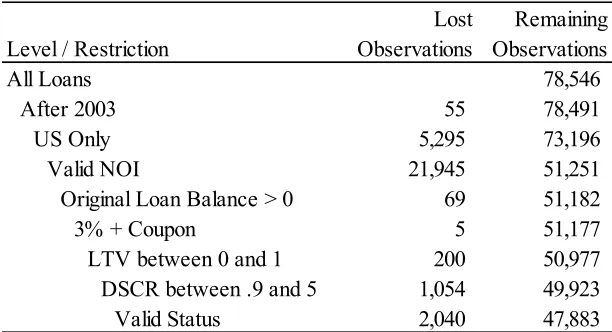
database to 51,251 loans. Requiring loans to have original balances greater than 0 eliminated 69
loans, bringing the total to 51,182.
To eliminate outliers, Archer, Elmer, Harrison, and Ling (2002) set cutoff criteria that required
the contract rate to be between 5%-20% and higher than the 10-year constant maturity risk-free
rate, an original LTV of less than 100%, and a DSCR between .9-5. The sample period for this
research includes years during which rates below 5% were not uncommon, with 4,706 U.S. loans
(6.2% of the total) carrying coupon rates below 5%. Allowing for the influence of these
lower-rate loans, a cutoff level of 3% is used, which eliminated only 5 loans. Following the 20% cutoff
point for the maximum rate eliminated no loans from the database, as the highest rate in the
sample is 15%.
Further screening for database errors and outliers eliminated all observations with a LTV below
0 or above 1, further reducing the database by 200 to 52,086. Additional observations are
removed from the database by eliminating those with a DSCR below .9 and above 5, further
reducing the sample by 1,054 to 49,923. Finally, loans with a status of Defeased, Mixed,
Matured, or Special are removed, reducing the sample by 2,040 to 47,883. Table 3 presents the
42
Table 3 ■ Database Waterfall
Methodology
This dissertation uses a probit model to estimate the probability of Non-performance among
loans within CMBS portfolios. The probit methodology estimates the parameters when a
dichotomous dependent variable is regressed on one or more continuous or categorical variables.
The resulting parameter estimates indicate the change in the probability of the dependent
variable taking on the value of 1. The probit methodology was introduced by Chester Bliss (Bliss
1935; Greenberg 1980; Holford and White 2005) in collaboration with R.A. Fisher and is further
Level / Restriction
Lost Observations
Remaining Observations
All Loans 0 78,546
After 2003 55 78,491
US Only 5,295 73,196
43
developed by Finney and Stevens (1948) and Finney (1952). Either the probit or logit approach
may be used in estimating the parameters in such a scenario.
The selection of a particular model, once influenced by computing power, is now typically a
matter of preference (Vincent 2008). Hahn and Sawyer (2005), however, showed that with large
sample sizes and random effects, the probit link function may provide superior results in a
multivariate model than the logit approach, while in the presence of fixed effects or in situations
with extreme values, there may either be no difference or the logit approach may provide better
deviance results. An important assumption in selecting the probit methodology is that the
relationship between the number of CMBS loans defaulting and LTV, DSCR, Debt Yield, and
Cap Rate are normally distributed. To monitor the results for sensitivity to selection of probit
over logit, select tests are also conducted using the logit approach.
The probit methodology was first used for applications such as mortality rates at various
concentrations of drugs in medical studies where a base “mortality correction” must be made if
the mortality in the control group is greater than 10%. For the CMBS loans under study here, no
corollary exists for a no-treatment group, as all loans would have some level of LTV, DSCR,
Debt Yield, and Cap Rate as opposed to a control group in a medical study that may have
received a placebo and thus there would be zero concentration of the drug in question. With this
in mind, there is no need in this study to adjust the base level of mortality (default) as suggested
by Schneider-Orelli (1947).
The probit model takes following form:
44
where Pr is the probability and Φ is the cumulative distribution function of the standard normal
distribution. The parameters, denoted by β, are estimated with SAS© 9.2 using the PROBIT
function, which relies on the maximum likelihood procedure.
In the biological sciences, the term LD50 refers to the medial lethal dose of a chemical or a toxic
substance. If one were to consider financial ratios as potentially lethal substances for a CMBS
loan, a certain level of one of these ratios may correspond to a median level of loan default,
controlling for other factors. For example, if the LTV approaches a certain level, one might
expect to see defaults in half of all CMBS loans. Similarly, as the DSCR falls, one would expect
to reach a point where half of all loans default with insufficient cash flow to cover the mortgages.
Centered in the distribution, the formula for LD50, the point at which a financial ratio could be
said to “kill” half of all loans, is the same for both probit and logit models3 (UCLA-ATS 2011). The formula for LD50 follows the form:
LD50 = - constant/coefficient. (7)
As one moves, however, into the tails of the standard normal and logistic distributions, the probit
and logit values diverge slightly due to differences in the normal and log functions. Substituting
p for the level of the substance (ratio) in question, finding the LD for a probit model requires the
following calculation:
3 For further description of LD50 and LDp calculations with both probit and logit methodologies, see the UCLA
45
Probit LDp = (invnormal (p) - constant)/coefficient. (8)
With the logistic distribution, a logit model uses a different formula to compute the LD levels
with the following formula:
Logit LDp = (log (p/(1-p)) - constant)/coefficient. (9)
The toxic substance metaphor becomes more interesting when one considers medical drug
interactions and how they may lead to increased probability of deadly side effects. Levels of a
substance (ratio in the case of loans) that cause mild reactions among subjects may, when
combined with low levels of another substance (ratio or interest rates), lead to high mortality
rates (loan defaults). For this reason, the models are extended to include interaction terms among
the various loan ratios, and between them and other loan and economic characteristics such as
Cap Rate Spread.
In this research, a probit model measures the impact of the independent variables on the
probability of a CMBS loan having a current status of “Non-performance” as indicated in the
database by the variable “Status.” A new variable labeled “NONP” is created, with all
observations other than those having a Status of Perform or Perform (w)—which indicates that
the loan is performing but has been placed on the servicer’s watch list. Non-performing loans are
assigned a value of 1; Perform and Perform (w) loans are assigned a value of 0.
The equation below provides an example of the approach followed in this dissertation. In this
example, only one of the ratio measures (LTV or DSCR) is included in the model along with the
natural log of loan size, recent S&P index returns, market interest rate, the spread between the
46
indicator variables for amortization type, interest rate type, state, loan originator, and property
type. These variables are all described later in the Data and Methodology section. Other models
will incorporate combinations of the ratio measures, as well as two-stage equations, and split
samples with the goal of testing the robustness of the results.
NONP 1
0 = f (LTV or DSCR, LnSIZE, SPY, INT, CPNSPRD, CAPSPRD, AMORTi , RATEi,
STATEi, ORIGi, PTYPEi) (10)
Hypothesis 1
Hypothesis 1 tests the theory that the spread between the rate of interest on the loan and the Cap
Rate at the time of origination (Cap Rate Spread – CAPSPRD) is negatively related to
Non-performance. This theory would predict that as the cushion between the loan interest rate and the
Cap Rate on the property increases, the incidence of Non-performance would drop. Conversely,
the theory would predict that loans underwritten with a very low margin between the loan
interest rate and the return on the property are at greater risk of Non-performance and ultimately
of default. In testing Hypothesis 1, probit model parameters are estimated with the equation:
Pr (NONP = 1 | X) = Φ(X’β), (11)
where X’ is a vector of one of several combinations of the following covariates:
Loan to Value—this variable (LTV) is the ratio of the original loan balance to the value of the
property. Lenders typically require between .75-.85 for project approval, though it was not
uncommon during the mid-2000s for LTVs to be much higher, often approaching 1.0 and
47
Debt Service Coverage Ratio—this variable (DSCR) is the ratio of a borrower’s (project’s)
annual net operating income to the annual debt service requirement including both principal and
interest. Lenders generally require ratios between 1.1-1.25 for project approval.
Loan Size—the natural log of original loan balance in dollars (LnSIZE) for each observation.
This variable is intended to capture loan performance risks and underwriting behavior
differences related to the size of the project and loan amount originated.
Equity Market Returns—the yield on the S&P Index for the prior 3-month period. This variable
is intended to capture the effects of the broad U.S. stock market on CMBS loan underwriting
behavior. Recent gains or losses in the stock markets may differentially affect the underwriting
decisions due to changed demand for CMBS products, return expectations, and sentiment. S&P
Yield (SPY) measures the change in percent of the S&P Index for the three month period
preceding the origination of the observation.
Interest Rate—the rate of the 10-Year constant maturity Treasury at the time of loan origination.
This data series is retrieved from the U.S. Treasury website and is matched with the Bloomberg
loan data using the date of origination for the loan and the date provided in the daily rate file.
Interest Rate (INT) measures the market yield in percent per year on 10-Year constant-maturity
Treasury securities, quoted on investment basis.
Origination Volume—the number of CMBS loans originated in the 12 months prior to the
origination of the observation. This variable is scaled by a factor of .01 in order to aid the
presentation and interpretation of the coefficient estimates. Origination (DEALS) measures the
48
Coupon Spread (CPNSPRD) – the difference between the coupon interest rate on the loan at
origination (NETCPN) and the market yield on 10-Year Treasuries on the date of loan
origination (INT). In theory, a commercial loan coupon rate should represent the investor’s
required rate of return, i.e., the discount rate utilized in determining the present value of the
loan’s cash flows. The difference between the prevailing interest rates and the coupon rate on a
commercial mortgage should represent the originator’s assessment of default risk for the loan
relative to alternative investments and may serve as a normalized measure of loan risk. As the
LTV on a loan rises and the DSCR on a loan falls, one would expect the coupon spread
(CPNSPRD) to rise accordingly. As a result, multicollinearity is to be expected among these
variables. Assuming, however, that underwriters consider other, perhaps unmeasured, factors in
addition to LTV and DSCR in making origination judgments, the net coupon rate may capture
attempts to price these risks into the loan.
Cap Rate Spread—this variable (CAPSPRD) is the spread between the coupon rate of the loan
and the Cap Rate, the ratio of the net operating income of the property serving as collateral for
the total value of the project. Cap Rate, also called the overall capitalization rate, is used in
evaluating commercial real estate and represents an unleveraged rate of return on the project.
State — The largest group of the CMBS loans were originated for property in the state of
California (10,576) while Vermont saw only 68 loans originated during the sample period. Due
to differing economic conditions, regulatory environments, and business cycles, controlling for
geography is an important consideration when estimating the factors affecting CMBS loan
49
for each state plus Washington, DC. STATEi indicator variables represent the State where the
loan collateral is located.
Rate Type — The CMBS loan underwriters shifted risks to the borrower in varying degrees by
offering different fixed and adjustable rate types. Like the amortization, the type of rate may
reflect a bank’s assessment of the risk and would be an important factor in understanding and
comparing the actual rate set on the loan. For example, a rate of 5% may be at the same time
high for an adjustable loan and low for a fixed rate loan. Example rate types include fixed and
those indexed to LIBOR, EURIBOR, prime, COFI, and U.S. Treasuries. RATEi indicator
variables represent the rate type of the loan.
Amortization Type —All things being equal, the amortization type for a loan may reflect a
bank’s assessment of the risk and would be an important factor in understanding and comparing
the actual rate set on the loan. Example amortization types include fully amortizing, interest
only, balloon amortizing, partial interest only, and mixed. AMORTi indicator variables represent
the amortization type of the loan.
Property Type—the building serving as collateral for each CMBS loan may be in one of several
different property-type categories including office, retail, industrial, and multifamily. Because
each of these property types may be subject to differing sensitivities to the variables of interest in
this study, they are incorporated into the model to control for this possibility. Over the last
twenty years, in addition to periods of increasing and decreasing interest rates, there have also
been periods or cycles of greater CMBS loan activity in different commercial property types.
During some periods, for example, there was a much larger proportion of loan originations in