ScholarWorks @ Georgia State University
ScholarWorks @ Georgia State University
Public Health Theses School of Public Health
8-7-2012
Assessing the Relationship between SafeCare Fidelity and
Assessing the Relationship between SafeCare Fidelity and
Competence Measures
Competence Measures
Rebecca Palmer Georgia State University
Follow this and additional works at: https://scholarworks.gsu.edu/iph_theses
Recommended Citation Recommended Citation
Palmer, Rebecca, "Assessing the Relationship between SafeCare Fidelity and Competence Measures." Thesis, Georgia State University, 2012.
https://scholarworks.gsu.edu/iph_theses/227
ABSTRACT
Rebecca Palmer
Assessing the Relationship between SafeCare Fidelity and Competence Measures (Under the direction of Daniel Whitaker, Ph.D.)
As more evidence-based programs are implemented in community settings, there is a strong need to ensure those models are implemented with integrity. Implementation of programs should be evaluated for fidelity, the degree of adherence to treatment protocols, and competence, the level of skill in implementation (Schoenwald et al., 2011). The purpose of this study was to review audio recordings of SafeCare home visiting sessions to discover the relationship between the measures of fidelity and competence. Six coders were assigned 209 SafeCare home visiting audiotapes to be coded for fidelity and competence. A sample of audios were double coded to evaluate fidelity and
competence scores for inter-rater reliability. Fidelity and competence items were classified into process and content categories, forming the six main variables of process fidelity, content fidelity, total fidelity, process competence, content competence, and total competence. Total fidelity correlated with total competence at a level of .615, with process fidelity and process competence correlating at a much lower level than content items. The total correlation level can be interpreted as that fidelity and competence are strongly related measures, but are not identical constructs. The goal for SafeCare coders would be to continue refining competence definitions and attempting to remove the subjective nature from the competence coding process. With these two efforts,
competence reliability should increase to an acceptable level. Given the main fidelity and competence correlation level, it is advisable for SafeCare coders to continue to code both fidelity and competence to avoid missing valuable components of the session. Additional research may be needed once the competence scale becomes better established.
ASSESSING THE RELATIONSHIP BETWEEN SAFECARE
FIDELITY AND COMPETENCE MEASURES
By
REBECCA PALMER
B.S., DUKE UNIVERSITY
A Thesis Submitted to the Graduate Faculty
of Georgia State University in Partial Fulfillment
of the
Requirements for the Degree
MASTER OF PUBLIC HEALTH
ATLANTA, GEORGIA
ASSESSING THE RELATIONSHIP BETWEEN SAFECARE FIDELITY AND COMPETENCE MEASURES
By
REBECCA PALMER
Approved:
Daniel J. Whitaker, Ph.D.
__________________________________________ Committee Chair
Shannon Self-Brown, Ph.D.___________________ Committee Member
Anna Edwards-Gaura, Ph.D.___________________ Committee Member
ACKNOWLEDGEMENTS
I would first like to thank my family and boyfriend for their love and support throughout my time at Georgia State University. Thanks to my friends for putting up with my late-night phone calls and many emails asking for input and advice.
I would also like to thank many great people who made this thesis possible. Thanks to Erin McFry and Amanda Hodges for all of your help and patience over the last two semesters. I couldn’t have done this without either of you. Thanks to my fellow coders Meghan Nix, Sarah Roby, and Dupe Babalola. You guys are awesome! I would like to acknowledge my committee members, Dr. Shannon Self-Brown and Dr. Anna Edwards-Gaura, as well as the other individuals at NSTRC who helped me along the way. Lastly, I must thank my thesis chairperson, Dr. Daniel Whitaker, for his endless time and
guidance that went into helping me write this thesis.
Statement Page
In presenting this thesis as a partial fulfillment of the requirements for an
advanced degree from Georgia State University, I agree that the Library of the University shall make it available for inspection and circulation in accordance with its regulations governing materials of this type. I agree that permission to quote from, to copy from, or to publish this thesis may be granted by the author or, in his/her absence, by the professor under whose direction it was written, or in his/her absence, by the Associate Dean, College of Health and Human Sciences. Such quoting, copying, or publishing must be solely for scholarly purposes and will not involve potential financial gain. It is understood that any copying from or publication of this dissertation which involves potential
financial gain will not be allowed without written permission of the author.
Notice to Borrowers Page
All theses deposited in the Georgia State University Library must be used in accordance with the stipulations prescribed by the author in the preceding statement.
The author of this thesis is:
Student’s Name: __Rebecca Palmer__________________________________________
Street Address: __1737 Beacon Hill Blvd______________________________________
City, State, and Zip Code: __Atlanta, GA, 30329________________________________
The Chair of the committee for this thesis is:
Professor’s Name: __Daniel Whitaker, Ph.D.___________________________________
Department: __Institute of Public Health_______________________________________
College: ____Health and Human Sciences______________________________________
Georgia State University P.O. Box 3995
Atlanta, Georgia 30302-3995
CURRICULUM VITAE
Rebecca Jean Palmer
1737 Beacon Hill Blvd • Atlanta, GA 30329 Cell: 770-712-7982 • [email protected]
EDUCATION
GEORGIA STATE UNIVERSITY, Institute of Public Health, Atlanta, GA GPA: 4.00
Master’s of Public Health, Prevention Sciences; Jan 2011 to August 2012
DUKE UNIVERSITY, Trinity College of Arts and Sciences, Durham, NC GPA: 3.34
Bachelor of Science, Biology (Neuroscience Concentration);Minor, Chemistry; Minor, Psychology; May, 2010
WORK EXPERIENCE
2012 National SafeCare Training and Research Center, Atlanta, GA Practicum Student
• Coded ~150 SafeCare audiotapes for fidelity and competence • Collected weekly SafeCare parent satisfaction surveys
2008-2009 Cognitive Behavioral Research Training Program, Durham, NC Research Assistant
• Collaborated with the National Institute of Drug Abuse on drug addiction study • Worked on study that explores the efficacy of virtual reality treatment for crack cocaine addiction
• Administered urinary analyses of study participants to track treatment progress Summer 2008 Department of Molecular Genetics and Microbiology, Durham, NC
Research Assistant, Linney Lab
• Cared for, monitored, and maintained zebra fish population
• Tested water for chemicals, salinity, and temperature
LEADERSHIP AND INVOLVEMENT
2010-2012 Children’s Healthcare of Atlanta, Egleston, Atlanta, GA Student Volunteer
• Provided art therapy to patients throughout the hospital • Assisted in Volunteer Services stockroom
2009 Duke Autism Foundation, Autism Society of America,Durham, NC Student Volunteer
• Acquired donations for autism support groups and therapeutic summer programs
• Increased community awareness of autism through education 2007-2009 Healing Expressions, Durham, NC
Student Volunteer, Duke University Medical Center Cancer Patient Support
• Visited oncology waiting rooms and distributed art kits
• Provided art therapy to patients and family members through knitting and crocheting lessons
Summer 2009 Emily K Summer Scholars Program, Durham, NC Teacher’s Aide
• Mentored economically disadvantaged elementary school children • Guided lessons, artwork, and fitness programs
2008 Duke-UNC Basketball Marathon, Durham, NC Student Volunteer, Hospitality Committee
• Raised funds for BounceBack Kids, a non-profit group
TABLE OF CONTENTS
Page
ACKNOWLEDGMENTS ... iii
LIST OF TABLES ... v
CHAPTER 1. INTRODUCTION ... 1
2. REVIEW OF THE LITERATURE...………3
3. METHODS AND PROCEDURES…..…………... 20
4. RESULTS…... 28
5. DISCUSSION………... 42
REFERENCES...47
APPENDICES A. Fidelity Checklists…………... 52
B. Competence Checklists…..……... 55
C. Fidelity Item List………...………64
D. Competence Item List………...65
List of Tables
Table 1 Number of Audios Stratified by Module and Session Type……….21
Table 2 Inter-rater Fidelity Reliability Stratified by Session Type………26
Table 3 Inter-rater Fidelity Reliability Stratified by Module Type………26
Table 4 Inter-rater Competence Reliability Stratified by Session Type………26
Table 5 Inter-rater Competence Reliability Stratified by Module Type………27
Table 6 Correlation of All Six Competence Items……….31
Table 7 5-Item Competence Factor Analysis……….33
Table 8 Loadings for Two-Factor Solution………33
Table 9 Correlation of Inter-rater Competence Reliability……….34
Table 10 Descriptives of Fidelity-Competence Correlation: All Sessions………..36
Table 11 Fidelity-Competence Correlation Analysis: All Sessions……….37
Table 12 Descriptives of Fidelity-Competence Correlation by Session Type………….38
Table 13 Fidelity-Competence Correlation Analysis by Session Type………...39
Table 14 Descriptives of Fidelity-Competence Correlation by Module Type………….40
Chapter I
INTRODUCTION
Purpose of the Study
As more evidence-based programs are implemented in community settings, there
is a strong need to ensure those models are implemented with integrity. Implementation
of programs should be evaluated for fidelity, the degree of adherence to treatment
protocols, and competence, the level of skill in implementation (Schoenwald et al., 2011).
Together, these two measures are components of the total “treatment integrity”
(Schoenwald et al., 2011). Yet, the relationship between adherence and competence is
not well understood. The purpose of this study was to review audio recordings of
SafeCare home visiting sessions to discover the relationship between measures of
fidelity and competence. A literature review examines the issue of child maltreatment
and how the SafeCare program attempts to reduce child neglect and abuse. The
literature review also explores how the concepts of fidelity and competence are measured
in SafeCare and other home visiting programs, and whether research exists for defining
the relationship between the two measures.
The proposed study is needed because, although some research exists on
implementation fidelity, there is a lack of studies examining measures of competence,
and virtually no information regarding the relationship between fidelity and competence.
In addition, progress in this area has been slow because of confusion in terminology.
study) and competence are two of the three parts to treatment integrity (the third part
being treatment differentiation). Cross and West state that “implementer adherence”, and
competence are the only two components of treatment integrity (2011). However, both
of these conceptualizations agree that adherence/fidelity and competence are components
of treatment integrity, but the relationship between the two measures is unclear. The aim
of the current study is to add to the body of research concerning fidelity and competence
measures of parent-training evidence based practices.
Research Question
1) What is the relationship between fidelity and competence?
Chapter II
LITERATURE REVIEW
Overview of Child Maltreatment
The Child Abuse Prevention and Treatment Act defines child maltreatment as
“any recent act or failure to act on part of a parent or caretaker which results in death,
serious physical or emotional harm, sexual abuse or exploitation or an act or failure to act
which presents an imminent risk of serious harm” (Mennen, Kim, Sang, & Trickett,
2010). Incidence of child maltreatment, which includes both child abuse and neglect, has
fluctuated in recent decades. Although child abuse has declined twenty percent since
peaking in 1993, child neglect has not seen a substantial decline (Jones, Finkelhor, &
Halter, 2006). In 1986, there were 931,000 reported cases of child maltreatment; in
1997, there were 984,000 reported cases of maltreatment (U.S. Department of Health and
Human Services, 1999). These numbers have decreased somewhat, with 794,000 claims
of child maltreatment in 2007 (U.S. Department of Health and Human Services, 2009).
Another source, the Fourth National Incidence Study of Child Abuse and Neglect
(NIS-4), reported much higher maltreatment numbers with 1.25 million neglected and abused
children in 2005 (Sedlak et al., 2010). Despite the differing statistics, the NIS-4 also
reported a decline in maltreatment cases, with a nineteen percent decrease since the
NIS-3 was released in 199NIS-3 (Sedlak et al., 2010). It should be noted that the decrease in child
maltreatment reports does not necessarily indicate a true decrease in child maltreatment
which report only substantiated cases (McKenzie & Scott, 2011). Due to the agencies’
policies and to the fact that most maltreatment goes unreported, the officially reported
data on child maltreatment is likely a large underestimation of the true scope of the
problem (McKenzie & Scott, 2011).
Although much of the focus of child maltreatment centers on physical and sexual
abuse, neglect is by far the most common form of maltreatment (U.S. Department of
Health and Human Services, 2009). While abuse usually involves an act that places a
child in danger, neglect is the omission of an act, a distinction that may make neglect
cases more difficult to report, diagnose, and treat (U.S. Department of Health and Human
Services, 2009). Of the 794,000 substantiated claims of child maltreatment in 2007, 59%
were cases of child neglect (U.S. Department of Health and Human Services, 2009). In
95% of these neglect cases, other types of maltreatment were also present, indicating that
multiple forms of maltreatment often co-occur (U.S. Department of Health and Human
Services, 2009). There are six types of neglect including physical, emotional, medical,
and educational neglect as well as inadequate supervision and exposure to violent
environments (Leeb, Paulozzi, Melanson, Simon, & Arias, 2008). Out of these subtypes,
supervisory and environmental neglect were most common (Mennen et al., 2010).
Young children are at greater risk for neglect with infants at highest risk (U.S.
Department of Health and Human Services, 2010). Deaths resulting from severe neglect
are also most common in young children (U.S. Department of Health and Human
Services, 2010).
Preventing child maltreatment is an important public health priority (Hammond,
Maltreatment in childhood can have long-lasting effects reaching into adulthood.
Individuals with a history of childhood abuse have increased rates of psychological and
medical illnesses including depression, anxiety disorders, eating disorders, post-traumatic
stress disorder (PTSD), chronic pain syndrome, fibromyalgia, chronic fatigue syndrome
and irritable bowel syndrome (Springer, Sheridan, Kuo, & Carnes, 2003). Child
maltreatment also increases the likelihood of engaging in high-risk health behaviors as
adults (Springer et al., 2003). The Adverse Childhood Experiences study (ACE)
examined the effects of childhood abuse and other adverse experiences (reported
retrospectively) on adult health and health risk behaviors (Felitti et al., 1998). Individuals
with a history of child abuse or household dysfunction had higher rates of obesity,
depression, suicide attempts, ischemic heart disease, cancer, chronic lung disease,
skeletal fractures, and liver disease (Felitti et al., 1998). Abuse or neglect as a child also
increased rates of smoking, physical inactivity, alcoholism, illicit drug use, sexually
transmitted diseases, and high numbers of sexual partners in adulthood (Felitti et al.,
1998).
Research also supports the link between child maltreatment and risky sexual
behavior later in life (Wilson & Widom, 2011). A longitudinal study by Wilson and
Widom (2011) followed children with documented cases of maltreatment into adulthood,
a study spanning over forty years. They found that children with a history of abuse and
neglect were at increased risk for prostitution and early sexual initiation and displayed
higher rates of HIV and other sexually transmitted diseases (Wilson & Widom, 2011).
The association between risky sexual behavior and maltreatment was present across all
for neglect (Wilson & Widom, 2011). Seventeen percent of adults with a history of
maltreatment reported risky sexual behaviors, three times the rate of the control adult
group (Wilson & Widom, 2011).
Risky lifestyle choices are not limited to sexual behaviors, however. Individuals
with a history of abuse and neglect are also at increased risk for delinquency and adult
criminality (Widom & Maxfield, 2001). In a similar longitudinal study, Widom and
Maxfield tracked cases of child maltreatment through criminal records over a period of
twenty-five years (2001). The risk for being arrested as a juvenile increased fifty-nine
percent, as an adult increased twenty-eight percent, and for a violent crime increased
thirty percent in adults who were maltreated as children (Widom & Maxfield, 2001).
Individuals with abusive pasts were also younger at first arrest, committed twice as many
offenses, and were arrested more frequently than the control group adults (Widom &
Maxfield, 2001). In total, “childhood abuse and neglect increased the odds of future
delinquency and adult criminality overall by twenty-nine percent” (Widom & Maxfield,
2001, p.1). These findings support the cycle of violence hypothesis, which suggests that
a history of childhood physical abuse will increase the likelihood of committing violence
in adulthood (Widom & Maxfield, 2001). However, the authors state that this cycle of
violence appears to be present in not only physical and sexual abuse cases, but child
neglect cases as well (Widom & Maxfield, 2001).
Adverse health and behavioral outcomes resulting from a history of child
maltreatment can lead to decreased life functioning, an association present in both males
and females (Springer et al., 2003). If multiple types of maltreatment are present in
Sheridan, Kuo, & Carnes, 2007). The ACE study found a dose-response relationship in
child maltreatment, with risk of disease and risky behaviors increasing with number of
childhood exposures to early adverse experiences including abuse and neglect (Felitti et
al., 1998). Another study found that the association between childhood abuse and poor
adult health outcomes decreased but was still present after controlling for family
background and childhood adversity variables (Springer et al., 2007). The persistence of
the association demonstrates that the act of maltreatment has extremely damaging
consequences that persevere into adulthood.
Treatment Approaches to Child Maltreatment
Families with suspected or confirmed maltreatment are often referred to
“parenting programs” to improve parenting skills. The prevailing treatment strategies in
such programs can be described as supportive case management. Case management
services for child maltreatment are usually managed through Child Protective Services,
the Division of Family and Children Services, or similar governmental agencies (U.S.
Department of Health and Human Services, 2005). Each child maltreatment case is
assigned a case manager who develops a family case plan and arranges for services to
assist in achieving the goals detailed in the plan (U.S. Department of Health and Human
Services, 2005). The case manager monitors and coordinates services, assesses risk, and
makes decisions regarding out-of-home placement of children (U.S. Department of
Health and Human Services, 2005). A study examined the efficacy of case management
of child maltreatment cases in the German healthcare system (Goldbeck,
Laib-Koehnemund, & Fegert, 2007). Case managers had a variety of professions including
Researchers found no support for the hypothesis that case workers found the
interventions to be effective (Goldbeck et al., 2007). Similarly, controlled studies
examining the efficacy of family preservation services have found no effects on
out-of-home placements and recurrence of maltreatment (Littell & Schuerman, 2002;
Schuerman, Rzepnicki, & Littell, 1994). Duration of services, number of services
received, and intensity of caseworker contact also did not affect rates of out-of-home
placement, recurrence of maltreatment, or case closing within the agency (Littell &
Schuerman, 2002). The Illinois Family First Study, a randomized experiment, examined
families assigned to family preservation services compared to those assigned to a
minimal services control group (Schuerman et al., 1994). The study found no differences
between the two groups (Schuerman et al., 1994). Possible reasons for the inefficacy of
case management strategies include case mangers feeling overwhelmed by their
responsibilities and full caseloads, difficulties in inter-institutional cooperation, and
barriers to interagency collaborations and communication (Goldbeck et al., 2007).
Perhaps due to these issues, some child welfare systems are seeking to implement
evidence-based strategies (Chaffin & Friedrich, 2004).
Evidence-based practices (EBP) are services supported by “best-available clinical
science” and have been demonstrated to be both safe and effective (Chaffin & Friedrick,
2004). EBP are programs that have been shown in randomized trials to reduce
maltreatment, and that can be replicated a systematic manner (Chaffin & Friedrich, 2004)
EBP are usually implemented with high standards of competence and fidelity (Chaffin &
Some of the evidence-based strategies for child maltreatment include programs
such as Parent-Child Interaction Therapy (PCIT), MultiSystemic Therapy (MST), the
Incredible Years, the Triple P model, and SafeCare (Chaffin & Friedrick, 2004). PCIT
focuses on the parent-child relationship with both parent and child participating in the
program in an effort to improve interaction skills and decrease problem behavior
(Borrego, Gutow, Reicher, & Barker, 2008). In families reported to Child Protective
Services for child maltreatment, PCIT significantly reduced the reoccurrence of child
abuse (Borrego et al., 2008). The Nurse Family Partnership Model is a home-visiting
program provided by nurses to low-income, first-time mothers (MacMillan et al., 2009).
The program has been extensively tested in randomized controlled trials in a variety of
patient samples and geographic regions (MacMillan et al., 2009). The results of the trials
found that the Nurse Family Partnership Model was effective in preventing future child
abuse and neglect as well as child injuries (Olds et al., 1997). Lastly, the Triple P model,
also known as the Positive-Parenting Program, is a system of parenting and family
support that aims to enhance parental competence and reduce risk factors for child
maltreatment (Prinz, Sanders, Shapiro, Whitaker, & Lutzker, 2009). Evaluations of the
program have found that the Triple P model has a preventive effect on substantiated cases
of child maltreatment, out-of-home child placements, and child maltreatment injuries
(Prinz et al., 2009).
The SafeCare Program
The SafeCare program was developed from its predecessor, Project 12-Ways,
which also aimed to prevent child abuse and neglect (Lutzker & Rice, 1984). Whereas
three (Gershater-Molko, Lutzker, & Wesch., 2003). Project 12-Ways and SafeCare
focus on improving parental skills in several areas and improving the home environment
(Gershater-Molko et al., 2002). For example, in Project 12-Ways, parents were taught
several new skill sets including basic skills training, stress reduction, assertiveness
training, money management, home safety, job training, and parent-child interaction
training (Gershater-Molko et al., 2002).
SafeCare is an evidence-based, parent-training program for parents at-risk for
child maltreatment or for parents who have been reported for abuse or neglect
(Gershater-Molko et al., 2002). The model focuses on three skills: child health, home safety, and
parent-child interaction (or parent-infant interaction depending on the age of the child).
Parents participate in six weekly sessions in each module, with the full program lasting
18 – 20 weeks (Gershater-Molko et al., 2002). The SafeCare model is unique in that it
is one of the only home visiting programs that teach health, safety, and interaction skills
in a brief and targeted manner (Gershater-Molko et al., 2002). Thus, it focuses on both
neglect and physical abuse in newborns to children five years of age, an age group that is
often neglected in maltreatment research (Gershater-Molko et al., 2002).
Evidence for SafeCare
During the development of the SafeCare model, the three modules (parent-child
or infant interaction, health, and safety) were validated using case studies. Researchers
found that parents at risk for child abuse and neglect are often deficient in child
interaction skills (Lutzker, Megson, Webb, & Dachman, 1985). A task analysis of
possible interaction skills was performed to develop a complete list of validated
were judged to display better interaction skills (Lutzker et al., 1985). Cases of child
neglect are often cited when the home environment presents a danger to health (Tertinger,
Greene, & Lutzker, 1984). The validation case study for the safety module involved the
development of the Home Accident Prevention Inventory (HAPI), a tool to assess
hazards in the home (Tertinger et al., 1984). Selected families underwent a baseline
hazard assessment, were given feedback about hazards present, and were instructed on
methods for making hazards inaccessible (Tertinger et al., 1984). Follow-up assessments
showed decreases in hazards in the home, a characteristic that was maintained during an
extended follow-up period (Tertinger et al., 1984). The health module was also assessed
in a validation case study that evaluated the success of the health training portion of
SafeCare. The study included three pairs of participants that were given health training
in the form of written handouts, verbal instructions, modeling, practice, and
reinforcement (Delgado & Lutzker, 1988). Following completion of the program,
participant health knowledge and skill level was assessed to determine level of skill
acquisition (Delgado & Lutzker, 1988). The study found that written materials alone did
not improve parental skills, but actions of modeling, role-playing, and practicing were
more successful in achieving positive results (Delgado & Lutzker, 1988). Validation of
each of the measures allowed researchers to incorporate the three modules in future
SafeCare studies.
Project SafeCare was a four-year research grant project, using recidivism data to
evaluate the efficacy of the SafeCare program (Gershater-Molko et al., 2002) using a
quasi-experimental design. In the study, researchers examined two sets of families, the
received SafeCare (Gershater-Molko et al., 2002). Families who completed SafeCare
or FP were followed for child maltreatment recidivism, or additional reports of child
maltreatment (Gershater-Molko et al., 2002). Three years after the start of the
intervention, 15% of SafeCare families had reports of child maltreatment compared to
44% of families who received the Family Preservation program (Gershater-Molko et al.,
2002). Thus, the SafeCare model was responsible for about a 2/3rds reduction in
maltreatment reports to Child Protective Services (Gershater-Molko et al., 2002).
In a more recent study, researchers examined SafeCare in a statewide full-scale
implementation setting (Chaffin, Hecht, Bard, Silovsky, & Beasley, 2012). The study
involved 2175 parents in the Child Protective Services program and 219 SafeCare
home visitors (Chaffin et al., 2012). The study was a two by two randomized cluster
experiment evaluating SafeCare versus services as usual and coached versus uncoached
implementation strategies (Chaffin et al., 2012). The families were followed for an
average of six years for recidivism data (Chaffin et al., 2012). The SafeCare program
was found to be effective in future reducing child maltreatment reports relative to
services as usual with hazard ratios of 0.74-0.83 (Chaffin et al., 2012). The authors
estimated that for every one thousand cases, assuming the observed recidivism rate of
45% annually, the implementation of SafeCare would prevent between sixty-four and
one hundred and four cases of child maltreatment recurrences (Chaffin et al., 2012).
Importance of Programs such as SafeCare
Evidence-based practices are useful because these programs must be proven
effective and safe prior to implementation (Chaffin & Friedrich, 2004). This policy of
agencies time and resources. Most evidence-based practices rely on cognitive-behavioral
strategies, which have been proven effective in producing positive outcomes
(Gershater-Molko et al., 2002). The SafeCare program targets primary care-givers of the child,
usually a parent, who have received a child maltreatment complaint or who display risk
factors for child maltreatment (Gershater-Molko et al., 2002). In 2006, 75.5% of child
maltreatment perpetrators were the mother, father, or both parents (U.S. Department of
Health and Human Services, 2008). Since parents are responsible for the majority of
child maltreatment cases, parent education and training programs like SafeCare are
important in reducing incidence of child abuse and neglect.
Importance of treatment integrity
Theory-based treatments are made replicable through the use and development of
treatment manuals (Schoenwald et al., 2011). The use of manuals alone, however, does
not ensure that the treatment is being replicated with fidelity, or in the way the
researchers intended (Schoenwald et al., 2011). In fact, several studies have shown that
manuals by themselves are generally not sufficient to produce implementation with
fidelity (Forgatch, Patterson, & DeGarmo, 2005; Mihalic, 2004; Schoenwald &
Henggeler, 2004). Evaluating the fidelity of the treatment delivery is thus a key to
understanding outcomes (Schoenwald et al., 2011). Specifically, fidelity data allows one
to understand the extent to which the critical elements of a program were implemented.
Thus, if there is a failure to find significant effects of an intervention, having fidelity data
can help one know whether the lack of effectiveness was due to a failure of
implementation (that is, the program was not implemented as intended) or a true failure
necessary measure to ensure internal validity (Mowbray, Holter, Teague, & Bybee,
2003). Fidelity data is important because it can be used to improve the quality of both the
training and the treatment (Waltz, Addis, Koerner, & Jacobson et al., 1993).
Schoenwald et al. states that there are three components to treatment integrity:
therapist treatment adherence, treatment differentiation, and therapist competence (2011).
Therapist treatment adherence, referred to here as “fidelity”, is the degree to which a
therapist uses proscribed procedures; treatment differentiation is the degree to which
treatments differ from one another; therapist competence is the level of skill and
judgment in executing treatment (Schoenwald et al., 2011). Each of these three
components captures a unique aspect that may influence treatment outcomes
(Schoenwald et al., 2011). While some research exists on implementation fidelity, there
is a lack of studies examining measures of competence, and little information regarding
the relationship between fidelity and competence. The current study reviews audio
recordings of SafeCare home visiting sessions in an attempt to discover the relationship
between measures of fidelity and competence.
Fidelity
Fidelity, the degree of adherence to treatment protocols, must be measured and
analyzed in order to adequately interpret program outcomes (Schoenwald et al., 2011).
As outlined by Schoenwald and colleagues (Schoenwald, et al., 2011), there are four
main steps in the process of measuring fidelity. The first step is to identify relevant
treatment components, which can include aspects of both treatment structure and process
(Mowbray et al., 2003). The second is to determine who will provide ratings on these
score based on the findings. Fidelity data is usually coded as “occurrence” versus
“nonoccurrence” of a particular event as described in the treatment manual (Waltz et al.,
1993). Fidelity can be assessed using direct or indirect methods (Schoenwald et al.,
2011). A direct method of assessment involves observations of video or audio-taped
sessions or live observations; this method requires a trained observer (Schoenwald et al.,
2011). An indirect method of assessment involves questionnaires and checklists that are
completed by the therapist or client (Schoenwald et al., 2011).
Fidelity indicators should be evaluated for reliability and validity (Mowbray et al.,
2003). First, reliability should be assessed across various coders, examining the rate of
inter-rater agreement (coefficient kappa, percent agreement, or Pearson correlations)
(Mowbray et al., 2003). Coders of fidelity must adhere to coder protocols that will allow
high inter-rater reliability (Schoenwald et al., 2011). Next, the internal structure of the
data should be examined “empirically and in relation to expected results” (Mowbray et
al., 2003). This can be done through a confirmatory factor analysis, internal consistency
reliability, or cluster analysis (Mowbray et al., 2003). Lastly, validity should be assessed,
examining differences between various sources of information and data (Mowbray et al.,
2003). In the present study, inter-rater reliability data will be calculated as well as factor
analysis data of the fidelity variables. Since all of the data comes from a set of audio
recordings, achieving validity data will be difficult. SafeCare fidelity is typically
assessed using the “occurrence/nonoccurrence” method via direct observation either by
live, in-person assessors, or by review of audio recordings of sessions.
Findings suggest that evidence-based programs with high fidelity are linked to
(MST) consultation protocol, researchers examined the relationship among consultant
behavior, therapist fidelity, and child outcomes (Schoenwald, Sheidow, & Letourneau,
2004). Pre- and post-treatment reports of youth behavior and functioning were obtained
as a measure of child outcomes (Schoenwald et al., 2004). Positive associations were
found supporting the link between therapist fidelity and improved youth behavior and
functioning (Schoenwald et al., 2004).
Competence
In contrast to methods of measuring fidelity, competence data is usually measured
on a frequency scale (Waltz et al., 1993). Due to the subjective nature of competence
measures, raters should be knowledgeable of the program and have the ability to
recognize session context (Waltz et al., 1993). In a study assessing the Oregon Model of
Parent Management Training, researchers evaluated five dimensions of competence:
knowledge, structure, teaching skill, clinical skill, and overall effectiveness (Forgatch et
al., 2005). Coders scored competence using ten-minute segments from videotapes of
therapy sessions (Forgatch et al., 2005). Each of the five dimensions was scored on a
nine-point scale, with nine being the most competent value (Forgatch et al., 2005). The
five items remained separate during analysis and were evaluated using principal
components factor analysis, Cronbach’s alpha reliability, and intraclass correlation
coefficients (Forgatch et al., 2005). Another study scored competence on a five-point
scale, rating the extent to which the six or seven core elements were present in the session
(Luborsky, Woody, McLellan, O’Brien, & Rosenzweig, 1982). A score of one meant the
element did not occur at all, a score of five meant the element was “very much” present
researchers performed inter-rater reliability tests (Luborsky et al., 1982). Correlation
tests among the items revealed high degrees of intercorrelation, preventing further
statistical analyses to examine how the scores varied by treatment type (Luborsky et al.,
1982).
As stated previously, therapist competence is a component of treatment integrity
involving the level of skill and judgment in executing treatment (Schoenwald et al.,
2011). The treatment protocol should be executed in such a way to promote behavioral
change (Forgatch, Patterson, & DeGarmo, 2005). In program implementation, therapists
must stay true to theory but also be able to adapt to the specifics of the treatment context
(Forgatch et al., 2005) such as degree of impairment of client, client’s life situation and
stress, particular problems of the client, stage of therapy, degree of improvement, and
sensitivity to intervention timing (Waltz et al., 1993).
This ability to adapt to circumstances appears to increase with therapist
experience (Forgatch et al., 2005). In the evaluation of the Oregon Model of Parent
Management Training, experienced therapists spent 60% of the time on the session
agenda, compared to 80% of the time for less experienced therapists (Forgatch et al.,
2005). The less experienced therapists had higher rates of dropout, suggesting that
therapist competence may increase family retention. Competence is necessary to an
evidence-based program to ensure that the program is being implemented in the way it
was intended. High levels of competence may also correlate to better outcomes. A
recent study supported this hypothesis where high therapist competence ratings predicted
inform the training of therapists, improving the quality of both the training and treatment
for future implementations (Waltz et al., 1993).
Past Research on the Fidelity and Competence Relationship
Although fidelity and competence are both considered components of treatment
integrity (Schoenwald et al., 2011), little research has been conducted to understand the
relationship between the two constructs. Some researchers have combined the two
measures into a single concept called “competent adherence” (Forgatch et al., 2005).
Competent adherence requires both for the procedures to be carried out and for the
procedures to be carried out with sophisticated skill that promotes behavioral change
(Forgatch et al., 2005). As noted, the two constructs are typically measured in a different
manner; fidelity an occurrence/nonoccurrence, and competence on a frequency scale
(Waltz et al., 1993). While some research exists on fidelity of evidence-based programs,
little research exists on competence and almost no research exists examining the
relationship between the two measures. It reasons that the two concepts would be related
as they are both part of overall treatment integrity, but the exact relationship is still to be
determined. Moreover, little is known about which of the variables is more important in
changing the behavior of the client or family. That is, is it more important to have a
therapist who is highly adherent to a protocol, one that is highly competent, or both?
The current research
The current study aims to fill the gap in the literature regarding the relationship
between fidelity and competence. This goal will be accomplished by coding SafeCare
audio recordings for measures of both fidelity and competence and then analyzing the
scored as occurrence/non-occurrence, and competence will be scored on a likert-type
Chapter III
METHODS AND PROCEDURES
This study, (Protocol Number: H09125), was approved by Georgia State University
Institutional Review Board in October, 2011.
Description of Data and Data Source
The data for this study was obtained from 209 audio recordings of SafeCare
sessions made by home visitors during implementing SafeCare in Georgia. At the time
the data was aggregated, the Georgia statewide implementation of SafeCare had
involved a total of 50 agencies and 295 individuals receiving training (Whitaker et al.,
2012). Audio recordings were selected for coding as part of a larger evaluation of
SafeCare in Georgia. Out of 1320 audios, 217 audios were selected to be coded by
NSTRC research staff. Eight of the 217 audios were incomplete or corrupt and were
removed from the dataset, bringing the final number to 209 audios. The audios were
selected from audios from 61 different home visitors (who were coached by 34
individuals). Selection of audios for coding was done to distribute recordings across
home visitors and coaches as much as possible to examine variation according to those
factors (not reported here). When available, each home visitor had a minimum of two
audios selected for coding. For these analyses, 6 home visitors contributed 1 recording,
16 contributed 2 recordings, 8 contributed 3 recordings, 10 contributed 4 recordings, 4
contributed 5 recordings, 5 contributed 6 recordings, 1 contributed 7 recordings, 4
all three SafeCare modules: home safety (N = 61), health (N = 68), and parent child (N
= 46) or infant interaction (N = 34). Sessions were either baseline assessment sessions (n
= 52), training sessions (n = 137), or end of module sessions (n = 20). The number of
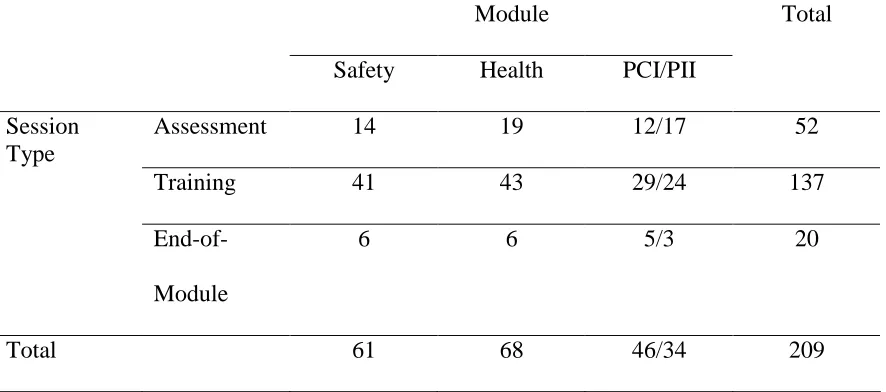
[image:31.612.105.548.240.436.2]audios in each module and session type are described in Table 1.
Table 1. Number of Audios Stratified by Module and Session Type
Module
Safety Health PCI/PII
Total
Assessment 14 19 12/17 52
Training 41 43 29/24 137
Session Type
End-of-Module
6 6 5/3 20
Total 61 68 46/34 209
Demographic Information of Home Visitors
Demographic information was available for 232 of the 295 individuals receiving
training, as 63 did not complete the demographic forms (Whitaker et al., 2012). The
average age of the trainees was 39.8 years, 88.1% were female, and 60% were African
American (Whitaker et al., 2012). The group of trainees was highly educated with 86.1%
having a Master’s degree or Ph.D, and largely new to the field with 76.6% having less
than five years work experience (Whitaker et al., 2012). Note that these numbers
represent the overall pool of home visitors, not necessarily the home visitors whose
the home visitors for the present study, the information is presented to give an idea of the
qualifications and demographic characteristics often found in a SafeCare home visitor.
Study Procedure
Coding of fidelity and competence was conducted by six individuals (two full
time staff and four Masters of Public Health graduate students). Coders were trained in
the fidelity coding process before beginning the current study. Training included review
of the training manual containing detailed session outlines that home visitors followed as
well as the fidelity checklists with definitions for each item. Coders attended weekly
group meetings to assess coding procedures, discuss problems encountered in coding, and
to make improvements in the definitions that would improve coder reliability. Several
practice audio recordings were coded as a group during these meetings to establish
reliability and resolve discrepancies. Coders established reliability on the fidelity measure
of greater than 90% prior to independent coding.
At the beginning of the study, a six-item three-point competence scale was
created for each type of session (assessment, training, and end-of-module). Because the
competence measures were new (unlike fidelity measures), coders met extensively with
NSTRC faculty to discuss and refine the competence definitions. Because the
competence scales were newly developed, there was no minimum reliability score for
coders prior to independent coding. Coders scored several audios for competence as a
group in an effort to make the coding as reliable as possible. Due to time constraints of
the current project, it was not possible to wait until reliability for competence coding
Each coder was assigned audio recordings to code over the course of four months
by the study coordinator. Eleven percent (n = 22) of recordings were double coded for
inter-rater fidelity reliability; ten percent (n=20) of recordings were double coded for
inter-rater competency reliability.
Description of Fidelity and Competence Checklists
In keeping with normal convention for SafeCare implementation, coders scored
fidelity using three standard SafeCare fidelity checklists, one each for assessment,
training, and end of module sessions (See Appendix A for checklists). Coders also
scored competence using three standard SafeCare competence checklists, one each for
assessment, training, and end of module sessions (See Appendix B for checklists). The
three fidelity and competence checklists contained slightly different content that was
pertinent to the type of session being conducted.
During the period of coding for this project, the SafeCare fidelity checklists were
undergoing a revision. As a result, two slightly different sets of fidelity forms were used
in the coding of this project. One hundred forty four audios were coded using one set of
items, and 65 were coded the slightly different set of items. To utilize all the data, items
across the two forms were “combined” into a single set of 34 items common to both
forms (both forms captured all of the important content of SafeCare; the revision was
made to simply and clarify some items). The final set of fidelity items included 7 items
unique to the assessment form, 6 items unique to the training form, 7 items unique to the
end-of-module form, 1 item included in both the assessment and training forms, 1 item
included in both the training and end-of-module forms, and 12 items found in all three
All fidelity checklists were scored on a dichotomous scale with a “not applicable”
option. Using the definitions provided in the training manual, each item was scored as a
“+”, “-“, or “n/a”, indicating whether the behavior was performed or not, or was not
relevant (either the provider did not have the opportunity to perform the item, the item
did not apply to that specific session, or the coder was unsure whether the action occurred
because of the audio recording).
A six-item, three-point competency scale was developed for the purpose of
scoring SafeCare home visiting audio recordings. Three competency checklists were
created that differed slightly depending on the session. All three competency checklists
(assessment, training, and end of module), contained the items “Home Visitor Conduct”,
“Clinical Skills”, “Home Visitor Responsivity” and “Session Closing Skills”. The
assessment checklist contained the items “Module and Session Illustration” and “Formal
Assessment Skills”. The training checklist contained the items “Session and Assessment
Illustration” and “Training Skills”. The end of module checklist contained the items
“Session and Assessment Illustration” and “Feedback and Generalization of Skills”. The
six competence items were determined to be similar constructs across all three forms, and
thus six final competence items were formed for the dataset:
“Module/Session/Assessment Illustration”, “Home Visitor Conduct”, “Clinical Skills”,
“Formal Assessment/Training/Feedback Skills”, “Home Visitor Responsivity”, and
“Session Closing Skills” (see Appendix D).
Competence was rated on a one to three scale with the option of “n/a” for
“Module/Session/Assessment Illustration” and “Home Visitor Responsivity”. Definitions
usually a case in which the home visitor neglected large portions of the guidelines, or
performed actions in a manner that was ineffective or offensive to the parent. A score of
“2” was usually a case in which the home visitor accomplished some goals, but not all, or
the items were accomplished in a manner that could be improved. A score of “3”
indicated no room for improvement; the home visitor accomplished everything stated in
the session guidelines in an effective manner. Scores of “n/a” were used in cases where
the items were not captured on the audio or where opportunities for the item did not arise.
Inter-rater Reliability
Reliability was assessed by computing percent agreement on an item-by-item
basis for both fidelity and competence. Responses for each audio were compared using a
binary variable method (yes/no), representing the agreement between the two coders. For
example, if both coders scored “+” for fidelity item 1, it counted as a “yes” for fidelity
agreement. Similarly, if both coders scored a “3” for competence item 1, it counted as a
“yes” for competence agreement. Percent agreement was calculated by adding up total
items agreed upon divided by total number of items scored. Eleven percent of audios
(n=22) were double coded for inter-rater fidelity reliability. The average fidelity percent
agreement for all twenty-two audios was 92.2%. Inter-rater fidelity reliability stratified
by session and module type is shown in Tables 2 and 3, respectively. Reliability
appeared somewhat lower for end of module sessions, but note that only two sessions
were included. Ten percent of audios (n=20) were double coded for inter-rater
competence reliability. The average competence percent agreement for all twenty audios
was 70.8%. Inter-rater reliability for competence stratified by session and module type
Table 2. Inter-rater Reliability for Fidelity by Session Type
Session Type
Assessment (n=4) Training (n=16) End-of-Module (n=2)
Percent Agreement
(%)
97.70 91.85 83.95
[image:36.612.104.554.293.408.2]Total = 92.2
Table 3. Inter-rater Reliability for Fidelity by Module Type
Module Type
Safety (n=9) Health (n=7) PCI/PII (n=6)
Percent Agreement
(%)
90.3 92.24 94.99
Total = 92.2
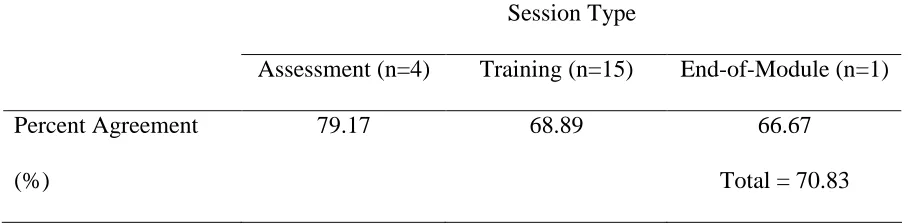
Table 4. Inter-rater Competence Reliability by Session Type
Session Type
Assessment (n=4) Training (n=15) End-of-Module (n=1)
Percent Agreement
(%)
79.17 68.89 66.67
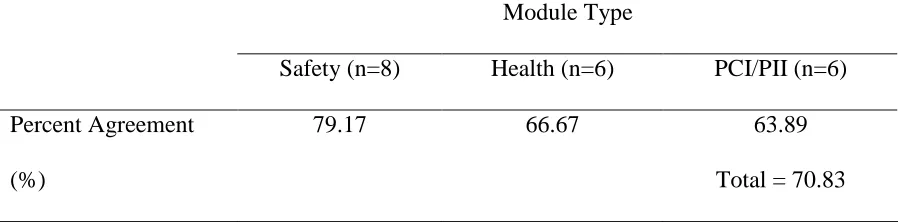
[image:36.612.101.555.491.603.2]Table 5. Inter-rater Competence Reliability by Module Type
Module Type
Safety (n=8) Health (n=6) PCI/PII (n=6)
Percent Agreement
(%)
79.17 66.67 63.89
Total = 70.83
Statistical Analyses
Data were entered and analyzed using SPSS version 18. Fidelity responses were
input in the format: “-“= 0, “+”= 1, and “N/A”= missing. Competency responses were
input in the format: “1”= 1, “2”= 2, “3”= 3, and “N/A”= missing. Before conducting the
primary analyses examining the relationship between fidelity and competence, analyses
Chapter IV
RESULTS
Analysis of Fidelity Scale
Fidelity Factor Analysis
Factor analyses were performed on fidelity items in an attempt to examine the
dimensions that may be present on the fidelity scales. Because each fidelity checklist
contained different items, factor analyses were conducted by module type (e.g., one
factor analysis for ratings of assessment sessions, one for training sessions, and one for
end-of-module sessions). This reduced the number of cases available for the factor
analyses to 52 for assessment sessions, 137 for treatment sessions, and 20 for end of
module sessions. Because of the sample sizes, factor analyses were focused on the
assessment and treatment sessions. However, due to the high rates of missing data (n/a’s)
and low variance (very few “-“), stable factor structures could not be found. When the
n/a’s were set to missing, too few cases remained to interpret the results. A coding
structure in which “-“, “n/a”, and “+” were coded as -1, 0, and 1 respectively was
attempted. However, there was too little variance on some items to yield a reliable factors
structure. Some items had no variance at all.
Classification of Fidelity Checklist Items
To examine two aspects of fidelity prominent in the literature (Moncher & Prinz,
1991), and in keeping with past research (Tiwari, 2010), fidelity checklist items were
items involved communication skills and the ability to interact with the family (Tiwari,
2010). Content fidelity items involved integral components of the SafeCare model and
parent skills training (Tiwari, 2010). Categorization of assessment and training checklist
items were collected from previous research (Tiwari, 2010). Tiwari’s (2010) research
process involved three NSTRC staff and one faculty member reviewing the items and
classifying each as “content”, “process”, or “both” (overlap between the two categories)
(Tiwari, 2010). If three responses were in agreement, the item was classified as content
or process. Items classified as “both” were considered as both content and process. If the
raters did not reach an agreement, the item was not classified. The same process was
utilized for several additional items (those found on the end-of-module checklist) that
were not categorized in Tiwari’s work. Four raters were asked to categorize an additional
seven end-of-module fidelity items. In total, 9 items were categorized as process fidelity,
19 were categorized as content fidelity, and 6 were not categorized. Three main variables
were created for the dataset: content fidelity (n=19), process fidelity (n=9), and total
fidelity (n=34). Each variable was created by calculating the percent of “+” over the total
number of items scored as “+” or “-“. The breakdown of fidelity item categorization can
be found in Appendix C.
Analysis of the Competence Scale
Internal consistency
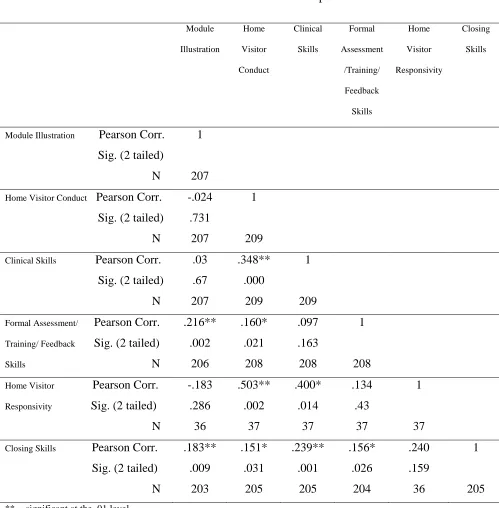
Correlations were performed for the six competence items (shown in Table 6).
For the most part, ratings were not highly correlated. Item 2 (Home Visitor Conduct)
Skills) correlated with item 5 (Home Visitor Responsivity) at a level of .40. All of the
other correlations fell below .40.
Cronbach’s Alpha reliability test was performed using the six competence items.
Due to the high rates of missing data for item 5 (Home Visitor Responsivity), this item
was omitted and the test was repeated using items 1, 2, 3, 4, and 6. The Cronbach’s
Table 6. Correlation of All Six Competence Items Competence Item Module Illustration Home Visitor Conduct Clinical Skills Formal Assessment /Training/ Feedback Skills Home Visitor Responsivity Closing Skills
Module Illustration Pearson Corr.
Sig. (2 tailed)
N
1
207
Home Visitor Conduct Pearson Corr.
Sig. (2 tailed)
N -.024 .731 207 1 209
Clinical Skills Pearson Corr.
Sig. (2 tailed)
N .03 .67 207 .348** .000 209 1 209
Formal Assessment/ Pearson Corr.
Training/ Feedback Sig. (2 tailed)
Skills N
.216** .002 206 .160* .021 208 .097 .163 208 1 208
Home Visitor Pearson Corr.
Responsivity Sig. (2 tailed)
N -.183 .286 36 .503** .002 37 .400* .014 37 .134 .43 37 1 37
Closing Skills Pearson Corr.
Sig. (2 tailed)
N .183** .009 203 .151* .031 205 .239** .001 205 .156* .026 204 .240 .159 36 1 205
Competence Factor Analysis
Initially, a principal components factor analysis with Varimax rotation was
performed on the six competency items. However, all but 35 cases were eliminated due
to the large numbers of missing values (n/a’s) for the Home Visitor Responsivity item.
Thus, a factor analysis with Varimax rotation was conducted with the remaining five
items (N=202). Results showed that a two-factor structure fit the data best. As seen in
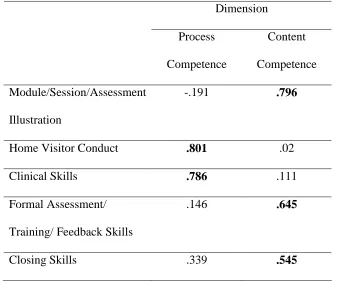
Table 7, there were two eigenvalues greater than one, and the two-factor solution
accounted for 56% of the variation among the items. The first factor included two items
that loaded at greater than .60 (Home Visitor Conduct and Clinical Skills), and was
termed process competency as it involves communication and interaction skills, similar to
process fidelity (see Table 8). The second factor included three items that loaded at
greater than .50 (Module/Session/Assessment Illustration, Formal
Assessment/Training/Feedback Skills, and Closing Skills) and was termed content
competency as it involves components of the SafeCare model, similar to content fidelity
(see Table 8). Given the results of the factor analysis, three variables were created for
competency: content competency (the mean of 3 items), process competency (the mean
Table 7. Factor analysis results from the five competence items
Initial Eigenvalues Components
Total % of Variance
1 1.629 32.589
2 1.164 23.272
3 .865 17.308
4 .723 14.451
5 .619 12.38
Table 8. Loadings for two-factor solution from factor analysis of competence items.
Dimension
Process
Competence
Content
Competence
Module/Session/Assessment
Illustration
-.191 .796
Home Visitor Conduct .801 .02
Clinical Skills .786 .111
Formal Assessment/
Training/ Feedback Skills
.146 .645
[image:43.612.99.437.351.632.2]Correlations between the two raters for the mean competence score were
examined, as well as the process and content competence means (shown in Table 9). The
two raters scores for total competence were modestly correlated, r = 0.498 (p < .05), but
scores for process competence (r = .33) and for content competence (r = .159) were not
significantly correlated. There was some variation in correlations by module type and
session type with Safety sessions and assessment sessions having the highest correlations,
but there are likely too few cases to suggest meaningful differences. These low
correlations, along with the reliability results presented above, suggest that inter rater
reliability for competence was poor.
Table 9. Correlation of Inter-rater Competence Reliability
Competence Dimension
Process
Competence
(n=20)
Content
Competence
(n=20)
Total
Competence
(n=20)
Pearson correlation .333 .159 498*
** = significant at the .01 level * = significant at the .05 level
Primary Analyses: Fidelity-Competence Correlations
Pearson correlation analyses were performed with the six main variables: content
fidelity, process fidelity, total fidelity, content competence, process competence, and total
competence. Table 10 displays descriptive statistics for all sessions combined and Table
highlight the correlations between process fidelity and process competence, content
fidelity and content competence, and total fidelity and total competence (correlations that
we would expect to be the highest). Process fidelity correlated with process competence
at .383, content fidelity correlated with content competence at .629, and total fidelity
correlated with total competence at .615. The overall correlations of .615 suggest that
fidelity and competence are strongly related, but are perhaps different constructs.
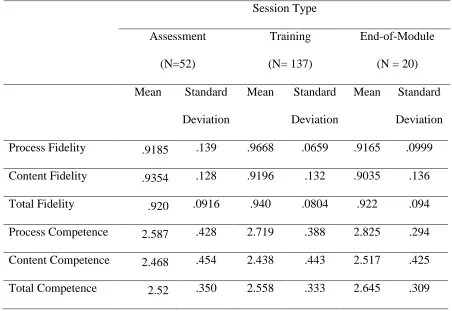
Correlations by session type were also examined (assessment, training, end of
module). Table 12 shows descriptive statistics of fidelity and competence session type,
and Table 13 presents the results of the correlational analyses. The bolded values in
Table 13 highlight values for process fidelity and process competence, content fidelity
and content competence, and total fidelity and total competence correlations. For process
fidelity and process competence correlations, assessment sessions were most highly
correlated at .528, with training sessions lowest at .285, and end-of-module sessions in
the middle at .444. For content fidelity and content competence correlations, all session
types were relatively equal with correlation values of .621, .637, and .641 for assessment,
training, and end-of-module sessions, respectively. For total fidelity and total
competence correlations, all session types were relatively equal with correlation values of
.641, .616, and .613 for assessment, training, and end-of-module sessions, respectively.
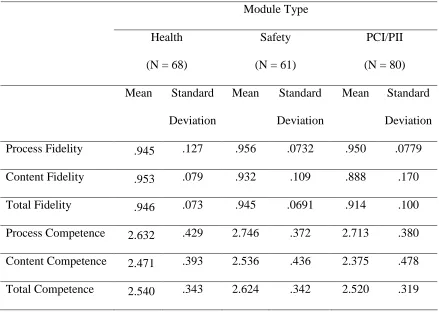
Correlation analyses were repeated, stratifying the data according to module type
(shown in Table 15). Table 14 shows descriptive statistics stratified by module type.
The bolded values in Table 15 highlight values for process fidelity and process
competence, content fidelity and content competence, and total fidelity and total
sessions were most highly correlated at .452, with safety sessions lowest at .259, and
parent-child/parent-infant interaction sessions in the middle at .379. For content fidelity
and content competence correlations, parent-child/parent-infant interaction sessions were
most highly correlated at .726, health sessions were lowest at .395, and safety sessions
were in the middle at .636. For total fidelity and total competence correlations,
parent-child/parent-infant interaction and health sessions were relatively equal with .657 and
[image:46.612.97.590.318.577.2].636 respectively, with safety sessions slightly lower at .568.
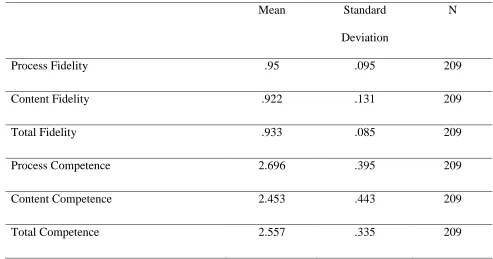
Table 10. Descriptive Statistics for Fidelity and Competence ratings for All Sessions
Mean Standard
Deviation
N
Process Fidelity .95 .095 209
Content Fidelity .922 .131 209
Total Fidelity .933 .085 209
Process Competence 2.696 .395 209
Content Competence 2.453 .443 209
Table 11. Fidelity-Competence Correlation Analysis for All Sessions
Process Fidelity Content Fidelity Total Fidelity
Process Competence Pearson corr.
Sig. (2-tailed)
N
.383**
.000
209
-.016
.822
209
.214**
.002
209
Content Competence Pearson corr.
Sig. (2-tailed)
N
.348**
.000
209
.629**
.000
209
.669**
.000
209
Total Competence Pearson corr.
Sig. (2-tailed)
N
.467**
.000
209
.469**
.000
209
.615**
.000
209
Table 12. Descriptive Statistics for Fidelity and Competence Ratings by Session Type
Session Type
Assessment
(N=52)
Training
(N= 137)
End-of-Module
(N = 20)
Mean Standard
Deviation
Mean Standard
Deviation
Mean Standard
Deviation
Process Fidelity .9185 .139 .9668 .0659 .9165 .0999
Content Fidelity .9354 .128 .9196 .132 .9035 .136
Total Fidelity .920 .0916 .940 .0804 .922 .094
Process Competence 2.587 .428 2.719 .388 2.825 .294
Content Competence 2.468 .454 2.438 .443 2.517 .425
Total Competence 2.52 .350 2.558 .333 2.645 .309
Table 13. Fidelity-Competence Correlation Analysis Stratified by Session Type
** = significant at the .01 level * = significant at the .05 level
Session Type
Assessment (n=52) Training (n=137) End-of-Module (n=20)
Table 14. Descriptive Statistics for Fidelity and Competence by Module Type
Module Type
Health
(N = 68)
Safety
(N = 61)
PCI/PII
(N = 80)
Mean Standard
Deviation
Mean Standard
Deviation
Mean Standard
Deviation
Process Fidelity .945 .127 .956 .0732 .950 .0779
Content Fidelity .953 .079 .932 .109 .888 .170
Total Fidelity .946 .073 .945 .0691 .914 .100
Process Competence 2.632 .429 2.746 .372 2.713 .380
Content Competence 2.471 .393 2.536 .436 2.375 .478
Total Competence 2.540 .343 2.624 .342 2.520 .319
Table 15. Fidelity-Competence Correlation Analysis Stratified by Module Type
** = significant at the .01 level * = significant at the .05 level
Module Type
Health (n=68) Safety (n=61) PCI/PII (n=80)