SLAVE LOGIC ANALYZER
2302-5012-00July 1981
GenRadjDevelopment Systems Division 5730 Buckingham Parkway
REVISION HISTORY
Title
Slave Logic Analyzer
RELATED PUBLICATIONS
Slave Emulator Control Unit Hardware, Reference Manual
_GenRad
e GenRad/DSD,. 1981
0-2 Revision History
Number
-
Date Notes2302-5012-00 7/81 First Edition
2302 -5000· .. 00
PREFACE,
This manual introduces and discusses the concepts of Slave Logic Analyzer operation. It prepares the user to i nsta 11 and operate the SLA for debuggi ng prototype system in real time. Special emphasis is given to system commands and console displays. This manual consists of:
Chapter 1, INTRODUCTION, covers the basi cs of the Slave Logic Analyzer subsystem, specifications, and documentation.
Chapter 2, SERVICE AND
provisions of customer
information.
MAINTENANCE, describes
servi ce and parts
Chapter 3, INSTALLATION, di scusses Logi c Analyzer support and installation.
Chapte~ 4, OPERATION, narrates the technique of
invoking the Slave Logic Analyzer, presents general
operation of the system, defines. the use of
commands, and details the finer points of Logic Analyzer operation.
The information in this manual is subject to change without prior notice.
Please note that a Documentation Reply Card is
included in this manual. When you complete and
return it, you help us produce better documentation for you.
A User Regi stration Card is i ncl uded in the set
of manual s you recei ve with your GenRad/DSD
system.: When you compl ete and return the User
Registration Card, you ensure that you will receive
all updates and new information for your
configuration.
For your convenience, a 1 ist of GenRad/DSD Service
CONTENTS
PAGE
CHAPTER 1 - INTRODUCTION
.1.1 PURPOSE AND SCOPE 1-1
1.2 SLA OVERVIEW 1-1
1.3 SLA SUBSYSTEM DESCRIPTION 1-2
1.3.1 The· SLA Card 1-2
1.3.2 SLA Card Digest 1-2
1.4 SPECIFICATIONS 1-4
1.4.1 The SLA Card 1-4
1.4.2 Cable Assembly, Internal (LA-P3 To EP-P3) 1-4
CHAPTER 2 - SERVICE AND MAINTENANCE
2.1 CUSTOMER SERVICE
2.2 INSTRUMENT RETURN 2-1 2-1
2-1 2-1 2-3 2-5 2-6
2-8
2-15 2.2.1 Returned Material Number
2.2.2 Packaging 2.3 PARTS LIST
2.4 IC INFORMATION
2.5 MNEMONIC DESCRIPTIONS 2.6 LOGIC SCHEMATICS . 2.7 ASSEMBLY DIAGRAMS
CHAPTER 3 - INSTALLATION
3.1 PREPARATION
CONTENTS. (COntinued)· '.
CONTENTS (Concluded)
CHAPTER'4 .. OPERATION"
4.1
INTRODUCTION
4.1.1 Command Definitions
4.2
GENERAL OPERATION
4.3
DETAILS OF LOGIC ANALYZER OPERATION
4.4
COMMANDS
4.4.1 Wi ndow Mode Conmand 4.4.2 Mode Conmand
4.4.3 Breakpoint Command 4.4.4 Qualify Trace Command
GENRAD/DSO'SERVICE LOCATIONS
0-6 Contents
PAGE
4-1 4-2 4-3 4-4 4-7 4-8 4-15 4-18 4-19
ILLUSTRATIONS
FIGURES PAGE
1-1 Logic Analyzer Block Diagram 1-3
2-1 Logic Schematic Section 2-9
ABBREVIAT,IONS' .
ABBREVIATION ADS ASCII AWG, BCD BP BUF CAP CER CONN CPU DIP DR DSD EP FF GND HEXIt
INV LALB/SQ IN. LED ":MEM MOT MUX MV OCTD OSC POS PROM PWB RAM REC RIB ROM SEL SIP SLA SPR ST TANT TI 2302·5012-00 DEFINITION
Advanced Development System
American Standard Code for Information Interchange'
American Wire Gauge Binary Coded Decimal Breakpoint
Buffer Capacitor Ceramic Connector
Central Processor Unit Dual In-line Package Driver
Development Sys·tems Division Emulator Personal ity
Flip-Flop Ground Hexadecimal
Integrated Circuit Inverter
Logic Analyzer
Pounds Per Square Inch Light Emitting Diode Memory Motorola Multiplexor Multivibrator Octal Oscillator Positive
Programmable Read Only Memory Printed Wiring Board
Random Access Memory Receiver
Ribbon
Read-Only Memory Select
Single-In-Line Package Slave Logic Analyzer Sprague
State Tantalum
Texas Instruments
CHAPTERt
INTRODUCTION
1.1 PURPOSE AND SCOPE
The purpose of this manual is to inform and instruct the user specifically about the Logie Analyzer portion of the Slave Emulator. The depth of coverage is sufficient for the intended purpose. This manual has been prepared
assuming the user has a knowledge of GenRad Advanced Development System operation, including the Sl ave Ernul ator.
1.2 SLA OVERVIEW,
The SLAsimp1ifies. debugging and. troubleshooting tasks by displaying detailed pictures of time-related events within digital circuits. This allows the user to view bus data during program execution.
The SLA has a sampling rate of 10MHz. Information is recorded synchronously
with the system, and stored in an area of memory contained in the SLA hardware.
The SLA samples and stores. a maximum of 256 traces for up to 24" address lines, up to 16 data lines, four external user-defined lines, and 20
processor-dependent lines. A hardware register (Trace Qualifier) selects the trace to be stored in SLA memory.
1.3
SLA SUBSYSTEM DESCRIPTION
The SlA subsystem consists of one 2302-4746-01 logic Analyzer card and one 2302-0234-01 Cable Assembly for Internal lA-P3 to EP-P3 connection.
1.3.1
THE SLA CARD
Th~' bogic'Analyzer '-ls'"a'stand'ara Sl ave Emulator card with two' rear double-sided edge connectors, P3 and P5, for interfacing the Breakpoint and Emulator
personality cards. The front edge connectors, PI and P2, plug into the motherboard (backpl an e) • PI and P2 are identical on all Ernul ator cards. There are approximately 122 components on this card, containing 256x4 RAMs, assorted IC logic arrays, resistor PAKs, a 20MHz crystal oscillator,
capacitors and resistors.
1.3.2
SLA CARD DIGEST
The SlA card records bus signals during emulation, beginning at a specific event which is predetermined on the breakpoint card. The SlA 24-bit cycle counter records, the time (or bus cycle) between two events. These two events are detected ,by Breakpoints land 2. Breakpoint 1 starts the count and
Breakpoint 2 ends the count. The SlA card records specified bus cycles dete.rmi ned by the trace qua 11 fi e r.
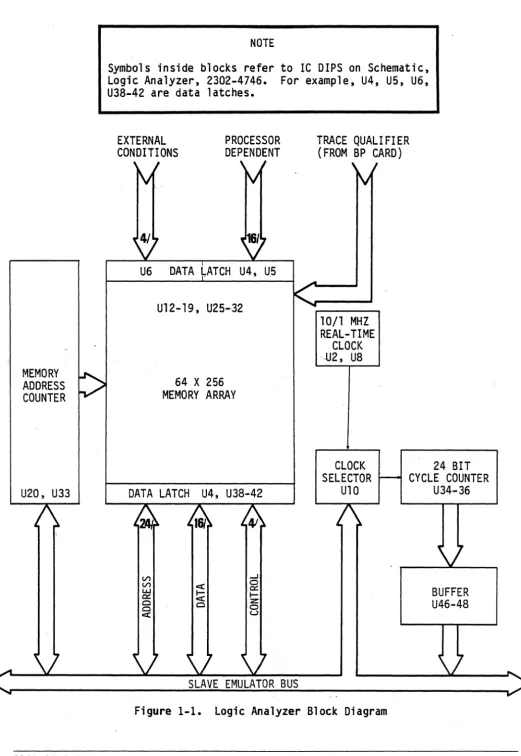
The SlA block diagram is shown in Figure 1-1. Notice that memory logic falls into two groups:
(1) mai n memory and (2,) memory address counters. Traces are stored in si xteen 256 x 4-bit main memory RAMs. Information to be stored can be restricted to a READ or WRITE to a specified location. The memory addresses are two 4-bit synchronous counters for addresses AO through A7.
Data latches coming off the bus consist of 24 address lines (BAO-BA23), 16 data lines (BOO-BOIS), and four control lines (X6, R/W-, X17, and BHE).
Non-bus signa·ls are 16 processor-dependent inputs {XO-X1S} and four external conditions (ECO-EC3).
The timinglogic'conststsof a 20MHz crystal clock source and a lO/IMHz
real-time clock, a clock selector, and a 24-bit cycle counter working into the bus through a buffer array carrying BOO-B07.
MEMORY
:>
ADDRESSCOUNTER
U20, U33
v
NOTE
Symbols inside blocks refer to IC DIPS on Schematic, Logie Analyzer, 2302-4746. For example, U4, U5, U6, U38-42 are data latches.
EXTERNAL CONDITIONS
, I
V
PROCESSOR DEPENDENT
, I
~
U6 DATA 1ATCH U4, U5
U12- 19, U25-,32
64 X 256 MEMORY ARRAY
TRACE QUAL! FI ER (FROM BP CARD)
, I
~
10/1 MHZ REAL-TIME
CLOCK -U2, U8
CLOCK 24 BIT
DATA LATCH U4, U38-42
(/')
(/') UJ
0:::
Cl Cl
ex:
v
SELECTOR r-- CYCLE COUNTER
U10 U34-36
1\
v
[image:11.618.55.576.13.768.2]1.4 SPECIFICATIONS
1.4.1 THE SLA CARD
Width: Length: Thickness: Weignt::,~
9 inches (23 cm)
12
inches{30
cm}.06 inches (1-1/2 mm) 8·oz. (226.8 grams)
1.4.2 CABLE ASSEMBLY,INTERNAL (LA-P3 TO EP-P3)
Overall Length: 3.25 inches {8 cm}
CHAPTER 2
SERVICE AND MAINTENANCE
2.1 CUSTOMER SERVICE
Our warranty (at the front of this manual) refers to the materials and workmanship of our product. If a malfunction occurs, our service engineers will assist in any way possible. If the difficulty cannot be eliminated by use of the following service instructions, please write or phone the nearest GenRad/DSD ser.vice. facility, giving full information about the trouble and the steps taken to remedy it. Describe the instrument. by name, catalog number, serial number, and ID lot number if any. (Refer to front and rear panels.)
2~2 INSTRUMENT RETURN
2.2.1 RETURNED MATERIAL NUMBER
Before returning an instrument to a GenRad/DSD facility for service, please ask our nearest office for a "Returned Material" number. Use of this number
in correspondence and on a tag tied to the instrument will insure proper handling and identification. After the initial warranty period, please avoid unnecessary delay by sending a purchase order number.
2.2.2 PACKAGING
To safeguard your instrument during shipment, please use packaging that is adequate to protect it from damage during shipment. Use of the original packaging is preferable. Any GenRad/DSD field office may advise or provide packing material for this purpose. Contract packaging companies in many cities provide dependable custom packaging on short notice. The three recommended packaging methods are:
a. Rubberized Hair b. Excelsior
a. Rubberized Hair. Cover painted surfaces of instrument with protective wrapping paper. Pack instrument securely in strong protective corrugated container (3501b/sq. in., bursting test), with 2-inch rubberized hair pads placed along all surfaces of the instrument. Insert fillers between pads and container to ensure a snug fit. Mark the box "Delicate
Instrument" and seal with strong tape or metal bands.
b. Excelsior. Cover painted surfaces of instrument'with protective wrapping pape·r. ·.Packinstrument·instrong corrugated container (350 lb/sq. in., bursting test), with a layer of excelsior about six inches thick packed fi rmly against all surfaces of the instrument. Mark the box "Del icate Instrument" and seal with strong tape or metal bands.
c. Bubble Pack. Bubble packs are continuous thin sheets of clear double sealed plastic material with bulging air bubbles spaced along the sheet to act as cushions. Cover painted surfaces of instrument with protective wrapping paper. Pack instrument in strong corrugated container (350
lb/sq. in., bursting test), with several layers of bubble pack wrapped firmly against all surfaces of the instrument. Mark the box "Del icate Instrument" and seal with strong tape or metal bands.
2.3 PARTS LIST
These parts lists are only for the Logic Analyzer card and Internal Cable Assembly. When ordering parts, use the full description.
PARTS LIST
LOGIC ANALYZER 2302-4746-01
lITEM PART NO. QTY DESCRIPTION MFR MFR PART NO. SYMBOL
1 2302-0746-01 1 PWB, LOGIC ANALYZER
2 5431-8600-00 2 IC, 4/2-IN POS NAND TI SN74LSOON U3,24
3 5431-8761-00 1 IC, BINARY 4-BIT COUNT TI SN74LS161AN U7
4 5431-8630-00 1 IC, 8-IN POS NAND TI SN74LS30N U49
5 5431-8632 -00 1 IC, 4/2-IN POS OR TI SN74LS32N U37
6 5431-8674-00 1 IC, 2/D-FLIP-FLOP TI SN74LS74AN U8
7 5431-8686 .. 00 1 IC, 4/X-OR GATES TI SN74LS86N Ull
8
5431-8707-00 1 IC, 2/JK FLIP-FLOP TI SN74LSI07N U239 5431-8738-00 2 IC, 3-8 LINE DECODER TI SN74LS138N U21,22
10 5431-8751-00 1 IC, 1 of 8 DATA SEL/MUX TI SN74LS151N U10
11 5431-8761-00 2 IC, BINARY 4-BIT COUNT TI SN74LS161N U33,20
12· 5431-8775-00- . 1 IC, 4/D-FLIP-FLOP TI SN74LS175N U44
13 5431-8844-00 4 IC, 8/BUF-DRIVE-REC TI SN74LS244N U43,46,47,48
14 5431-8968-00 1 IC, 6/3-STATE INVERTER TI SN74LS368N U9
15 5431-8974-00 B IC, BID-FLIP-FLOP TI SN74LS374N U3B-42,4-6
16 5431-B993-00 3 IC ,2/4-BIT BINARY COUNT TI SN74LS393N U34-36
17 5627-1017-00 16 IC, RAM BIPOLAR 256x4 FC 93L422 U12-19,25-32
1B 7540-1B16-00 1 SOCKET, IC 16-PIN TI C-9316-02 TCI
19 5434-0206-00 1 OSC, 20 MHZ, 14-PIN DIP MOT KllOOA-20.MHZ U2
20 6099-2105-00 7 RES, 1K, 1/4W, 5% A-B RCOG7GFl02J RI-7
21 6740-2663-00 1 RES,PAK,9/4.7K,10-PINSIP CTS 750-101-R4.7K RPI
22 4431-4103-00 57 CAP, IC 01mf, 50V AVX MD015E103ZAA CB-64
1
2
4230-4751 .. 00 0034-6938-00
PARTS LIST
CABLE ASSEMBLY INTERNAL LA-P3 TO EP.P3
2 CONN CARD EDGE, 26 CONTACT 1 CABLE, RIB 26 CONDUCTOR, 28 AWG
2-4 Service And Maintenance
EP -P3 , LA-P3
2.4 IC INFORMATION
The integrated circuits used in the SLA logic are mostly all low-power
Schottky TTL's. Notice that the total number of pins per DIP are either 14, 16, 20, or 22.
X )_ J'! _N_ U M B E R
TYPE LOGIC DESCRIPTION GND vcc
74LSOO' 4/2-IN POS NAND 7 14
74LS161 BINARY 4-BIT COUNT 8 16
74LS30 8-IN POS NAND 7 14
74LS32 4/2-IN POS OR 7 14
74LS74 2/0 - FF 7 14
74LS86 4/X - OR 7 14
74LSI07 2/JK FF - 8 16
74LS138 3-8 LINE DECODER 8 16
74LS151 1 OF 8 DATA SEL/MUX 8 16
74LS161 4-BIT BINARY CO~NTER 8 16
74LS175 4/0 .~ FF 8 16
74LS244 8/BUF-DR REC 10 20
74LS368 6/3-STATE INV 8 16
74LS374 8/D - FF 10 20
74LS393 2/4-BIT BINARY COUNTER 7 14
93L422 256x4 BIPOLAR RAM 8 22
74S289 64-BIT RAM 8 16
74S08 2-IN POS AND 7 14
74S02 2-IN POS NOR 7 14
74S03 2-IN POS NAND O/C 7 14
7404 HEX INV 7 14
74221 Me-NOSTABLE MV 8 16
74LS04 HEX INV 7 14
74LS08 2-IN NAND 7 14
74LS10 3-IN NAND 7 14
74LS30. 8-1N NAND 7 14
74LS157 2 TO 1 SEL/MUX 8 16
74LS373 OCTD LATCH 10 20
2.5 MNEMONIC DESCRIPTIONS
The following signal names were taken from the SLA schematic diagrams included in this manual. Most of the signals are those which traverse the bus. In other words, these signals go off the card. A signal which stays on the card is shown by an asteri'sk after its name. See notes.
NOTES:
MNt.MUNIC LUGIC ANALYZ.ER
LAS .. · Logic Analyzer Strobe BAO-BA24 Bus Address, 0-24 BDO-B014 Bus Data, .0-14
BHE+ Byte, High Enable
EPCYC- Emulation Processor Cycle PRTY- Priority Error Input
MEM- Memory Cycle
IPWAIT- Interface Processor Wa1 t
RFSH- Refresh Cycl e
BYTE+ Byte - 8-Bit Operation
R/W- Read Write Cycle
HLOA";' Hold Acknowledge
MROY+ Memory Ready
~SAO+)-(SA2+) System Address, 0-2 BPl+)-{BP3+) Breakpoint, 1-3 BP10UT .. · Breakpoint 1, Out
EPI- Emu 1 ation Process.or Interrupt MAP- Memory Mapper .. Internal/External
TIME- Test Memory Enable
SYS+ System Address Enable BP20UT .. Breakpoint 2, Output BPlIN-BP2IN Breakpoint 1-2, Input 100-1031 Input/Output, 0-31 (SAl+)-(SA3+) System Address, 1-3
BP2+ Breakpoint 2
BP4+ Breakpoint 4
LAI- Logic Analyzer Interrupt
WPROUT - Write-Protect
BP30UT - . Breakpoint 3, OUT RSTPB- Reset Push Button BP3IN- Breakpoint 3, IN
BP40UT- Breakpoint, OUT
(1)
g~
+ means Active High Bus Signals - means Active Low Bus Signals*
means Active Low Non-Bus Signals2.5 Continued
MNI::MUNIG LUGIG ANAL HER
BP4IN- Breakpoi nt, IN
XO-X15 Processor-dependent Logic Analyzer inputs
ECO;;;;EC3 "External Condition" 0-3
TQ Trace Qualifier for Logic Analyzer
BP2- Breakpoi nt 2
BP3- Breakpoint 3
00-07 Slave Emulator Bus Data, 0-7
CLRCNT* Clear address counter overflow bit.
CYCCNT "Cycle Count"
Enable counting of Breakpoint 3 cycling.
DATA STR Inverse of Logic Analyzer Strobe (LAS)
SELL*, Select read-data buffer for Logic Analyzer RAMS.
SELR* Enable Sell*
NOTES:. (1) (2)
(3)
- means Active Low Bus Signals .
+ means Active High Bus Signals
2.6 LOGIC SCHEMATlCS
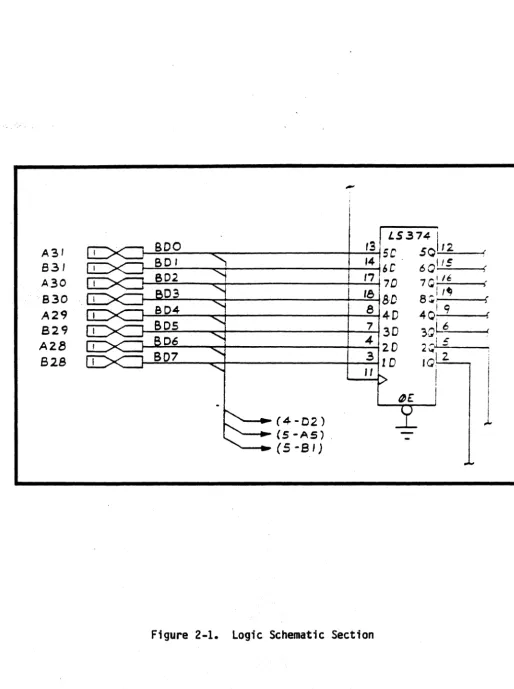
The Logic Analyzer schematic, 2302-4746-01-S0, consists of five sheets. Sheets 1 and 2 depict reference information, such as pin number and signal name, for Edge Connectors Pl, P2, P3, and P5. This information can be traced to logic inputs and- outputs on the remaining sheets. Each IC DIP is labeled with pin numbers, symbol, and I/O signals.
Ffgure2-1shows~ a~sectton 'of' Toglc extracted from Sheet 3. The bow-tie connector symbol represents bi-directional bus Signal flow. The number 1, within the left side of the bow-tie means Pl. To the left of this number are the numbers A31, B31,A30', B30, A29, B29, A28, and B28. "A" stands for the upper or component side of the PWB, while IIBII stands for the other side. The two-digit numbers are the pin numbers. Therefore, A31 means Pl pin 31.
BOO through B07 are mnemonics for 8-bit bus data on lines 0 through 7. The symbols in parentheses are schematic page"numbers and zone location on that page. For example.. (4-02) mean s page 4, zone 02.
A31 831 A30 830
A29
829 A2B
628
-I
LS374I
!--=B~D:....;O::.-_~ _ _ _ _ _ _ _ -+--..;.;'3~ 5 C 50,--1=-2 _ - J {
~~~
__
~+---__
~--'~4 6C· 60_It~S __ ~(~~~--~+---~~'~77D 7Q~:/~!--~t
r----~:.---~+---__+--:.1~8 BD 8:;: ,.., )
t--=:;..::;.. _____ ~+---__+--~8 4-D 401- , 9 ____ ~(
1---=~:'_ __ -c-+-____________ --+_~7 3 D 3:;,L6.~ _ _
4 ' .:
....-~:.---~+---+--..;....j '2. D 2 ~,,,-,:
-~--.~~~ __ ~+-______ --__ --~ __ ~3 1D IQ~~2_~
- .... (4-02)
-~(S-AS).
- -.... (5-81)
, I
I
i
I
I
[image:21.621.56.571.73.763.2]o c B A 8
~
~. 7 SPI\RES =";( l~I07
9 ~S
U2.'3 -"
K o
H
""-tSV UI .0H
+':>V V41) o6 5
PI <f-SV ~~~---.---.---~--5Z A3 53 A'li 1541
M7. .
W
I ClS-f"1
.01.-Z 50V
t. C.I~C" AND CII-03 CAP PAIRS TO BE. \IIOVUTED Ot-li\lt NON-CONUll.'OK ~IOE.~
8
Of .,\1£ !!OAR!>, EQUALLV ':.I'JlCEOWITH '3 PAIRS ,0 to. 51!)!;. c."1 ANI> CI4 fAIR TO &.
~T£D NEAR 1/0 PINS PIA-13 • 1'16-'f5 '." 1I.£'5T . OF C/II'i.,' Pfl'\ I.e. LOCATION,
1 6 5
2-10 Service And Maintenance 2302-5012-00
4 3 2
,-~---'---~ _ _ _ _ _ _ _ _ _ ..l.-___ .. _ _
PI PZ P3 pi)
AI AI 151 81 I'll 151 I5Z BZ " 30M S3
~30tS84 AI2 ~7 8S
Brl. 83 Blo
Afll ~ In &11 511 sa
A'll 611 An B21 131 8\1 A~ 9 A43 &6 Em
&12 ~
6
BII
SI
61
4
COf'!PONENT vcr. GNO ua.U3.J8,UII.Ul3,UZ4,
U3'1-31, lI"1g 14 '1
U7, U9, (;'0, tnOc2.l.,
U~3,U"4 I'" 8
U4-". L36-43,U4'--48
01 (S"","E) W 10
U45(Sf4<RE)
Ull-19.U2S-32. 22- S
3
o
B
o
C
B
A
I b 4
8
, _______ . _ _ _ L -_ _ - ' -_ _ _ --J.-. _ _ _ _ _ _ _ L - -_ _ _ _ -'-_~ _ _ _ _ _ _ ___L_ _ _ _ _ _ _ _ ___J _ _ _ _ _ _ _ ~ _ _ _ _ _ _ _ ,
I
.ElB.
B1J.S. ..c.ARD
,...
GoND I '-- erND GND
+ '5. V z. ... y -t-5'J Z. !lAO'"
+sv 3 ,,",,, .... v 5 I5At..,. ... It-V "\ ---i +ltV
"
aPI ...LAS- 5 LA'3- •• UI 5 ap3 ...
GNO Go ---< Gill 0
"
BPI!/lUT-BAZ4 1 Jl.n • .-s,,-,
£PX-BAU_ B BA~"Z.. eA2.:& e I'IA po.BAW ~ BA2.0 IIA'2.1
,
TI'IE-BAI8 10 BAI8 BAI, 10 IIY!!'"
aAIl. 1/ RAI eAI1
"
BPZ¢!UT-&ND Il. ~ GoNO 1'2. 8PIIN-8AI4 13 SAI4 eAl!! III 8PZll11-BAit 14 BAIl. 8AI5 14 x"o&AID IS RA'" IIAII l!t :r,z.
BAa Ie. !>.AQ. !lA' I. I ' ' ' '
&NO 11 ~ O>ND 11 1(/1#
BA'" 18 PAu. ISA"7 II x,a
BA,,\
L'
I'!A4 lIAS I'!I X,l! BAl. lD RA7 BAJ U) tp Ii!.SAO l.I BAO 8AI tl 1'14
Go NO ZZ ~ GoND U.
X,,,.
BOl4 n BOI4
II"" u xf"
BOIl. Z4 ROI? BOlA 14 Xfto
aOlo z.s R"I" _ I I n x;u
60e U. RnR aDS Ito X4\t-III
ClNO t'l l - ctNO t'l 1,t"
BOlo re Rr.1 aD" u x'i!.8 ao. Z'!I BD4 U'li U XfJD
.0'2. 30 Rn? lID I ~o GoNO
aDo 31 I'! DO aOI 31
&ND 3t t - IOND n
8H£ ... !>~ BHE IIYTC+ !>l £PC)'G- 3" EPCYC.- IVW"; ;,4
PRTY- 35 I -rt MLDA- ~
GND 3" t - MMW-t 's.
"'£1'1- 3'1 M"''''- OND S'I
wND !& ~ MID U XPWAlT - .3~ I --T twl'U!UI"
-IZv
+.v
<WI I -~
41 :'&V
-1&11' 40
+IV
41~~~~--HIV ... l +!l.v ... IV 4a.1-+-!..if!'--_
&NO 43 ~ ..,0 4~
'--I Z. .3
'"
5 G 'I e,
10 II IZ. I!> 14 15 II. I ' 16,.,
ZIO 2.1 n n £.4 a tt. ~'1 u Z!I 30 liNDA ~AI'"
A SA!'"
en ...
BP3
1IP4+
(lift U$l
LAl-
wPRjr-
liIP3¢UT-YS
R'3TPB- BP3I.N- BP491UT- I5P4I.N-X'J X,3 xU XI, Xf., 11/11 1'1~ 1'1'.5 :If'''!
~'" X, 2.1
X,13 It)K 1 h '
l:fn %f31
& .. 0
-=-THIS SHEET REFERENCE ONLY
I
£. AI
1. '" 5
"
,
8,
10 II Ii!. 11 1111 II!> /I. I' Ie " 20 U n u till 2.5 2." 2.1 u 2., IO -=-..£SA..r--I XO ECO
2. X I 3 l<.t
... X
'I-'5 -"5
t:. XIo
XR "1 ~ 3 4-'5
"
7l- ei z
,
en3
..
..
SYNC-(N¢T U~ED) '.5 5
PGO-nJ\JT U~EJ)l t.
'"
-t5V (NOT Uo:.EDl '1 '1
B X '"I
AIO
9
10 XII
"
XI"Ii!. XI"
Il!. XI'S
B 9 10 II IZ 13
!lP 1- INIIT U~EOl e .a
BPZ.- [N0T USED) ~ 9
BP3- (NBT IF.>fOl 10 10
Ii II
IZ IZ
I~ Ii!
L
--=- -=
D
C
8 7 6
I
4 3 2r~DIA~~A~S~TU~~ ____________________________________________________________________________ ~-"(+~l
o
c
B
A
AZI
. til-I
AlJ)
BZO
AI9 BI':I AI8
!!.I 8
rr--0 CA'5- ~(.. __ _
AS __ Ul~-~~-i~'-U3
1\31 B31
A'.!t! lI~O
AZ9 lI29
AZ1I
aza
8
~11-D21
"---11j-A51 (~r111l
2-12 Service And Maintenance
-=-mE
-=-liE.
7
r -____________ +-_____________________ . ________________________________________________ ~oo~-~cn~ __ ~---'5-~1
/
(<;-C2.o;_D21 _ _ ~~A\>Q.::,O-:.eAI.:'L---+_---+---..,.
6
2302-5012-00
TG..-I.-I5-D11
-=-4
L.-_ _ _ _ +---14DZ
I~ [B
15 D'\ C ~ ~ ~ ~. ~ ~
3
D4
05
D, /
2
o
c
B
8 7 6 3
o o
'LSij;/
~A 114 ~ ~
~ B Qll~ e. U3 IM~
~ U1(ll~ Ill.E ~
l-Lo D Qj) [iL- IA
lru::-~~
-=-r;;
EP RCJ ~ 1M p.n/\U3( LJ.l. jzAl W ~
IT " 15jllll m 5 SOL
? lrrc ptA ,/\ I '/,
IIl'1 IYq 12
"D4r"
2OCI~ .; Irll ,'12 I" BDID~
'Wf)S C 1~1i.J18171 10 Bn,15-A2J~
,Ir-r
ID IA~ 1'13 14 50':>I Z. 12 Ill1ll
ll'\"
BD'lrI" n T'"
I;-AIJ~ (5-(31 r;zm- l1l -, BOI
~D-BD'l .. (~~A")
!(, lG
("3-A 5 J -E!!.!- Cl't.~~
(~-C'I)
c
8
~
+'SV +5V l lilA 3
+5V
L
),4
>'''( I TE5T CQDJ DJ.I RI <
I
I +":>11 -PJ:L LS31DSIQJl
t±-R'!. r-~ C>IA 1M 5
Tel 11'\..< R'5
~f:
2. D LS'l4 " <; 4 ,5 Lill42.
' - - ' u Z-
II'\..
U8 G U3 U351/).0~t-
f-- iill 01'3 BOD2. ~ ~ I
rL{
lAl2. 1,<
1QA1I
lH S BDl
- ~ !>/A ~!D W
CLR
-1Y4 1'- "'I">'"
..., 14 yl CLFU:NTlL (.Q[.'9 1111
~ IA2 1'12
4 1,3 TEST (S-A4)
~"
1(" BO"~f-o o-~ PS BP3- l 101 U471l1 I~ BO'
+'.'>11
I 1\.11 r. 10J 11, 4 BOS
~f-o o-r'4
I
LAID
17 ZM mOl BD3~f-o o-~
R"I >.""- lD/l M~'t
OCCNT IS'A3\ 13 "L 2V 7 BO'
~f-o o-~
I D LS!i4
Q...Lf.--(5-A3\
In,~D
.. "
-Z. FI~ 16 ZG
rllOn~
RlL'DO" II
"
U8 _ ~J
p, ~10 LSDO 12. U3 j' Q. 15' Cot)
8 01' 3
+5V U3 ' - - - ClR \
II ..
«13 III w .k..; IQII~
o~UIO I fA IQC
~L~
Uz. 04L~151
I
~twMHI OSC B 14 Y 5 U34 IAJ) f-< .Jl. lAl ~11':l BOO
II
K.IIMA LS3t.B
~ ~ 2aA
I
~: ~:!II~
801.nHAc,TR 7 U 9 ~3 ~ );:,. !ID IHI4
J
C3-011 Il 1 ZQC'3"I 101. 1'12
II.
BDr.I
YBPL-
B- - P5 2. AIi.J1b'YI IS Rn.
-M
" 1A3 IY] 14 PlDe; /Af2. Z. \2
I 2",1" S03
+5V T5V 13 I Zy It "n /
c
8
1& lG
KPI I Rl.
I
rJ\.M'3
4.1K II:: (!)-t1\
2-
2-~~
<;j'[;Y-
UII ~~~~
L " I D UII '.
1-.. UII
8 7 4 3 2
P5
o
~
TG.-1
4 U;OO .. /3-1.4)try
(" 2·U'-4
g::~'Jt
"
5 Uc."\ '-~U~ I ~ U24
-
AO-A' C3-0'11o
rt5mr
'LSij;,-, - L ~ 'It
~
~ A 14 AO.. S I! AI
~ UZ2.! 5 C; h" It. A7
RJW- "3 I~
14 12. CLRCNT ... 14-Ct.) t. 0 U33 " ... ,.
Ie; II - '1 EP I'lJ
flL-.10 I'f\:#< 10
14-AZI
" I': I'll' C4-Btl z:
9
'1 C2..ilt (4-C?1 LV
.
~
tlR. IBA.S
--c
B
~ ...----2 rum;r A I ... I",~
n-DBI BA4 I " 'III '" ", .. n ... 13-(,51 ~~, II"
'" 13-D81 BAa; Z Ult YI IJI A-SI;II[ C~-BC.I ~ OZLlQ(.il. I.".
RAt. '3 13 ;QS2iL
',"0r.1 (~-"C.) ~O
" fA"
4 It. lL'.l"3lt. (3-At.l
~,-1 I""
I
-2c ~,
II l1o.~oL C3-tt) ~ EPIII B.'.la;lIL ET
RAn n '.I G...'1>CA. 15-&1 7!
13-08)
I ... ' .~
~ I3-AZI ~
A-Oil) A31~
11EM.-~/Dsn '1 c::.~'l~
LD J'I 13-"2)
A'34 I'i""! EPc.Yl:- '" " 4 U37
T
e-..,CIA. ...... LS30 \ . . A I
AID ~ SYS+ r '3 U"I9 I )~S'>2. PU3
"
...
-...
I
I
2. BAB I3U37
I 14-0J
A'l.. CD <:An. -::it I 15-(/11 -t5V RP(
Sz, ~ ... !':A'+ (3-0n 00-0, 4./K.. ~ lSIO'A
'\ I 1..1 18. ~
A'!o fT') 51'1""
~Di '3 7 4 8 10 " 9 5~ III! Bm I~ U2.~
.,...
2 till l"~
lS'%8 .OS l./B If 4 SO" ' \ ~ III r ,7' 12 5 BOO.
83 ... 5A'3+ U9 03 1 '3 "n"l ' \ r.IKJ ~
-=-1:5-A'11
c
B
I .01 13 }J,\{ . [., flO. '\ l'!o
-=- .DO
"
lq AM ' \~
02. 1<; /5 B02. ' \
ClRC t..Jnt. U9 13 ~
D4 2 112 804 ' \
0(" 4 '" 80" ' \
- I'!>
A2 ~
-~ '\
lS3I.&
~
R1\/- ",,,
-
t. 9 ",'1 10'LSrz: I 1'1.
I9 U37 . ~ r
-
~'1~~
-!ll"lR ;It S04 410 lZi
~III"MR C4-et.1
BOS s ./a
~,..rr,,"
1M 14-851
BOr. 11. !/: f.!4 V
:
~.RoD'1 13
A
A . BDO-BIl7 jSYS RESET-I I C
1
f'!-A'J ,S-I'II
(4-Cl) TEST 2. '11 I ~
11'1
8 7 6 4 3
2.7 ASSEMBLY DIAGRAMS
o
c
B
A
8 7
Z. LeAD PIi!OTFWSION ON SOLDER SIDE. TO ~E. .0," MA~.
m
MARK I'--:'':.E.MP.>L'I' NO. LATE.ST RE.\! LEvE.L. AND . SERIAL NO.NOTE: UNLESS OTHERWISE SPECIFIED
7
2-16 Service And Maintenance
6
('OMPONE.NT SIDE.
6
5
5
2302-5012-00
I
I
I4
4
3
UNLESS OTHERWISE SPECI.f~EO DIMENSIONS ARE .. , INCHES
.. APPLV AfTER PLATING.
BREAK ALL SHARP. EDGES.
DECIMAL ANGULAR
2PLACES •. 3PLACES •.
3
2
I.Al AEV ECO DESCRIPTION
"'2 110M PILOT RELEASE"
~3 tt.:" ''''C.O~P ECO
o
c
B
DO NOT SCA-L.E DRAVt'ING SHT. 1 OF 2.
4
3
1REVISIONS
LAL
PROD RELEA'5E.
o
D2.PLACE..S
c
~
r~
C
»
I
"0
(J>l
o D
PINI~
INDIC.I\"TORPIN I PIN I
±.I2.
3.2r:.
lJ
---D
--- I.~
r<>
N
0
B I
N
0
r<>
; . N
SEE. SE..PARATE. PARTS LIST '2.~Oz.- OZ.~4 -01-PL
UNLESS OTHERWISE SPECIFIED
CULVER CITY CA
~ RUe,BER. ~TAMP A~S,( NO., DASH NO., AND CURRE.NT DIMENSIONS ARE IN INCHES . ! Re.V Lf.TTER. U'51 NG SLAC.K PERMANENT I NK I WITH :::~~~~;~~~~~~~~s.
APPROVAL
.12 HIGtH CHAR.ACTE.RS, LOCATE.D APPROX. WHERE.. '5HOWt-t DECIMAL ANGULAR NAME
2 PLACES 1. - :t - DESIGNER
m
MARK RE.F DE"5>IGNATOR. USING BLACK PER-MANE-NT INK, 3PLACES 1 . - CABLE ASSY, INTERNALWITH .leHIGH C.HARACTE..R5 LOCATED APPROX. WHERE SHOWNl-=~----==-I;:;;':;;~;;---+-~--t;;t:--',-,----t-'fs/,-1~1 L A-P3' TO E·P-P3 A
SIGNATURE DATE TITLE
CHAPTERS-INSTALLATION
3.1 PREPARATION
Chapter 3,
INSTALLATION
Before installing the SLA subsystem, check with your GenRad/DSD service facility to ve~ify that your Slave Emulator is configured with the latest version of:
a... Software.
b. Breakpoint Card
c. Interface Processor Card with correct ROM d. External Probe
2302-5012-00
NOTE
All Slave Emulators shipped from GenRad/DSD after April 30, 1981 are correctly configured to operate with the SLA subsystem.
3.2
INSTAlLING THE SLA SUBSYSTEM
a. On the Emulator, set the ON/OFF power switch to OFF and remove the a.c. power cord from the rear panel socket.
b. Remove the rear panel.
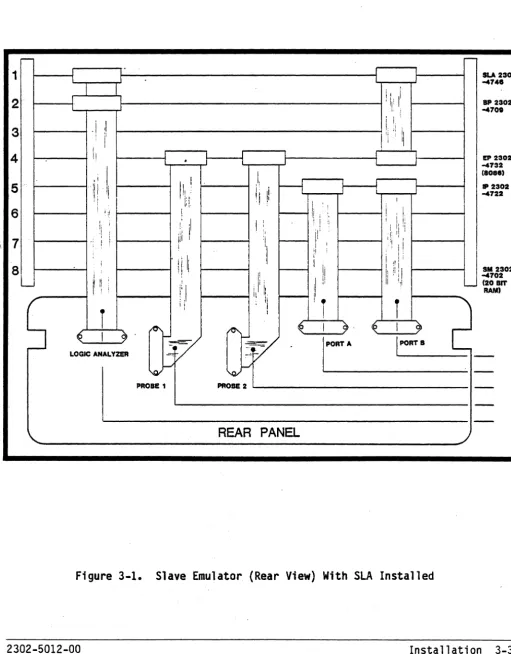
c. Refer to Figure 3-1. Insert the LogiC Analyzer card in Position 1 tn., ,the, card ,cage.', ,
d. Connect one end of the short flat cable, 2302-0234-01, to the LogiC Analy,zercard" (P3;); and the other end of the cable to Personality Card P3.
e. On Cable'2302-0225-01, connect the LA-P5 plug tG the Logic Analyzer card.
f. Before replacing the rear panel, make sure that all cable's are properly aligned and pushed all the way onto the: card edge connectors. Replace the rear panel.
g. Replace the a.c. power co,rd.
Operation.-r--
-1 SLA 2302 -47".
,
i i. II
2 I 'Ii' ; IP 2302
-470.
: I ,
3 ,I :! , I, Ij't !I
i II
I
4
II
.
EP 2302 -4732I,
I (808.)
, I.
f---1
5 .:, I II Ii ji \1 -4722 IP 2302
I ';.1
,I
,
I
jl!, "I ,I I I 16 Iii
I 1: 1, i ! i
i ii
,I I
I :
,,
!: ' I i
!! 'I
, ,Ii I I, l' ,I' ;I
7 i iii i r - - r! ~ : i I !
\ i , ,'I I!
'I
. IIII
iI tI i i
, I
aU
:1" '! I I I :, I SM 2302I: ' ,I tl Ii ,: i -4702
, I I
(20 lIT
i
I; I !iI
, I' I, "-" RAM)
Ii 11, 11
S
' 'i II !
,
i
2
r
It ' I
!
10\ ~I- ~ \ ~ I ~
<€ I
9'
V
[~A
i
PORT IV
LOGIC ANALYZER -=; ~:-=
-I
\QI-/ 'O;'f-I
-PROlE 1 PROBE 2
-REAR PANEL
Figure 3-1. Slave Emulator (Rear View) With SLA Installed
[image:32.621.63.575.130.785.2]CHAPTER 4
OPERATION
4 .1 I NTRODUCTI ON
The Slave Logic Analyzer (SLA) option allows the user to view the emulated processor's operation by displaying as many as 64 processor functions in three different formats. The user may record a trace of the target processor's activity, in real time.
\
Parameters which the user can control include the following:
Trace qualifier
Trigger event identity
Trace contents, relative to trigger event
To identify a specific subset of bus cycles to trace. Breakpoint 3 serves as the trace qua 11 fier'.
Breakpoints 0, 1, and 2 may serve as a Logic Analyzer trigger.
A post-trigger delay count identifies how many qualified bus cycles to trace after the triggering event occurs.
The Logic Analyzer's trace buffer is large enough to trace 256 bus cycles. These actually represent target processor execution cycles, but the term "bus cycles" is used to suit common usage, whether or not the target processor is connected to a bus in the target system.
Event timing' is, another Logic Analyzer function. The Analyzer has a mode in which it times the interval between Breakpoints 1 and 2, allowing accurate measurement of the elapsed time between two events. Such an interval can be measured in microseconds, hundreds of nanoseconds, or bus cycles.
Software enhancements in the following functions provide support for the SLA:
Window mode command Mode command
4.1.1 COMMAND DEFINITIONS
A definition of each of these commands is given here; a more detailed discussion follows in the section entitled COMMANDS.
WINDOW MODE COMMAND
The Wtndow.Mode command accepts three new modes. Each new mode selects one of
the Logic Analyzer display formats listed below for the current window. It
also allows the user to edit the set of signals to be shown by the waveform display.
Logic Analyzer trace data may be displayed in the following formats:
Cycle data
Waveform
Execution trace
MODE COMMAND
Each bus cycle is formatted on a single line, with most information shown in hexadecimal.
Individual signals in the trace are drawn as lines in the display, as in a waveform
diagram.
This processor-dependent display shows disassembled instructions combined with the data they manipulate on the target bus.
The Mode command provides options for both breakpoint and Logic Analyzer functions.· These controls are unified in a single command because the Logic Analyzer is actually an extension of breakpoint support.
BREAKPOINT COMMAND
The Breakpoint command itself is essentially unchanged, but the meaning of breakpoints is expanded when the Logic Analyzer is enabled.
QUALIFY TRACE COMMAND
The Qualify Trace command sets parameters to select bus cycles to be traced when the Analyzer is enabled. These parameters are identical to those used with breakpoints, but the meaning of a match condition is lit race this cycle"
rather than "break executionll • This command also sets the post-trigger delay,
whi ch indicates how many bus cycl es to trace a fter the tri ggeri ng event occurs •..
4.2 GENERAL OPERATION
Using the Logic Analyzer requires defining a new emulation environment for the Slave Emulator and reconfiguring the ADS display. Since only wide windows are used for SLA displays, the user must invoke the Screen Map command and set the current window to a wide window display. The current window is indicated by a
long reverse video line. <TAB> is used to redefine the current display window. Please refer to SCREEN MAP HELP DISPLAY.
The user must then invoke the Window Mode command to change the carrent window to one of the three Logic Analyzer modes; Cycle data, Waveform, or Execution Trace di'splay. Please refer to the WINDOW MODE COMMAND HELP DISPLAY.
Initially, when the Logic Analyzer window option has been selected, the window displays the message **no trace data available**. Three additional steps are required to use the Analyzer.
First, enable the Logic Analyzer using the Mode command. The Mode command is used to define both breakpoint and Logic Analyzer options. When this command is entered, a help display showing the submodes and current status of the submodes appears on the screen. Please refer to the MODE COMMAND HELP
DISPLAY~, '
'Next, fnvoke the Qualify Trace conunand to qualify the trace parameters to be
used by the SLA. When this command is entered, the sc~een shows a help
display with the current trace qualifier and the trace qualifier options. The trace qualifier uses Breakpoint 3 to define which bus cycles will be recorded by the Logic Analyzer. The user may record all bus cycles or just those concerning a particular address, data, or other option.
In addition, the relative position of the trigger within the trace can be
defined by the post-trigger delay. The delay count can be set between 1 and
255. If the count is 1, tracing will halt one qualified trace after the
breakpoint is reached and the 254 events prior to the break, along with the cycle corresponding to the break, will be displayed if available. If the trace qualifier suppresses tracing of this cycle, the last qualified cycle before, the breaK,wi.11 be di sp1 ayed.
If the count is 255, tracing will halt 255 qualified traces after the break
and at most, 255, events after the break wi 11 be di sp1 ayed. If the break
occurs before this many cycles are traced after the last Execute command, the number of cycles displayed will be less. Please refer to the QUALIFY TRACE COMMAND HELP DISPLAY.
Next, define Breakpoint 0, 1, or 2 as a trigger (or triggers) for the Logic
4.3 DETAILS OF LOGIC ANALYZER OPERATION
When the logic Analyzer is enabled via the Mode cOl1lll1and. the Analyzer begins tracing target bus cycles at one of two times:
If the target processor is halted. tracing begins when a user's Execute command releases it to run.
lfthe:targt!.t..processor..is running. tracing begins as soon as the Slave Emulator recognizes the mode change. The Slave Emulator halts the target processor while it changes Breakpoint/logic Analyzer modes. then releases it to; execute:.
Once started. the logic Analyzer examines each target cycle for a match with the trace qualifier. The trace buffer is circular. always keeping the 256 newest entries.
Tracing continues until a breakpoint occurs. The breakpoint serves only as a trigger- signal wherrthe Logic Analyzer.i s enabled; execution continues until the number of additional qualified cycles traced matches the user's
post-trigger delay parameter. At that point. the Logic Analyzer freezes its trace. buffer and the break occurs.
The S1 ave Eniulator CORi es .out the Logi cAna·lyzer I s trace buffer and noti fi es
. the ADS as soon as possi b1e after the execution break. The ADS di spl ays the appropriate Stopped at breakpoint or Running. snapshot at breakpoint
message and updates any LogiC Analyzer data in the display from the new trace contents.
The Logic Analyzer always traces at least one bus cyc.le after the trigger. The post-trigge'r del ay must be in the range of 1 to 255. LogiC Analyzer displays assign consecutive entry numbers to the traced b.us cycles. Each entry number is a signed two-digit hexadecimal value which represents the cycle's age relative to the triggering cycle. Entry +00 is always the
triggering cycle. If the trace qualifier prohibits tracing of the triggering bus cycle. entry +00 corresponds to the last qualified cycle which precedes the triggering event.
The trace qualifier is implemented by the same hardware which implements
Breakpoint 3 •. Thus. whi.1e the Analyzer is enabled. only three breakpoints are available. During this time. the user is free to set parameters for
breakpoint 3. but they will be ignored until the user disables the Analyzer vi a the Mode command •.
Whenever the user issues a command which affects the enabled/disabled state of the Logic Analyzer or sets Breakpoint 3 with the Logic Analyzer enabled, the Slave Emulator Debugger displays one of the following two messages:
4-4
Operation****Analyzer enabled. break 3 disabled**** ****Ana1yzer disabled. break 3
Normally, the execution break stops the target processor, but the user has two controls to alter this:
If the breakpoint is a snapshot, the Slave Emulator normally halts the target system while it retrieves the contents of its hardware trace buffer. USing the Mode command, the user may set the "run/pause after trace ll mode to Ilrunll, rather than the default Clpausell ). The target
processor continues running at the expense of missing target bus cycles unt:il the'tra'ce"buffer "has been copied.
If the breakpoint is a snapshot, the Slave Emulator also checks the IIscope ll mode. Scope settings are:
o
Keeps a snapshot breakpoint from interfering with targetexecution at all.
1 Interrupts target execution long enough to get a snapshot
of register contents.
2 Interrupts target execution for a longer period to snap
both registers and memory.
If Ilrun[pauseafter· tracell.is set to "run" and. "scopelli s set to "0", snapshot
breakpoints never interrupt target system execution. Inst~ad they trigger
updates of the Logic Analyzer trace.
Event Timing
When all breakpoi nt and Logi c Analyzer modes are set for event t imi ng,
Breakpoint 1 starts a 24-bit counter in the Logic Analyzer. The maximum value of the counter is 16,777,216 (decimal); if the count exceeds that value, the counter starts at zero again.
This counter increments at one of three rates:
once per, ,mi-crosecond once per 100 nanoseconds once per target bus cycle
The user may select the desired rate via the Mode command.
When Breakpoint 2 occurs, the counter stops. The Slave Emulator Debugger translates the value of this counter into decimal and displays a message. For example:
For other timer modes, the unit identification changes accordingly. Note that times clocked in hundreds of nanoseconds are reported in nanoseconds in order to simplify the text which identifies the timer units. Thus, the nanosecond equivalent of the 75 microsecond interval in the example above might appear as:
****Elapsed time 75200 nanosec****
The time interval reported in this instance is accurate to three significant digtts,ratherthan,'to'five'.:, '
The event timing function also uses Breakpoint 2 as a normal trigger for Logic Analyzer tracing.'
For further information regarding the use of the Slave Emulator in general, please refer to the GenRad/DSD Slave Emulator Reference Manual,
(2302-5000-00) •
4.4 COMMANDS
SCREEN MAP COMMAND
HELP DISPLAY
Screen map n maps up to four display windows pnto the screen, with windows assigl)edto, quadrants, of the display as shown below.
Windows are 1 abeTl ed A '- D.
A A
A A B B
B C
n
=
0 n=
1 n=
2 n=
3B A A B A B
A
C C B C D
c
n
=
4 n=
5 n=
6 n=
7Any of the etght screen maps may be selected for ·viewing target memory. n specifies the desired map, as shown in the help display. The default screen
map,is n
=
2. Each window may display symbolic (disassembled) orhexadecimal/ASC'II memory data, or Logic Analyzer trace data in any of three formats. Logic Analyzer trace data can only appear in a window which spans the full width of the screen.
If the current window is the incorrect size to support Logic Analyzer data, an error message stating XXX Requires wide window will be displayed and the
4.4.1 WINDOW MODE COMMAND
HELP DISPLAY
Window Mode command operands:
Symbolic Hex
Cycle data Waveform Execution
Absolute Offset
Display memory data as disassembled symbolic instructions. Display memory data as hexadecimal bytes and ASCII characters.
Display raw (minimally formatted) Logic Analyzer trace data. Display signals as waveforms from Logic Analyzer trace data. Dtsplay execution trace from Logic Analyzer trace data.
Use absolute addresses, referencing entire target address space. Use 16-bit offset addresses, referencing a 64K segment beginning at the window's offset base address.
**Absolute/offset mode applies to memory displays, not to Analyzer traces.
Window modes fall into three groups:
Memory displ ay modes
Logic Analyzer display modes Memory display modifiers
Symbolic, hex
Cycle data, waveform, execution Absolute, offset
All modes in the first two groups are mutually exclusive. Selecting anyone of them automatically resets the old mode. The memory display modifiers can be set independently, but they are only meaningful in connection with symbolic or hex memory display modes.
The command terminates after the user confirms his choice of any mode except "waveform". When the user confirms the waveform mode setting, the mode command establishes a default signal mapping for the current window and a dialog function which allows the user to edit this mapping.
Waveform Display
This display presents the state of the individual target processor signals as a function of time. This defines a waveform for each signal, but the waveform is limited in two ways:
Each signal is represented as being purely binary: it is either high or low. This corresponds to the way in which typical digital logic perceives th't!"s,i,'gnal,!t;,:but'jt:doesnot offer clues to noisy or floating signals.
The waveform is generated by sampling data at the pins of the target process'or' chip once' per cycle and drawing lines 'to connect these points. This technique does not detect fine details of signal transitions which occur within a cycle.
The signal map contains positions for up to 64 signals from the target processor (numbered 0-63). The default map assigns the set of lines being traced to consecutive positions in the map.
The initial display for the map-editing dialog appears as follows for a 6809 Emulator:
Enter- trace' position" RETURN"TAB, or "?":
Signal mapping (trace position, signal name pairs):
0 AO 8 A8 16 DO 24 RD/WR- 32 MRDY 40 48 56
1 A1 9 A9 17 01 25 FIRQ- 33 OPFTCH-41 49 57
2 A2 10 A10 18 02 26 NMI- 34 BREQ- 42 50 58
3 A3 11 All 19 03 27 RESET- 35 ECO 43 51 59
4 A4 12 A12 20 04 28 BA 36 EC1 44 52 60
5 A5 13 A13 21 05 29 BS 37 EC2 45 53 61
6 A6 14 A14 22 06 30 IRQ- 38 EC3 46 54 62
7 A7 15 A15 23 07 31 HALT- 39 47 55 63
Availa,ble signals:
AO Al A2 A3 A4 A5 A6 A7
A8 ' A9 AlO All A12 A13 A14 A15
DO 01 02 03 04 05 06 07
RO/WR- FIRQ- NMI- RESET- BA BS IRQ-
HALT-MROY OPFTCH- BREQ- ECO ECl EC2 EC3
The available signals fall into the following groups:
AO-An
DO-On
Processor-dependent signals
ECO-EC3
Address lines. The number of these lines depends on the target processor.
Data lines. The number depends on the target processor.
These miscellaneous signals bear names as similar as possible to those used by the chip
manufacturer.
External connections. These may be connected to any signals in the user1s target system.
Enter the trace position, <RETURN>, <TAB>, or <1>.
Trace position,·
<RETURN>
<TAB>
<?>
Identify the position within the map which is to be set. The trace position is a decimal integer 0-63.
Accept signal map as displayed and terminate conmand.
Set entire map to its default and resume dialog.
Generates the help display.
The ADS prompts for a signal name or <RETURN> after the user enters a trace pos·ition. <RETURN> specifies that no signal is to be mapped in this trace position; the corresponding line in a waveform display is blank. A signal name is completed automatically when the user enters enough characters to
uniquely identify it to the system. The ADS asks for confirmation and sets the previously selected map position to show this signal.
The display itself shows one signal per line in its window and uses special graphic characters to draw transitions between high and low states.
The example below shows a waveform display shown on a screen that may also
contain symbolic or hex data. Only five lines (AO - A4) are shown. If the
screen was mapped to a single window, thirteen lines (AO - A12) would be shown.
+00 +08 +10 +18 +20 +28 +30 +38 +40
•
•
AO A1 A2
• •
A3 -W. U U U
•
LlA4 • •
Labels across the top of the display identify trace entry numbers at intervals
of eight entries. The current entry's position is approximately in the center
of tbe data, and signals within the current entry fall within a vertical reverse-video bar.
Signal-names appear to the left of the traces. These names can be edited in the Window Mode command to group signals in any order, to delete signals from the set to be displayed, to add signals to the set to be displayed, and to supply blank lines between groups of signals.
As in the cycle data display, the Display command and related functions assign values to the current entry to position the display over any part of the trace
data. One subtle difference is that the up and down arrow keys position new
sets of signals in the window, rather than positioning a new set of entries.
The following table shows the association of processor-dependent data bits with particul ar signals for each target processor. Signal names shown below are those which would appear in a logic Analyzer waveform display. Blank slots indicate bits which are not used, or which are only used internally by the Slave Emulator:
Bit II Bit pattern 8086 68000 6809 6502
a
1a
0'--'00"1 2
a a a a
RO/WR- RO/WR- RO/WR-RO/WR-... 2_ 4
a a a a
I/OOPFTCH-3 8 00
a a
BHE4
a
1a a a
UOS- FIRQ- SYNC 5a
2a a a
SO- lOS-NMI-6
a
4a a a
S1- FCORESET-7
a
8a a a
S2- BGACK ROY8
a
0' 100' FC1-IRQ-9
a
0' 2.0a
FC2-NMI-10'
a
0' 4a a
HALT- BARES-11
a a
8a a
QT112
a a a
1a
QT2 BS13
a
0' 0 2.0 - QT3 BG-IRQ-14
a
0'a
4'0 RD- IPlO-HAlT-15
a a
0 8a
INTA- IPL1- MRDY16
o a a
0 1 NMI17
a a a a
2 INTIPl2-18
o
00 -0 4 RESET BERR ..19-
a a a a
8 HlDACK- BR-Cycle Data Display
Each entry in this display presents all recorded data for a single bus cycle. Entries are formatted on separate lines, with cycle data grouped into columns, as shown in the following sample display from a 6809 emulator:
Operation Addr Data Ext lines Processor-dependent
-05 Write memory E710 00 1111 5 7 2 C E
-04 Write memory E711 00 1111 072 C E
-03 Opcode fetch . E42F \ 8E 1111 3 7 0 C 8
-02 Read memory E43F E4 1111 F 7 0 C C
-01 Read memory E431 3D 1111 7 7 0 C C
+00 Opcode fetch E431 BF 1111 B 7 0 C 8
+01 Read memory E433 E7 1111 7 7 0 C C
+02 Read memory E4FF 00 1111 F 7 0 C C
••••••••••••••••••••••••••••••••••••••••••••••••••••••••••••••••••••••••••••••
+03 Read memory FFFF 55· 1111 F 7 0 C C
•••••••••••••••••••••••••••••••••••••••••••••••••••••••••••••••••••••••••••••••
+04 Write memory E700 E4 1111 5 7 2 C E
+05 Write' memory· . ElOl 3D 1111 0 7 2 C E
+06 OpcOde ·fetch E435 7E 1111 3 7 0 C 8
+07 Read memory' , E435 F3 1111 F 7 0 C C
+08 Read memory· E4FF 07 1111 7 7 0 C C
Entry +03 appears in reverse video in the actual display to indicate that it is the current entry in the current window. Entry +00, the bus cycle that triggered the breakpoint, is displayed in double intenSity in the actual
display. .
The sample display above was generated with Screen Map 0 selected, so that the entire data portion of the display is devoted to this window. The cycle data display may also be used with other screen maps so that it occupies either the top or bottom half of the data display. In either case, the current entry is
centered vertically within the window. In the sample above, the user
Display data is defined as follows:
Entry number: The signed two-digit hexadecimal value in the leftmost column shows the position of each entry relative to the triggering bus cycle. The user can center the window's display around any particular entry by using the Display command to select that entry as current. The current address set by the display command is simply taken to be the current entry.
Operation:
Addr:
Data:
Ext lines:
Processor-dependent~
Use of signed values for entry numbers requires that the user enter "Display O-n" to display entry "-n". "Display _nil uses the 'usua-ldefaulting technique to displ ay entry "c_n", where "c"
is the number of the current entry. The arrow keys and the "+"
and "_" commands change the current entry number in the same way as they do for memory addresses.
The ASCII name identifying the type of bus cycle indicated by this trace entry. The cycle identification is derived from processor;.odependent data in the' trace.' entry.
The hexadecimal addr~ss present on the processor's address bus
during the cycle. The address is reported as if all bits'on the
target address, bus are meaningful; i~ actual practice" some
types of ,cycles on some processors do not use the entire width of the address bus.
The hexadecimal data cOmnlunicated in this cycle. The cycle data display uses processor-dependent bits to determine how much data
is meaningful for each cycle, and formats only the appropriate part of the data bus.
This represents the four external lines which the user may
connect to any signal in the target system. The values of these lines are shown in binary, with Line 0 regarded as the low-order rightmost bit and Line 3 regarded as the high-order leftmost bit. The external lines display 1111 when the probes are not connected. ,.
This column shows 20 bits of data formatted as individual hex digits, which have unique meanings for each processor. These typically include bits which define the type of cycle, indicate processor status, report pending interrupt requests,
etc. '
These signals are numbered from 0-19 for identification
purposes. The leftmost hex digit contains Signals 0-3, with 0 in the low-order (rightmost) bit position within the digit. Each successive digit to the right contains the next
higher-numbered four bits in the same bit order.
4.4.2 MODE COMMAND
The Mode command uses a display format and user dialog similar to those used by the breakpoint command. The sample display below incorporates current mode settings which correspond to the initial defaults except for the
enable/disable Analyzer submode:
HELP. DISPLAY-.".
Mode parameter:
****Analyzer enabled, break 3 disabled****
---Mode
and/or breaks = A or 0 scope' ='[scope]
enable/disable analyzer = E or D
run/pause after trace
=
R or Ptimer units
=
[unit code].
.
.Breakpoint/logic analyzer modes
And/or breaks = 0
Scope
=
1 (snap regs only)Enable/disable analyzer = E Run/pause after trace = P
Timer units
=
microsecondsDefault all mode parameters toinital.values. Set all mode parameters for event timing •
.
'.
---
..
-,---_.---[scope] Scope of information updated at a snapshot breakpoint:
o
= Nothing1 =. Register contents
2 = Register contents and memory being displayed
**Logic Analyzer trace is independent of snapshot breakpoint scope
[unit-code] Units used by event timer:
Microseconds
Nanoseconds (min. resolution
=
100 nanoseconds)Bus cycles
AND/OR breaks mode specifies how different breakpoints interract:
OR indicates all breakpoints function independently.
AND indicates all breakpoints function together. Initially only the lowest-numbered active breakpoint is armed; when its conditions are
Scope indicates how much data the Slave Emulator updates when the target system reaches a snapshot breakpoint:
o
=
Nothing1
=
Register contents2
=
Register contents and memory- d:lsplayedThe Slave Emulator does not interrupt the target system and does not report register or memory contents to the ADS. This is useful only when t~e breakpoints are used to trigger the Logic Analyzer while the target system continues running in full-speed emu1 at i o.n.
The Slave Emulator interrupts the target system for about 10 milliseconds to examine the current register contents and reports these to the ADS.
The Slave Emulator interrupts the target system. for about 100 milliseconds to examine the current register contents and check for altered data in memory areas whose contents are buffered in the ADS for the Debugger display.
In the display of current mode settings" this parameter appears as:
o
(snap nothing)- 1 (snap regs only) 2 (snap regs and mem)
En~ble/disableAnalyzer enables or disables Logic. Analyzer operation and
breakpoint 3. In this mode, reaching a breakpoint (either ORed or ANDed) supplies a Logic Analyzer trace trigger. Execution continues until the number of bus cycles indicated by the post-trigger delay ha.s Deen traced.
Run/pause after trace specifies whether or not the target processor is to continue running while the Slave Emulator copies out the contents of the Logic Analyzer's trace buffer. This applies only when the triggering breakpoint specifies the "snap" option.
The run setting allows the target processor to continue execution. If the snapshot scope mode is 0 this causes Logic Analyzer trace updates with absolutely no interruption of target system e~ecution. Other settings of the snapshot scope mode delay the target system by the times quoted
above. The penalty for this mode is that breakpoints and Logic Analyzer tracing must remain disabled while the Slave Emulator copies the trace buffer. The target system may miss breakpoints.