Georgia State University Georgia State University
ScholarWorks @ Georgia State University
ScholarWorks @ Georgia State University
Biology Dissertations Department of Biology
Summer 8-10-2010
Nuclear Pyruvate Kinase M2 Functional Study in Cancer Cells
Nuclear Pyruvate Kinase M2 Functional Study in Cancer Cells
Xueliang Gao
Georgia State University
Follow this and additional works at: https://scholarworks.gsu.edu/biology_diss
Part of the Biology Commons
Recommended Citation Recommended Citation
Gao, Xueliang, "Nuclear Pyruvate Kinase M2 Functional Study in Cancer Cells." Dissertation, Georgia State University, 2010.
https://scholarworks.gsu.edu/biology_diss/89
NUCLEAR PYRUVATE KINASE M2 FUNCTIONAL STUDY IN CANCER CELLS
by
XUELIANG GAO
Under the Direction of Zhi-Ren Liu
ABSTRACT
Cancer cells take more glucose to provide energy and phosphoryl intermediates for cancer
progression. Meanwhile, energy-provider function of mitochondria in cancer cells is disrupted.
This phenomenon is so-called Warburg effect, which is discovered over eighty years ago. The
detail mechanisms for Warburg effect are not well defined. How glycolytic enzymes contribute to
cancer progression is not well known. PKM2 is a glycolytic enzyme dominantly localized in the
cytosol, catalyzing the production of ATP from PEP. In this study, we discovered that there were
more nuclear PKM2 expressed in highly proliferative cancer cells. The nuclear PKM2 levels are
correlated with cell proliferation rates. According to our microarry analyses, MEK5 gene was
upregulated in PKM2 overexpression cells. Our studies showed that PKM2 regulated MEK5 gene
transcription to promote cell proliferation. Moreover, nuclear PKM2 phosphorylated Stat3 at Y705
showed that double phosphorylated p68 RNA helicase at Y593/595 interacted with PKM2 at its
FBP binding site. Under the stimulation of growth factors, p68 interacted with PKM2 to promote
the conversion from tetrameraic to dimeric form so as to regulate its protein kinase activity.
Overexpression PKM2 in less aggressive cancer cells induced the formation of multinuclei by
regulating Cdc14A gene transcription. Overall, this study presents a step forward in
understanding the Warburg effect.
NUCLEAR PYRUVATE KINASE M2 FUNCTIONAL STUDY IN CANCER CELLS
by
XUELIANG GAO
A Dissertation Submitted in Partial Fulfillment of the Requirements for the Degree of
Doctor of Philosophy
in the College of Arts and Sciences
Georgia State University
Copyright by Xueliang Gao
NUCLEAR PYRUVATE KINASE M2 FUNCTIONAL STUDY IN CANCER CELLS
by
XUELIANG GAO
Committee Chair: Dr. Zhi-Ren Liu
Committee: Dr. E. Shyam P. Reddy Dr. Shi-Yong Sun Dr. Susanna Greer
Electronic Version Approved:
Office of Graduate Studies College of Arts and Sciences Georgia State University Aug 2010
ACKNOWLEDGEMENTS
I would like to sincerely acknowledge my mentor, Dr. Zhi-Ren Liu, for all his excellent
instructions and scientific support in the past six years. Especially, I thank Dr. Zhi-Ren Liu
recruited me in his lab to carry out this fascinating project. Dr. Zhi-Ren Liu gave me very
encouraging advises in my research study.
I would like to earnestly acknowledge the support from my doctoral committees. Dr. E.
Shyam P. Reddy gave so much brilliant suggestions and technical supports in my research. Dr.
Shi-Yong Sun gave me excellent and helpful suggestions in my research project. Dr. Susanna
Greer showed me very patient, superb and detailed instruction in my study.
Specially, I would like to thank Dr. Jenny Y Yang for her great help in my Ph.D. study
and her guidiance in developing my future career life. I would like to acknowledge Dr. Phang
Tai for his grand help in my Ph.D. study in the past years.
Especiallly, I would like to thank Ms. Haizhen Wang for her enormous suggestions and
great contributions to my research. I would like to acknowledge all my labmates, past and
current, for their wonderful technical assistances.
Last but not least, I would like to thank my parents for giving me strong support to let me
TABLE OF CONTENTS
ACKNOWLEDGEMENTS iv
LIST OF TABLES xiv
LIST OF FIGURES xv
CHAPTER 1 GENERAL INTRODUCITON 1
1.1 Cancer metabolism 1
1.1.1 Tumors and Cancer 1
1.1.2 Cancer Metabolism and Warburg Effect 3
1.2 Possible Causes of Metabolic Changes in Cancer Cells 4
1.2.1 Tumor Microenvironment Affects Tumor Metabolism 4
1.2.2 Oncogenes and Tumor Suppressor Genes Regulate Cancer Cell 6
Metabolism
1.2.3 Mitochondrial Malfunction in Cancer Cells 9
1.2.4 Metabolic Malfunction is a Potential Cancer Therapy Method 11
1.3 The Introduction of Glycolysis---Functional and Regulational 13
Mechanisms of Glycolysis in Cancer Cells
1.4 Pyruvate Kinase Type M2 16
1.5 p68 RNA Helicase 21
1.6 MEK5 and MAP Kinase Pathway 25
1.6.1 MAPK Family Members and Their Biological Functions 25
1.6.2 ERK5-MEK5 Signal Pathway 28
1.7 Stat Family and The Biological Function of Stat3 30
1.9 Aims of the Dissertation 38
1.10 References 39
CHAPTER 2 PYRUVATE KINASE M2 PROTES CELL PROLIFERATION 51
BY REGULATING GENE TRANSCRIPTION
2.1 Abstract 51
2.2 Introduction 51
2.3 Results 53
2.3.1 Nuclear PKM2 Levels Correlate with Tumor Progression and 53
Expression of PKM2 Promotes Cell Proliferation
2.3.2 PKM2 Activates Transcription of MEK5 55
2.3.3 PKM2 Upregulates MEK5 Transcription by Activation of Stat3 58
2.3.4 Expression of PKM2 did not Alter Production of Pyruvate and 61
Lactate
2.4 Discussion 62
2.5 Materials and Methods 64
2.5.1 Reagents, Cell lines, and Antibodies 64
2.5.2 RNA Interference, Subcellular Extracts Preparation, Co- 65
immunoprecipitation, immunoblot, Cell Proliferation Assays,
and Chromatin immunoprecipitation (ChIP)
2.5.3 Expression of PKM2 by Adenovirus Using Commercial AdEasy 65
System
2.5.4 Cellular Pyruvate and Lactate 66
2.5.6 Real Time PCR and RT-PCR 67
2.5.7 Gel-Mobility Shift and Super-Shift Assays 68
2.5.8 ChIP, Re-ChIP 68
2.6 References 69
CHAPTER 3 NUCLEAR PYRUVATE KINASE M2 IS A PROTEIN KINASE 119
3.1 Abstract 119
3.2 Introduction 119
3.3 Results 120
3.3.1 PKM2 is a Protein Kinase 120
3.3.2 Dimeric PKM2 is the Active Protein Kinase 121
3.3.3 Binding Tyrosyl Phosphor-protein at the FBP Site Converts the 124
Tetramer PKM2 to the Dimmer and Reciprocally Regulates the
Protein Kinase and Pyruvate Kinase Activities
3.3.4 PKM2 Kinase Substrates Bind to the ADP Binding Site for 129
Phosphorylation
3.3.5 PKM2 Protein Kinase Substrates Bind to the ADP Binding Site 130
3.3.6 Expression of R399E Increased Stat3 Phosphorylation in Cells 132
and Promoted Cell Proliferation
3.3.7 Growth Factor Stimulations Result in Increase in Dimeric PKM2 133
in Cells
3.4 Discussion 134
3.5 Materials and Methods 136
3.5.2 Plasmids Construction 136
3.5.3 Expression and Purification of Recombinant PKM2 137
3.5.4 Transfection and RNA Interference, Subcellular Extracts 137
Preparation, Immunoprecipitation and Immuno Blots, and PCR
and RT-PCR
3.5.5 Size-exclusion Chromatography and Non-denaturing Gel 138
Electrophoresis
3.5.6 PKM2 and Peptide Interaction 139
3.5.7 In vitro Protein Kinase and Pyruvate Kinase Assays 139
3.5.8 Peptide Pull Down and Protein Identification by Mass 140
Spectroscopy
3.6 References 141
CHAPTER 4 NUCLEAR PKM2 REGULATES CDC14A EXPRESSION TO 161
INDUCE MULTINUCLEUS
4.1 Abstract 161
4.2 Introduction 161
4.3 Results 164
4.3.1 Exogenous Overexpression of PKM2 and p68 RNA Helicase 164
Induces Multi-nuclei in Cancer Cells
4.3.2 Nuclear PKM2 Regulates the Expression of Cdc14A 166
4.3.3 PKM2 and p68 RNA Helicase Co-regulate Cdc14A Protein 166
Expression
4.3.5 Cdc14A Mediates the Effect of PKM2 in Induction of Formation 168
of Multinuclei
4.3.6 PKM2 Overexpression Induces formation of Multi-nucleus Only 169
in Less Aggressive Cancer Cells
4.4 Discussion 170
4.5 Materials and Methods 172
4.5.1 Plasmids Construction, Reagents and Antibodies 172
4.5.2 Cell culture, Transient Transfection Assays 172
4.5.3 Relative Real Time PCR (RT-PCR) 173
4.5.4 Chromatin Immunoprecipitation 173
4.5.5 RNA Interference 174
4.5.6 Subcellular Extracts Preparation, Co-immunoprecipitation and 174
Western blot
4.5.7 Immunostaining and Multinucleated Cells Analysis 175
4.6 References 175
CHAPTER 5 CONCLUSIONS AND DISCUSSIONS 192
5.1 Conclusions 192
5.2 Nuclear PKM2 Interacts with Tyrosine-phosphorylated p68 RNA 192
Helicase
5.3 Tyrosine-phosphorylated p68 Peptides Change the Quaternary 193
Structure of PKM2
5.4 Nuclear PKM2 Regulates MEK5 Gene Transcription to Promote Cell 195
5.5 Nuclear PKM2 Phosphorylates Stat3 in the Nucleus to Regulate Its 196
Transcriptional Activity
5.6 Overexpression PKM2 Forms Multinucleus in Less aggressive Cancer 197
Cells
5.7 Dimeric PKM2 Phosphorylates Stat3 Using PEP as Phosphoryl Group 198
Donor
5.8 Arginine 399 Changes the Quaternary Structure of PKM2 199
5.9 References 199
CHAPTER 6 MATERIALS AND METHODS 201
6.1 Nucleic Acids Related Techniques 201
6.1.1 Mini Preparation for DNA 201
6.1.2 Midi Preparation for DNA 202
6.1.3 Agarose Gel Electrophoresis and Gel Extraction of DNA 203
6.1.4 Quantification of DNA and RNA 203
6.1.5 Polymerase Chain Reaction (PCR) Method 204
6.1.6 Restriction Enzyme Digestion and Plasmids Construction 204
6.1.7 Site-directed Mutation Method 205
6.1.8 DNA Sequencing 206
6.1.9 Ethanol Purification of DNA 206
6.1.10 RNA Extraction 206
6.1.11 Reverse Transcription PCR 207
6.1.12 Relative Real Time PCR 208
6.1.14 ChIP-on-chip 209
6.1.15 Microarray Analysis 210
6.1.16 Electrophoretic Mobility Shift Assay 210
6.2 Bacterial Techniques 211
6.2.1 Bacterial Culture and Storage 211
6.2.2 Transformation 211
6.3 Protein Related Techniques 212
6.3.1 Recombinant PKM2 Protein Expression and Purification 212
6.3.2 Gel Filtration 213
6.3.3 Protein Quantification 214
6.3.4 Sodium Dodecyl Sulfate Polyacryalmide Gel Electrophoresis 214
(SDS-PAGE)
6.3.5 Coomassie Blue Staining 216
6.3.6 GelCode Staining 216
6.3.7 Native Gel Preparation 217
6.3.8 Protein In-gel Digestion 217
6.3.9 Protein Identification by Peptide Mass Fingerprinting 218
6.3.10 Antibody Generation and Purification 218
6.3.11 Kinase Assay 219
6.4 Mammalian Cell Techniques 220
6.4.1 Mammalian Cell Culture and Storage 220
6.4.2 Transient Transfection Method 220
6.4.4 Growth Factor Treatment of Cells 222
6.4.5 Whole Cell Lysate Preparation 222
6.4.6 Nuclear Extract and Cytoplasmic Extract Preparation 223
6.4.7 Suspension Growth of HeLa S3 cell 223
6.4.8 Large Scale Nuclear Extract Preparation 224
6.4.9 Immunoprecipitation (IP) and Co-immunoprecipitation (Co-IP) 226
6.4.10 Western Blot 227
6.4.11 Cell Proliferation Assay 228
6.4.12 Recombinant Adenovirus Generation and Infection in 228
Mammalian Cells
6.4.13 Metabolism Measurement 230
6.5 Materials 231
CHAPTER 7 APPENDIX 239
7.1 Detection of Associated Nuclear Proteins to Phosphorylated p68 RNA 239
Helicase
7. 1.1 Abstract 239
7.1.2 Introduction 239
7.1.3 Methods 240
7.1.3.1 Co-Immunoprecipitation and Peptide Pulldown 240
7.1.3.2 Two-Dimensional SDS-PAGE Analysis 240
7.1.3.3 Protein Identification by Peptide Mass Fingerprinting 241
7.1.4 Results and Discussions 242
Helicase with MALDI-TOF
7.1.4.2 Detection of p68 Associated Nuclear Proteins Using 2-D 243
gel
7.1.4.3 Analysis of Nuclear Associated Proteins to 244
Phosphorylated p68 Using Peptide-protein Interaction
Screening Method
LIST OF TABLES
Table 1 List for Gene Expressions Regulated by PKM2 Overexpression in 89
SW480 Cells
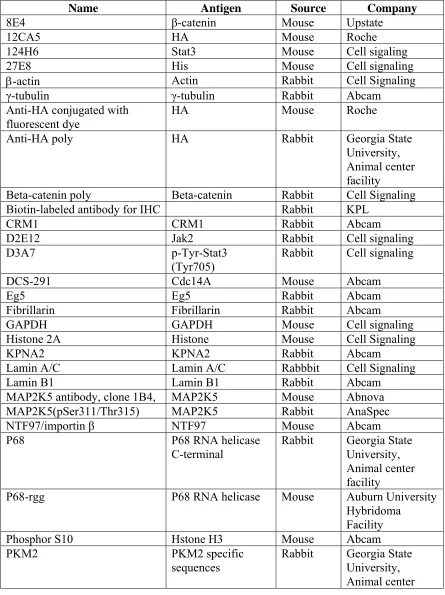
Table 2 Antibody List 231
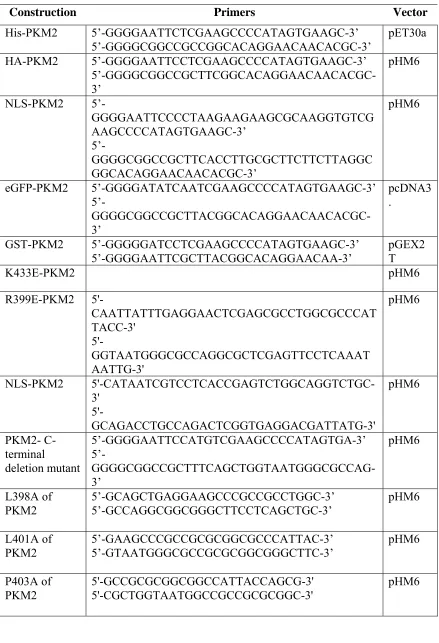
Table 3 Primers List 233
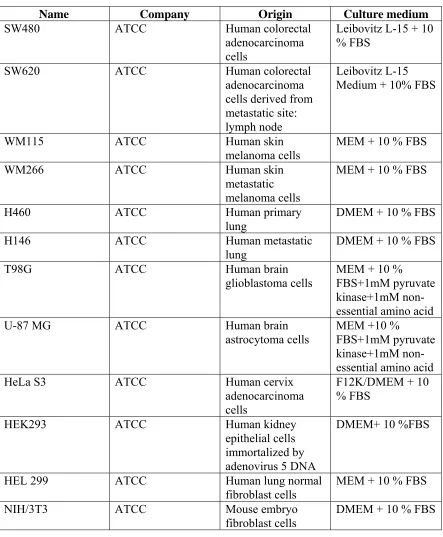
Table 4 Mammalian Cell Lines 235
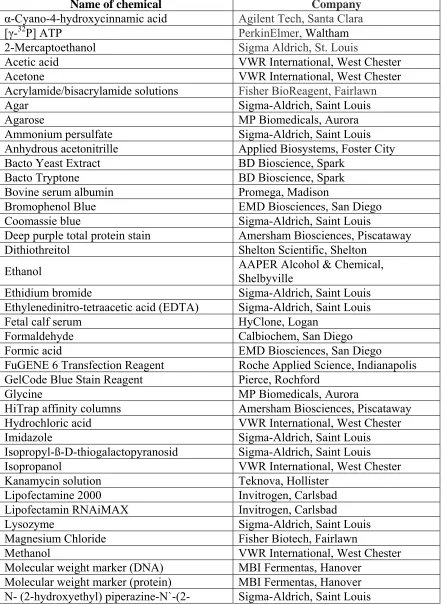
Table 5 Chemicals 236
LIST OF FIGURES
Figure 2.1 PKM2 Promotes Cell Proliferation 71
Figure 2.2 PKM2 Upregulates MEK5 Transcription 73
Figure 2.3 Expression of MEK5 Mediates the Effects of PKM2 in Cell 75
Proliferation
Figure 2.4 PKM2 Upregulates MEK5 Transcription via Activation of Stat3 77
Figure 2.5 PKM2 Upregulates MEK5 Transcription by Promoting Stat3 DNA 79
Interaction
Figure 2.6 PKM2 Phosphorylates Stat3 81
Figure 2.7 Expression PKM2 in Cancer Cells 83
Figure 2.8 PKM2 Interacts with Stat3 to Regulate MEK5 Gene Transcription 85
Figure 2.9 PKM2 is Associated with Stat3 Promoter Region 87
Figure 3.1 PKM2 Phosphorylates GST-stat3. 143
Figure 3.2 Dimeric PKM2 is Active Protein Kinase 145
Figure 3.3 Tyrosine Phosphor-peptide Converts Tetramer PKM2 to a Dimer 147
and Activates Protein Kinase Activity
Figure 3.4 The R399E Mutant Phosphorylates Stat3 in Cells and Expression 149
of the Mutant Promotes Cell Proliferation
Figure 3.5 Growth Factor Stimulation Leads to Tetramer to Dimer 151
Conversion of PKM2
Figure 3.6 Nuclear PKM2 is a Dimeric Form 153
Figure 3.7 Tyrosine-phosphorylated p68 RNA Helicase Interacts with PKM2
both in vivo and in vitro
Figure 3.8 p68 RNA Helicase Interacts with PKM2 at Its FBP Binding Site 157
Figure 3.9 PKM2, Stat3 and p68 Forms a Protein Complex 159
Figure 4.1 HA-PKM2 Expression Induces Multi Nuclei in SW480 Cells 178
Figure 4.2 Cdc14A Expression is Up-regulated by PKM2 and p68 RNA Helicase
180
Figure 4.3 Nuclear PKM2 Regulates Cdc14A Expression 182
Figure 4.4 Cdc14A Expression is Co-regulated by PKM2 and p68 RNA Helicase
184
Figure 4.5 PKM2 Binds to Cdc14A Promoter Region 186
Figure 4.6 Cdc14A Transcription is Regulated by PKM2 Expression 188
Figure 4.7 Cdc14A Expression in Cancer Cell Lines 190
Figure 7.1.1 P68 Post-translation Modifications Analysis with MALDI-TOF 245
Figure 7.1.2 2-D Gel Analyses of p68-associated Nuclear Proteins 247
Immunoprecipitated with p68 Antibodies
Figure 7.1.3 2-D Gel Analysis of p68-associated Nuclear Proteins Pulled Down 249
CHAPTER I
GENERAL INTRODUCTION
Cancer is a serious human disease and the detail mechanism is not well
understoond. Cancer cells uptake more glucose to provide energy and phosphoryl
intermediates for macromolecule systhesis, and their oxidative phosphorylation activity is
decreased, so-called Warburg effect. Warburg effect has been known for decades and the
detail mechanisms are not well defined. In this project, we studied how a glycolytic
protein played a role to regulate gene transcription in cells. Moreover, we investigated
how phosphorylated proteins affect the glycolytic process by regulating the quaternary
structure of a glycolytic enzyme, which provided part explanations for Warburg effect.
1.1 Cancer Metabolism
1.1.1 Tumors and Cancer
In general, tumors are the outcome of abnormal growth of normal cells. There are
three continuous stages normal cells go through to completely develop into tumor cells.
The first stage is hyperplasia, and at this stage the cells grow out of control but still
behave like normally physiological cells. At this stage, tumors can be removed by
surgery; also at this point they are called benign tumors. The second stage is dysplasia,
which is also called the early form of cancerous lesions. At this stage, cells change their
behavior and the differentiation and mature processes of cells are delayed. However, cells
are not invasive to the basement membrane of the soft tissues. Dysplasic cells can be
further graded into different levels even though cells at the highest level of this stage are
process of cell differentiation. At this stage, cells lose their functional and structural
differentiations at physiological conditions. The nuclei of anaplasic cells become
astoundingly hyper-chromatic and large. The nuclear-cytoplasmic ratio increases to 1:1
instead of 1:4~1:6 for normal cells. At this stage, cells gain the ability to invade the blood
system as well as neighboring tissues, which are called malignant tumors; these are also
defined as cancers.
According to their original tissue location, cancers are further divided into five
groups: Carcinoma is originally generated from epithelial cells covering the surface of
internal organs. Sarcoma is a cancer initially from muscle, bone or connective tissues.
Leukemia is generated from white blood cells. Lymphoma is originally from lymphatic
cells. Myeloma is from mature B lymphocyte.
Cancer cells are characteristically different from normal cells. For example, the
disruption of cytoskeletons in cancer cells, such as microfilaments and microtubules,
changes their interactions with neighboring cells as well as their appearances. The change
in cell to cell adhesion helps cancer cells to lose the restrictions of contact inhibition so
that cancer cells can grow unlimitedly even surrounded by other cells. The secretion of
enzymes from cancer cells facilitates them in degrading the basement membrane to
invade into deep tissues. Therefore, these changes create six functional characteristics for
cancer cells with the presence of variously genetic alterations, such as avoidance of
apoptosis, constant reaction to growth signals or stimuli, unrestricted replicative
1.1.2 Cancer Metabolism and Warburg Effect
The metabolism in cancer cells is, to a certain extent, different from normal cells
(Merida and Avila-Flores 2006). One important characteristic of cancer cell metabolism
is the consistent switch of the energy production pathway from oxidative phosphorylation
to glycolysis (Kondoh, Lleonart et al. 2007). In most normal mammalian cells, glycolysis
flux is tightly regulated, and the glycolysis process is inhibited by the presence of
oxygen, which was first discovered by Louis Pasteur. For decades, it has been known that
cancer cells utilize more glucose and display a higher glycolysis rate than normal cells. In
the 1920s, Otto Warburg found that even in the presence of sufficient oxygen, cancer
cells consume glucose for ATP production instead of using the oxidative phosphorylation
pathway (Warburg 1956; Warburg 1956).
In general, through the glycolysis process, one molecule of glucose generates two
molecules of pyruvate and produces two molecules of ATP. In mammals, the product of
the glycolysis process, pyruvate, has diverse fates. In an environment with limited
oxygen, pyruvate is catalyzed into lactate by lactate dehydrogenase, a process which is
called anaerobic glycolysis. In the presence of efficient oxygen, pyruvate is catalyzed
into acetyl coenzyme A by the pyruvate dehydrogenase complex. Acetyl coenzyme A is
consumed in the citric acid cycle to generate electrons in the mitochondria. The electrons
create an electron gradient which generates a pH gradient across the mitochondrial
membrane. The force motive produced by the pH gradient generates ATP by ATP
synthases. This process is called aerobic oxidative phosphorylation. Overall, one acetyl
of FADH2, and eight molecules of electrons. Compared to the aerobic oxidative
phosphorylation pathway, anaerobic glycolysis only produces a small fraction of the total
energy of glucose. One molecule of glucose can be completed degraded into H2O and
CO2 in the oxidative phosphorylation process to produce 38 molecules of ATP. Overall,
the oxidative phosphorylation process is more efficient in producing ATP than
glycolysis.
However, cancer cells desire the glycolysis process to produce ATP instead of the
oxidative phosphorylation pathway. The reason why cancer cells prefer consuming
glucose to produce ATP is not well defined yet. One fact is that the glycolysis process
provides a lot of phosphointermediates besides ATP for cells to synthesize
macromolecules such as lipids, proteins, and nucleic acids.
1.2 Possible Causes of Metabolic Changes in Cancer Cells
1.2.1 Tumor Microenvironment Affects Tumor Metabolism
The metabolism in cancer cells is regulated by many effectors at diverse levels.
Firstly, tumor microenvironment is, to a certain extent, different from normal cells,
characterized by being surrounded with disorganized microvasculature (Allinen,
Beroukhim et al. 2004; Joyce 2005; Anderson, Weaver et al. 2006; Fukumura and Jain
2007; Mohla 2007). Tissues of human bodies need nutrients and oxygen to keep their
normal functions, which is provided through surrounding capillary vessels. Even though
the growth and proliferation of cancer cells is not totally controlled by the same
mechanisms as normal cells, cancer cells still need nutrients as well as oxygen provided
surrounding blood vessels can not provide enough oxygen or other nutrients to them.
Under these conditions, the solid tumor grows in a hypoxic environment (normally below
3%–5% O2). Without enough oxygen provided to the cancer cells they begin to rely on
glycolysis to produce ATP as the major energy providing source. Meanwhile, the
hypoxic environment surrounding cancer cells induces continuous expression and
activation of hypoxia-inducible transcription factor (HIF-1) to regulate the expression of
glycolytic enzymes as well as glucose transporters. Under anoxic conditions, HIF-1 is
degraded by proteasomes due to the recognition by the von Hippel-Lindau (VHL) tumor
suppressor (Mahon, Hirota et al. 2001). Under hypoxic conditions, HIF-1 is activated and
translocates into the nucleus and binds to β-subunit of aryl hydrocarbon receptor nuclear
translocator (ARNT) to regulate O2-induced gene transcriptions (Wiesener and Maxwell
2003). Nearly all the expression of the glycolysis enzymes, such as hexokinase,
phosphofructokinase, aldolase, glyceraldehyde 3-phosphate dehydrogenase,
phosphoglycerate kinase, enolase, pyruvate kinase, lactate dehydrogenase is regulated by
HIF-1 activity (Semenza 2007). The overexpression of these glycolysis enzymes
enhances the glycolysis process to provide more energy to cancer cells. On the other
hand, under hypoxic conditions, HIF-1 induces VEGF expression from cancer cells
which facilitates the growth of blood vessels to provide more oxygen. However, the
blood vessels surrounding tumor cells are so disorganized that they can not provide
enough oxygen and nutrients as in normal physiological conditions. Under these
conditions, the blood vessels surrounding tumor cells still can not alleviate the hypoxic
1.2.2 Oncogenes and Tumor Suppressor Genes Regulate Cancer Cell Metabolism
Some oncogenes and tumor suppressor genes regulate the glycolysis process in
cancer cells, such as c-Myc, AKT, AMPK, Ras and p53.
Akt, a Serine/Theronine kinase, was initially discovered as a cellular homolog of a
viral oncoprotein; this protein is amplified in diverse cancers, such as ovarian, breast
carcinomas, and gastric adenocarcinoma (Vivanco and Sawyers 2002). Akt is the
downstream target of phosphatidylinositide-3-kinase (PI-3 kinase) in growth factor
induced signal pathways. Under the stimulation of diverse survival signals such as IL-6
and IGF-1, PI-3K is activated by phosphorylation to generate phosphoinositides. Akt is
then recruited by phosphoinositides to the cellular membrane to be phosphorylated at
Serine 473 and Threonine 308 residues (Kitamura, Kitamura et al. 1999). Akt can be
dephophorylated by protein phosphatase 2A (PP2A). The PI3K-Akt pathway is an
important signal transduction pathway, playing crucial roles in regulating the cell cycle,
apoptosis, cell survival and cell proliferation (Thompson and Thompson 2004). Cellular
Akt is also activated by the deletion of phosphatase and tensin homolog on chromosome
10 (PTEN), an antagonist of PI-3, in many cancers, such as brain, breast, and prostate
cancers (Li, Yen et al. 1997). In addition, Akt is activated by a number of oncoproteins,
such as Bcr-Abl in chronic myelogenous leukemia, Her2 in breast cancer, as well as Ras.
Activated Akt has many downstream targets, such as nuclear factor-kappa B (NF- B),
GSK-3, and Bad. Activated Akt is pluripotent in contributing to tumorigenisis, such as
of Akt promotes its survival capability by inceasing glycolysis levels. Akt regulates
glycolysis though many aspects. Firstly, the activated Akt pathway in respiration
deficient cancer cells increases glucose consumption by regulating the transcription and
translation of glucose transporter1 (GLUT1) to support their survival and growth (Plas,
Talapatra et al. 2001; Rathmell, Fox et al. 2003). Second, activated Akt stimulates
hexokinase activity to convert glucose to glucose-6-phosphate, a modified form of
glucose which can not diffuse freely out of the cell, so as to increase the cellular amount
of glucose (Gottlob, Majewski et al. 2001) (Rathmell, Fox et al. 2003). Third, Akt
regulates phosphofructokinase (PFK-1) activity, a key enzyme in controlling the
glycolysis rate, through phosphorylating and activating PFK-2. PFK-2 catalyze the
production of fructose 2,6-bisphosphate, which is an allosteric regulator of PFK-1 to
overcome the inhibition effect of high ATP levels on PFK-1 (Deprez, Vertommen et al.
1997). In addition, it is reported that the overexpression of Akt is sufficient to promote
transformed cells’ aerobic glycolysis without affecting their oxidative phosphorylation
level (Elstrom, 2004 #5019). Furthermore, the inactivation of mitochondrial respiration
in human leukemia and lymphoma cell activates PI-3K-Akt pathway by oxidating the
tumor suppressor PTEN. The activated PI-3K-Akt pathway benefits cell survival
(Pelicano, Xu et al. 2006). The direct effect of Akt on glycolysis may contribute to the
Warburg effect (Coloff and Rathmell 2006).
c-Myc is a nuclear oncoprotein, which is constantly active in many malignant
tumor cells independent of growth factor stimulations (Elliott, Ge et al. 2000). It is
reported that c-Myc regulates many glycolysis-related gene transcriptions to control
phosphofructokinase, aldolase, enolase and pyruvate kinase (Gordan, Bertout et al.
2007). Interestingly, c-Myc not only upregulates glycolysis-related genes transcriptions
for energy production, but also promotes mitochondrial biosynthesis through targeting
the mitochondrial transcription factor A (TFAM) (Li, Wang et al. 2005). The products
from mitochondrial biosynthesis provide intermediates for macromolecular synthesis,
such as fatty acid, nucleotide, polyamine as well as amino acids (Coller et al., 2000;
O’Connell et al., 2003).
AMP-activated protein kinase (AMPK), is a master regulator controlling energy
metabolism, which was first identified in 1994 as an inhibitor of acetyl-CoA carboxylase
and 3-hydroxy-3-methylglutaryl-CoA reductase (HMGR) (Kemp, Stapleton et al. 2003).
AMPK activity is stimulated by its upstream effetor, AMPK kinases (AMPKKs), with
the phosphorylation at Threonine172 residue. AMPK is also directly activated by AMP.
AMPK is reported to regulate glucose consumption by controlling the transcription of
GLUT1 and the translocation of GLUT1 to cellular surface (Russell, Bergeron et al.
1999). AMPK activates 6-phosphofructo-2-kinase (PFK-2), the enzyme that synthesizes
fructose 2,6-bisphosphate in cardiac muscle cells under ischaemic conditions (Marsin,
Bertrand et al. 2000).
p53, an important tumor suppressor, plays important roles in regulating apoptosis,
cell cycle arrest, and DNA replication. p53 is inactive in more than half of cancers
(Hainaut and Hollstein 2000). It is reported that the activation of p53 causes the
downregulation of several glycolytic enzymes’ transcription, such as phosphoglycerate
mutase (PGM), and GLUT (Schwartzenberg-Bar-Yoseph, Armoni et al. 2004). In the
the glycolysis flux. Interestingly, the activation of p53 increases the oxidative
phosphorylation rate by upregulation of the synthesis of cytochrome oxidase 2 (SCO2).
SOC2 is crucial for regulating cytochrome c oxidase (COX) complex activity to use
oxygen in oxidative phosphorylation pathway. Therefore, the loss of p53 activity benefits
cell proliferation by increasing the glycolysis rate and decreasing mitochondrial oxidative
phosphorylation activity, which is another possible explanation for the Warburg effect
(Matoba, Kang et al. 2006). p53 is a nuclecytoplasmic shuttling protein which depends
on its leucine-rich nuclear export signal (Stommel, Marchenko et al. 1999). It is reported
that p53 also translocates to mitochondria under stimuli to induce apoptosis by directly
interacting with a Bcl-2 family protein (Erster, Mihara et al. 2004). Moreover, p53 plays
important functions in maintaining mtDNA integrity in response to mtDNA damage by
interacting with mtDNA and DNA polymerase γ to enhance poly γ transcriptional
activity (Achanta, Sasaki et al. 2005).
1.2.3 Mitochondrial Malfunction in Cancer Cells
Mitochondrion is an important cellular organelle which takes part in regulating cell
metabolism, producing reactive oxygen species (ROS) as well as inducing apoptosis (Lu,
Sharma et al. 2009). Mitochondria have their own DNA as well as DNA transcription,
replication and repair system to encode 13 polypeptides as the components of oxidative
phosphorylation chain (Anderson, Bankier et al. 1981). In cancer cells the energy
producer function of mitochondria is decreased for many reasons. First, in cancer cells,
the transcription rate of the mitochondrial genome is reduced to a certain level compared
mtDNA lacks histone protection from damages. Third, mitochondrial DNA is circular,
supercoiled, and is easily damaged due to diverse exogenous or endogenous effects, such
as radiation and ROS. Fourth, there are few DNA repair mechanisms in mitochondria
compared to the nuclear genome (Achanta, Sasaki et al. 2005). All these properties make
mitochondrial DNA to be easily affected by mutations, which disrupts the electron
transport chain to decrease mitochondrial respiration rate. In addition, the malfunction of
the electron transport chain in cancer cells produces superoxide, which forms ROS with
other radicals. The accumulation of ROS damage mtDNA and nuclear DNA causes
genetic instability as well as cancer progression (Pelicano, Carney et al. 2004). Usually,
there are two characteristics of mtichondrial DNA mutations in cancer cells. First, the
mutations are base transitions from T to C or G to A. Second, the mutations in the
mitochondrial genome frequently occur in the 1.1 kb displacement-loop region (Ding, Ji
et al. 2009).
The malfunction of mitochondrial genome decreases oxidative phosphorylation
efficiency for ATP production. On the other hand ATP produced in the oxidative
phosphorylation process is an inhibitor for phosphofructokinase 1 (PFK1) in glycolysis.
PFK1 is the major pace-keeping enzyme in glycolysis, and activated PFK1 increases
glycolysis flux, which makes a transition for energy production from oxidative
phosphorylation to glycolysis in cancer cells. Moreover, studies show that the disruption
of mitochondrial respiration function in cancer cells induces tumorigenesis. For example,
the interruption of mitochondrial respiration with genetic, chemical and
microenvironmental methods, activates the PI3K-Akt pathway (Robey and Hay 2009). It
in cell survival, proliferation and migrations (Robey and Hay 2009). In
mitochondria-deficient human leukemia and lymphoma cells, glycogen synthase kinase-3 (GSK-3), the
substrate of Akt, is activated by Akt phoshphorylation. Therefore, the malfunctions of
mitochondrial respiration in cancer cells may present part of the full explanation for the
Warburg effect.
1.2.4 Metabolic Malfunction is a Potential Cancer Therapy Method.
Even though the mechanisms of the Warburg effect are not fully understood, thus
far, the theory of the Warburg effect has been applied clinically in cancer diagnosis and
therapy. For example, the Warburg effect has been used in cancer imaging for tumor
detection by a glucose analogue, fluorodeoxyglucose, Positron Emission Tomography
(FdG-PET) (Weber, Schwaiger et al. 2000). The fact that cancer cells require more
glucose for energy production leads to FdG-PET, a powerful method in cancer diagnosis
and prognosis (Kelloff, Hoffman et al. 2005). In addition, the increase of protein
expression in glycolysis in cancer cells, such as HK2, and the decrease of the expression
of components in the oxidative phosphorylation pathway, such as β-F1-ATPase, are
also applied as biomarkers for cancer diagnosis (Cuezva, Ortega et al. 2009).
On the other hand, Akt/mTOR/HIF-1, a major regulatory signal pathway for the
Warburg effect, has been targeted as a cancer therapy method to switch the energy
production sources, that is, to decrease glycolysis efficiency and increase oxaditive
phosphorylation competence (Jiang and Liu 2008). The activation of HIF-1 induced by
Akt under hypoxia environment promotes cancer cell survival. By these methods, the
cancer cells cannot survive in the abnormal physiological conditions. For this purpose,
some inhibitors for mTOR, such as RAD001, AP-23573 and CCI-779, and HIF-1a
inhibitors, such as NSC644221, PX-478 and YC-1 are applied to impact cancer cell
metabolism (Yeo, Chun et al. 2004; Smolewski 2006; MacKenzie and von Mehren 2007;
Sun, Liu et al. 2007; Wan and Helman 2007; Gridelli, Maione et al. 2008; Jiang and Liu
2008).
Moreover, the fact that cancer cells depend on increased glycolysis as an ATP
provider in hypoxic environments, brings a basis for disruption glycolysis as a potent
cancer therapy. The disruption of the glycolytic pathway in order to limit the energy
production has been studied as a promising cancer therapeutic method (Pelicano, Martin
et al. 2006). For example, 3-BrPa, a hexokinase inhibitor, shows effective anti-cancer
properties in colon cancer cells and lymphoma cells (Chen, Hewel et al. 2007).
2-deoxyglucose, a glucose analogue, which cannot be metabolized to produce ATP, is in
clinical trails as an interruptor of the glycolytic pathway which induces tumor cell death
(Mohanti, Rath et al. 1996). A hexokinase inhibitor, lonidamine, releases hexokinase
bound to mitochondria, and inhibits oxygen consumption and glycolysis effectively in
cancer cells (Brawer 2005). Glufosfamide, an alkylating agent from D-glucose, which
damages DNA and activates PARP, is also in phase II clinical trials in patients with
advanced non-small cell lung cancer (Giaccone, Smit et al. 2004). Evasion from
apoptosis is one of the characteristics of cancer cells. Tumor cells that are defective in
cell apoptosis can be diverted into another cell death pathway, necrosis (Zong and
Thompson 2006) (Nelson and White 2004). Necrosis is happening in tumor cells when
glycolysis pathway may induce tumor cell necrosis. Even though chronic necrosis may
trigger chronic inflammation, it still is a potent method for tumor therapy.
1.3 The Introduction of Glycolysis---Functional and Regulational Mechanisms of
Glycolysis in Cancer Cells
Glucose is a very important energy source for the human body, and the body can
use many sources for producing glucose. Glucose is a monosaccharide which can be
generated from the hydrolysis of polysaccharides and disaccharides, such as starch and
lactose. In some tissues, such as brain cells, glucose is the only available energy source,
under non-starvation conditions. Glucose can also be synthesized from non-carbohydrate
precursors, such as lactate, amino acids and glycerol. The formation of glucose from
other non-cabohydrate carbon substrates, such as glycerol, lactate and glucogenic amino
acides is called gluconeogenesis. The gluconeogenic pathway occuring in mitochondrial
and cytosol, converts pyruvate into glucose. Gluconeogenesis is not simply the reverse
process of glycolysis, as it takes two steps to convert pyruvate into PEP. The first step is
the carboxylation of pyruvate to generate oxaloacetate catalyzed by pyruvate carboxylase
at an expense of one molecule of ATP. The second step is under the function of
phosphoenolpyruvate carboxykinase to generate PEP from oxaloacetat at the expense of
one molecule of GTP.
Glycolysis is the metabolic process for cells to catalyze one molecule of glucose to
produce two molecules of pyruvate, with a net energy production of two molecules of
ATP. There are 10 reaction steps in this process carried out by 10 distinct enzymes. In
The sequence of glucose transporters is 500 amino acids long and consists of 12
transmembrane α helices. There are five members of GLUT family presented in specific
tissues. GLUT1 and GLUT3 are responsible for controlling basal glucose uptake. GLUT2
exists in liver and pancreatic β cells to control glucose uptake from the blood with a very
high Km value. GLUT4 is present in muscle and fat cells. GLUT5 exists in the small
intestine. Once glucose is transported into the cells through GLUT, hexokinase, the first
enzyme in the glycolysis process, phosphorylates glucose to form glucose 6-phosphate.
Once phosphorylated, glucose 6-phosphate can not diffuse through the cell membrane
and is trapped in the cytosol. Glucose 6-phosphate is further converted into
fructose-6-phosphate through the function of phosphoglucose isomerase. In the next stage, the
six-carbon fructose is cleaved by aldolase to generate two molecules of three-six-carbon
fructose, glyceraldehyde 3-phosphate (GAP) and dihydroxyacerone phosphate (DHAP).
GAP is the only form of the two, three-carbon molecules that can be used in the
glycolysis process. Triose phosphate isomerase converts one molecule of DHAP into one
molecule of GAP. Next, glyceraldehyde 3-phosphate dehydrogenase (GAPDH) catalyzes
the formation of 1,3-bisphosphoglycerate (1,3-BPG) from GAP with the production of
NADH. In this step, phosphorylation is coupled to the oxidation of three-carbon
molecules. 1,3-BPG is an acyl phosphate, which has a high phosphoryl-transfer potential.
The phosphate is transferred to ADP in the next step under the catalytic function of
phsophglycerate kinase with the production of ATP. In the next step, the phosphoryl
group is shifted with the conversion of 3-phosphoglycerate to 2-phosphoglycerate by
phosphoglycerate mutase. Enolase catalyzes the conversion from 2-phosphoglycerate to
molecule of H2O. The enol phosphate in PEP has a high potential to transfer phosphate.
In the final step, pyruvate kinase catalyzes this reaction and a phosphate is transferred to
ADP with the production of a molecule of ATP committed with the formation of
pyruvate.
The fates of pyruvate are diverse in different living organisms. In yeast and some
other microorganisms, pyruvate is converted into ethanol catalyzed by pyruvate
decarboxylase. In mammalian cells pyruvate is catalyzed into lactate by lactate
dehydrogenase when oxygen is lacking. Most pyruvate produced in the glycolysis
process enters into the citric acid cycle and the electron-transport chain in mitochondria
to generate energy needed for higher organisms.
The pace of glycolysis is tightly regulated by the catalytic enzymes. Three
glycolytic enzymes, which catalyze these irreversible glycolytic reactions, are involved
in the regulatory process; they are hexokinase, phosphofructokinase and pyruvate kinase
(Weber, Convery et al. 1966). Among these three enzymes, phosphofructokinase is the
predominant regulator in the glycolytic pathway whose enzymatic activity is tightly
controlled by the ATP/AMP ratio in mammalian cells. Phosphofrucokinase catalyzes the
third step in the glycolysis process, which is the conversion from fuctose 6-phosphate to
fructose-1,6-bisphosphate (FBP). During this process, fructose 2,6-bisphosphate formed
from the phosphorylation of fructose 6-phosphate by phosphofuctokinase 2, regulates the
activity of phosphofuctokinase. Fructose 2,6-bisphosphate activates
phosphofructoskinase by increasing the affinity for fructose 6-phosphate as well as
decreasing the ATP inhibitory effect to phosphofructokinase. Meanwhile, as an important
tightly controlled by its phosphorylation status. Fructose 2,6-bisphosphate can be
dephosphorylated by fructose bisphosphatase 2 (FBPase 2). Phosphofuctokinase 2 and
FBPase 2 are in a single peptide chain as a bi-functional enzyme. This bi-functional
enzyme has five isoforms presenting as tissue specific. Overexpression of fructose
2,6-bisphosphatase decreases glycolysis flux and delays cell cycle progression (Perez, Roig
et al. 2000).
Hexokinase is the second control element for the glycolytic pathway and it
phosphorylates glucose to phospholate-6-glucose in the first step of the glycolysis
process. Hexokinase activity is inhibited by its catalytic product, phospholate-6-glucose.
Under these circumstances in which cells have enough energy production or high sources
for macromolecule biosynthesis, phospholate-6-glucose will pass these signals to
decrease the glycolysis process. In livers hexokinase has another isozyme, glycokinase,
whose affinity to glucose is 50 folds lower than that of hexokinase. The function of
glycokinase in liver is to provide phospholate-6-glucose for glycogen synthesis as well as
fatty acid synthesis.
1.4 Pyruvate Kinase Type M2
Pyruvate kinase (PK) is the third rate-limiting enzyme in glycolysis process.
Pyruvate kinase catalyzes the transfer of phosphoryl group from phosphoenolpyruvate
(PEP) to ADP to produce pyruvate and ATP (ΔG°’PEP=58 kJ/mol, ΔG°’ATP=29
kJ/mol). This reaction is chemically irreversible. In mammalian cells, there are four types
of pyruvate kinases in different tissues. L type is expressed exclusively in liver and R
expressed in fetal tissues and some proliferating tissues, such as tumor cells. During
tumorigenesis, the tissue specific forms of PK, such as L and M1 types, lose their
expression and M2 type is expressed (van Berkel, de Jonge et al. 1974; Miwa,
Nakashima et al. 1975; Etiemble and Boivin 1976; Marie, Kahn et al. 1976). The L and R
types are generated from one gene with different transcriptional start sites. M1 and M2
types are isoforms derived from the same gene but are different due to alternative
splicing (Saheki, Saheki et al. 1982; Noguchi, Inoue et al. 1986). The M gene consists of
12 exons and 11 introns. In M2 type, exon 10 is spliced out, and in M1 type, exon 9 is
spliced out. The splicing generates 23 different amino acids in a 56 stretch between M1
and M2 types at the carboxyl terminal from 378-434. During tumorigenesis, M1 type
expression is replaced by M2 type. The replacement of M1 type by M2 type changes the
glycolysis rate to produce more phosphoryl intermediates for cell proliferation.
The PKM2 protein consists of 531 amino acids and each monomer has four
designated domains, such as A, B, C and N domains. Two monomers contact each other
through the A domain interface to form a dimeric structure. Two dimers form a tetramer
through the A and C domain interface (Dombrauckas, Santarsiero et al. 2005). The
N-domain consists of residues 1-43. The A N-domain, consisting of residues 44-116 and
219-389, and is the core structure of the monomer. The B domain comprises residues
117-218. The C-domain is made of residues 390-531. The active site of PKM2 is located in
the cleft constructed by A and B domains. The FBP binding site for PKM2 is positioned
at the C-domain. Lysine 433, Serine 434, Serine 437, and Glycine 520 residues are
backbone amides that bond to the 6’-phosphate oxygens of FBP. Among these residues,
Tyrosine phosphorylated peptides (Christofk, Vander Heiden et al. 2008; Christofk,
Vander Heiden et al. 2008; Spoden, Morandell et al. 2009). Lysine 270 is a conserved
site for all four types of pyruvate kinases and is crucial for its kinase activity
(Dombrauckas, Santarsiero et al. 2005).
In mammalian cells PKM2 has two known quaternary structures, dimeric and
tetrameric forms. Tetrameric PKM2 has a higher affinity to its glycolysis substrate, PEP,
compared to its dimeric form. In tumorigenesis, there is more dimeric PKM2 expressed
with low affinity to PEP, which is called human tumor PKM2. The presence of dimeric
PKM2 in patients feces, blood is utilized as a biomarker for the diagnosis of many
cancers, such as colorectal cancer, prostate cancer and pancreatic cancer (Hardt,
Ngoumou et al. 2000; Ahmed, Dew et al. 2007; Chung-Faye, Hayee et al. 2007; Dube,
Grigull et al. 2007; Ewald, Schaller et al. 2007; Goonetilleke, Mason et al. 2007; Haug,
Rothenbacher et al. 2007).
The low affinity of tumor PKM2 (dimeric PKM2) to PEP decreases the glycolysis
rate so as to produce more phosphor intermediates, which are used to synthesize lipids,
amino acids and some other macromolecules for cell growth and proliferation. The
quaternary structure of PKM2 is regulated by many factors, such as fructose 1,
6-bisphosphorylate (FBP), Serine and some oncoproteins (Mazurek, Grimm et al. 2002).
Fructose 1, 6-bisphosphate (FBP), a proceeding molecule in the glycolysis process, binds
to PKM2 to induce its conformational change to the exposed active sites binding to PEP.
The allosteric activity of PK is also regulated both by ATP and alanine, an important
PK are also controlled by reversible phosphorylation. Phosphorylated PK is less active
than non-phosphorylated form.
Tetrameric PKM2, not dimeric PKM2, is associated with many other glycolytic
enzymes to perform its glycolytic function, such as hexokinase (HK), glyceraldehyde 3-P
dehydrogenase (GAPDH), phosphoglycerate kinase, phoglyceromutatse (PGM), enolase
and lactate dehydrogenase (LDH) (Mazurek, Hugo et al. 1996). However, the interaction
of PKM2 with some other proteins in the cytosol may change its glycolytic activity.
Some oncoproteins, such as pp60V-src kinase and HPV-16E7 proteins directly interact
with PKM2, individually to help the conversion of dimeric forms from tetrameric form,
which results in a decreased ATP/ADP ratio and upregulated FBP level in the cytosol
(Zwerschke, Mazurek et al. 1999). On the other hand, some tumor suppressor proteins,
such as promyelocytic leukemia (PML), also interact with tetrameric PKM2 to suppress
its glycolytic activity (Shimada, Shinagawa et al. 2008). Interestingly, PKM2 is a
phosphoTyrosine binding protein, and the binding of Tyrosine phosphorylated peptides
to PKM2 decreases its enzymatic activity (Christofk, Vander Heiden et al. 2008).
Moreover, it is reported that the cytosolic monomer of PKM2 binds to cytoplasmic
thyroid hormone 3,3',5-triiodo-L-thyronine (T3) to regulate transcription activity of
thyroid hormone receptors (Ashizawa and Cheng 1992).
Besides its well-known glycolytic function in the cytosol, it is not known whether
PKM2 have any other biological functions. Under the stimulation of interleukin 3 (IL-3),
more PKM2 localizes to the nucleus to regulate cell proliferation in an IL-3-dependent
hematopoietic cell line, Ba/F3 (Hoshino, Hirst et al. 2007). There are many reported
important transcription factor for regulating the pluripotent state of embryonic stem cells,
to positively modulate gene transcription (Lee, Kim et al. 2008). Interestingly, the
N-terminal (a.a.1–348) of PKM2, interacts with the SUMO-E3 ligase protein PIAS3
(inhibitor of activated STAT3) in the nucleus of many cell lines, such as NIH3T3 and
U-2 OS (Spoden, Morandell et al. U-2009). SUMO, the small ubiquiting modification, is a
post-translational modification occurring at lysine residues in many proteins (Miller,
Levy et al. 2005). Sumoylation modification changes protein properties including
transcriptional activity, nuclear-cytosolic translocation as well as protein stability. For
example, sumoylation of interferon regulatory factor-1 (IRF-1) induced by PIAS3,
represses its transcriptional activity (Nakagawa and Yokosawa 2002). The transcriptional
activity of microphthalmia transcription factor (MITF) is suppressed due to sumoylation,
it is dependent on the targeting sequence in the promoter of TRPM1 (Miller, Levy et al.
2005). PIAS, the protein inhibitor of activated STAT family, was originally identified as
a cytokine-induced inhibitor of Stat3 and appears to have SUMO-E3 ligase activity
(Chung, Liao et al. 1997; Nishida and Yasuda 2002). PIAS has several family members
(PIAS1, PIAS2, PIAS3 PIAS3b, PIASxa, PIASxb, PIASy, and PIASyE6) sharing similar
protein structures, such as the RING finger-like structure (Shuai and Liu 2005). PKM2 is
sumoylated in U-2 OS cells affected by PIAS3, a human bone osteosarcoma. The
overexpression of PIAS3 increases the sumoylation level of PKM2, which leads to the
accumulation of nuclear PKM2 (Spoden, Morandell et al. 2009). According a SUMO
prediction program and PKM2 X-ray structure analyses, there are eight lysine sites in
PKM2 exposed on the protein surface possibly modified by PIAS3 (Spoden, Morandell et
On the other hand, somatosatin, a neuropeptide hormone and its anti-cancer
analogues, TT-232, interact with pyruvate kinase in COS-7 cells. The interaction induces
nuclear accumulation of PKM2 from cytosol to trigger caspase-independent apoptosis
(Stetak, Veress et al. 2007). Moreover, UV and H2O2 also cause PKM2 nuclear
accumulation independent of its kinase activity to induce apoptosis (Stetak, Veress et al.
2007). PKM2 also has its function in regulating viral replication abilities. For example,
PKM2 interacts with NS5B, the Hepatitis C virus (HCV) RNA-dependent RNA
polymerase, in HCV replicon 9B cells (Wu, Zhou et al. 2008). The downregulation of
PKM2 by shRNA in n HCV replicon 9B cells reduces the replication of HCV (Wu, Zhou
et al. 2008).
Besides its transcriptional regulatory activity, nuclear PKM2 also shows a kinase
activity. It is reported that nuclear PKM2 isolated from Morris hepatoma 7777 tumor cell
nuclei has kinase activity to phosphorylate histone H1 and it is speculated that PKM2
transfers phosphate from PEP to the ε-amino group of L-lysine (Ignacak and Stachurska
2003).
1.5 p68 RNA Helicase
p68 RNA helicase is a member ofthe DEAD box family proteins which share a
conserved an Aspartic acid–Glutamic acid–Alanine–Aspartic acid(D-E-A-D) sequence
motif (Hirling, Scheffner et al. 1989). There are many members in the DEAD family,
such as p68, p72 and eIF-4a. All the members of the DEAD box family have a conserved
amino acid motif, which includes the conserved DEAD box (Petry, Johnson et al. 1995;
found in many species, such as mouse, human, Escherichia coli, Drosophila and
Saccharomyces cerevisiae (Jost, Schwarz et al. 1999). The DEAD box family proteins
show RNA binding and unwinding activities through the conserved DEAD box amino
acids sequence (Iggo and Lane 1989). DEAD box proteins have been shown to be
involved in a wide range of biological processes involving interaction with specific RNA
substrates; examples include pre-mRNA splicing, ribosome biogenesis, translation and
embryogenesis (Stevenson, Hamilton et al. 1998).
Many homologs of p68 RNA helicase have been discovered in chickens, yeast,
frogs, human and mice. In humans, p68 RNA helicase is encoded by a singlegene locus.
The transcribed partof human p68 gene is ~6.7 kb long and is split into 13 exons. Human
p68 RNA helicase was first identified as an antigen cross reacting with a monoclonal
antibody to SV40 large-T antigen, which is a DNA dependent ATPase (Huang and Liu
2002).
P68 RNA helicase plays important roles in pre-mRNA splicing process (Huang and
Liu 2002; Liu 2002). Pre-mRNA splicing is an accurate process, which requires four
small nuclear ribonucleoprotein particles (snRNPs): U1, U2, U4/U6 and U5 as well as
some other non-snRNPs proteins. U1 snRNP binds to the 5’ splicing site of pre-mRNA
and U2 snRNP binds to the branch point. The spliceosome is formed when the U4/U6/U5
triRNPs joins the intermediate spliceosome complex. The 5’ splice site is cleaved and the
exposed 5’ end of the intron links to the branching site. Next, the 3’-OH end of the first
exon adds to the 5’ end beginning site of the second exon. The whole intron between the
two exons is cut off and released as a lariat and the two exons are jointed together to form
the spliceosome assembly process. The ATPase and helicase activities of p68 are
required for the dissociation of U1 snRNA from the 5’ slice site, which indicates that p68
RNA helicase might play roles in unwinding U1 snRNA and 5’ splicing site complex.
p68 RNA helicase might have functions in the formation of the spliceosome with the
adding of U4/U6 and U5 snRNPs, which does not require the ATPase and helicase
activities of p68 (Lin, Yang et al. 2005). As an RNA helicase, p68 is required for
microRNA duplex unwinding, which is required for the unwinding of the transient RNA
duplex to single stranded RNA, to take into the Argonaute protein to perform its
silencing activity (Salzman, Shubert-Coleman et al. 2007). p68 RNA helicase plays
important roles in early organ development and maturation. In mouse embryonic
fibroblasts, the lack of p68 is related to the depression of many microRNAs (Salzman,
Shubert-Coleman et al. 2007).
In the nucleus, p68 RNA helicase interacts with many other proteins to regulate its
gene transcription as a co-activator (Warner, Bhattacherjee et al. 2004; Fuller-Pace,
Jacobs et al. 2007). p68 interacts with p53 through the C-terminal region of p53 to
regulate p53 downstream targeting genes, such as p21, Fas, PIG3 and mdm2 (Bates,
Nicol et al. 2005). p68 RNA helicase is reported to be recruited to pS2 gene promoter, a
downstream target of estrogen receptor alpha (ERα), to regulate its transcription
(Watanabe, Yanagisawa et al. 2001). In these studies, neither the ATPase activity nor the
RNA helicase activity of p68 is required for its co-activator function. p68 also interacts
with CBP through the C-terminal of CBP to enhance CBP-mediated transcription
(Rossow and Janknecht 2003). p68 RNA helicase interacts with Smad3, specifically the
Bhattacherjee et al. 2004). Recently it is reported that p68 RNA helicase interacts with
the androgen receptor (AR) in the nucleus and regulate gene transcription as a
co-activator for androgen-dependent and androgen-independent prostatic malignancy (Clark,
Coulson et al. 2008).
There are many post-translational modifications of p68 RNA helicase in
mammalian cells, such as sumoylation, polyubiquitylation and phosphorylation. p68 was
first reported to be polyubiquitylated in colorectal cells (Causevic, Hislop et al. 2001).
Sumoylation is found at a single site of p68, Lysine 53, which is enhanced by PIAS1
(protein inhibitor of activated STAT1) (Jacobs, Nicol et al. 2007). The sumoylated p68
co-represses gene transcription through interacting with HDAC1 for p300 and Elk1
(Ets-like kinase 1) (Jacobs, Nicol et al. 2007). Recombinant p68 RNA helicase purified from
E.Coli, is phosphorylated at Serine, threonine and Tyrosine residues (Yang and Liu
2004). In many cancer cells, p68 is phosphorylated at Tyrosine residues but not in their
corresponding normal cell lines (Yang, Lin et al. 2005). p68 is phosphorylated at the
Tyrosine 593 residue under the stimulation of PDGF-β in colorectal cells. The Tyrosine
phosphorylated p68 blocks the phosphorylation of β-catenin by GSK-3β and displaces
Axin from β-catenin distruction complex. The released β-catenine is shuttled into the
nucleus by p68 RNA helicase which interacts with the LEF/TCF site to regulate gene
expressions, which are required for EMT process (Yang, Lin et al. 2006). p68 is also
double phosphorylated at Tyrosine 593 and Tyrosine 595 residues in T98G glioblastoma
cells as well as HeLa cells. The double phosphorylation of p68 facilitates its apoptosis
helicase protects T98G cells from caspase-8 activation to trigger apoptosis (Yang, Lin et
al. 2007).
Immunohistochemical examination shows p68 RNA helicase is dominantly
localized in the nucleus in mammalian cells. p68 is detected in the cytosol depending on
the cell cycle (Yang, Lin et al. 2007). Under the stimulation of growth factors, such as
EGF, PDGF, some p68 comes out of the nucleus into the cytosol. According to the
sequence analysis, there are many putative NES and NLS signals in p68. Two NES and
two NLS functional signals are discovered in p68 RNA helicase sequence. Interestingly,
the shuttling capability of p68 RNA helicase is not dependent on its ATPase activity. The
nucleocytoplasmic shuttling function of p68 is CRM-1 dependent.
1.6 MEK5 and MAP Kinase Pathway
1.6.1 MAPK Family Members and Their Biological Functions
The mitogen-activated protein kinase (MAPK) family is an important kinase
family in mammalian cells, consisting of four subfamilies: extracellular-regulated protein
kinase1 and 2 (ERK1/2), ERK5, c-jun NH2-terminal protein kinases (JNK), and p38
MAPKs (Graves, Campbell et al. 1995; Seger and Krebs 1995; Attar, Atten et al. 1996;
Hu and Plaxton 1996). The biological functions of MAPK pathways are diverse, playing
roles in many cellular processes. In general, ERK subfamilies are related to cell growth,
proliferation and survival, induced by growth factor stimulations. JNK and p38 MAPKs
are associated with inflammation, apoptosis, cell growth and differentiation induced by
Hardwick, van den Brink et al. 2001; Papatsoris and Papavassiliou 2001; Saldeen, Lee et
al. 2001).
All the MAPK family members are activated by phosphorylation at Threonine and
Tyrosine residues within the activation loop TxY of kinase subdomain VIII by diverse
activators: mitogen-activated protein kinase kinase (MEK1) and MEK2 for ERK1/2,
MEK5 for ERK5, MKK4 and MKK7 for JNKs, MKK3 and MKK6 for p38 MAPKs
(Graves, Campbell et al. 1995). The x in the TxY motif of the kinase subdomain VIII is
diverse in MAPKs. For example, x is proline in JNK, glutamate in ERK, glycine in p38
MAP kinases. MEKs are activated by an upstream activator, MEK kinase. There are
many MEK kinases that activate MEKs: Raf-1, A-Raf, B-Raf, c-Raf, Mos, Tpl2 are for
MEK1 and MEK2; MEKK1, MEKK2, MEKK3, Tpl2 are for MEK5; PAK is for MKK3
and MKK6; MEKK4 and DLK are for MKK4 and MKK7. Cross-talk is always occurring
among these MAPK signaling pathways. In addition, some activators are involved in
more than one MAPK pathway. For example: the activators for MEK5 can also activate
MEK1 and MEK2. In general, MAPK cascade members use docking interactions to
regulate the efficiency and specificity between upstream activators and downstream
substrates (Hu, Shen et al. 2007). In MAP2ks, such as MKK6, the docking domains are
located at the N-terminal or C-terminal to bind its activator, MAP3Ks. The docking
domain of MEK5, consisting of amino acids sequence, EYEDEDGD, is located in its
N-terminus which interacts with its upstream regulator, MEKK2 or its downstream
substrate, ERK5 (Seyfried, Wang et al. 2005). For MAPKs, such as ERK2, the docking
domain is located in both the N- and C-terminals. ERK2 has a CD domain (common
C-terminal region just after its kinase domain. ERK2 also has a docking domain named
the ED site, which is located at its N-terminal region in front of its kinase domain.
MAPK substrates have docking domains for their regulation by MAPK. C-Jun has a D
domain to interact with its activator, JNK. c-Fos has DEF (docking site for ERK or FX)
domain in its C-terminal region to interact with ERK. Some ERK substrates have both D
domain and DEF domain to interact with their activators, such as JNK and ERK. In
addition, some MAPK cascades use scaffold proteins to assemble functional MAPK
modules to increase the interaction specificity. For example, JIP-1, a scaffold protein in
the JNK pathway, contains a D domain to bind JNK (Dickens, Rogers et al. 1997)
On the other hand, the activation of MAPK is negatively controlled by MAPK
phosphatase activity. Any dephosphorylation at either Threonine or Tyrosine residues in
TxY motif inactivates MAPK. The dephosphorylation and inactivation process in the
activation loop in MAPK last from minutes to hours depending on cell type and stimuli.
Serine/Threonine protein phosphotases, such as PP2A, a member from the PPP family,
inactivates ERKs. Members of Tyrosine protein phosphotase, such as PTP-SL, STEP,
and HePTP, also dephosphorylate and inactivate ERKs. MAPK phosphatase plays
important roles in diverse biological functions. For example, the JNK phosphatase
family, the puckered mutation leads to cytoskeletal defects resulting in dorsal closure
during Drosophola embryogensis. Interestingly, a subclass of the tyrosine phosphotase
family called dual specificity phosphatase (DSP) dephosphorylate both tyrosine and
threonine residues to inactivate MAPKs (Camps, Nichols et al. 2000). There are nine
members identified in DSP family, such as CL100/MKP-1, PAC1, hVH-2/MKP-2,
hVH3/B23, hVH-5 are expressed exclusively in the nucleus and MKP-3/PYST1 is
expressed in the cytosol. MKP-4 is expressed in both the cytosol and the nucleus.
1.6.2 ERK5-MEK5 Signal Pathway
Extracellular signal-regulated kinase 5 (ERK5), which is also named big-MAPK or
BMK1, is one of the important MAPK family members, and it is activated through a
cascade of signal transduction by MAP3Ks (MEKK2/3 and Cot), MEK5 and ERK5.
ERK5 activation is exclusively activated by MEK5. The MEK5 signal pathway was first
discovered in 1995 by Dixon and co-workers with a yeast two-hybrid screen experiment.
ERK5 was used as the bait to interact with MEK5. ERK5-MEK5 signal pathway plays
important roles in cell growth, cell differentiation, neuronal survival and embryonic
angiogenesis (Sohn, Sarvis et al. 2002; Wang, Merritt et al. 2005). There are many
transcription factors that can be phosphorylated by ERK5, such as c-Myc, MEF2 family
members and c-Fos (Kamakura, Moriguchi et al. 1999) (Yang, Ornatsky et al. 1998).
ERK5 has two splicing variants, ERK5 and ERK5b. ERK5b is shorter in the N-terminal
compared with ERK5. ERK5b is a naturally dominant negative mutant which regulates
ERK5 kinase activity. Overexpression of ERK5b inhibits ERK5b kinase function on
nuclear substrate, such as MEF2C.
The MEK5 gene codes a 444 amino acids protein, which has two splicing variants,
MEK5a and MEK5b (English, Vanderbilt et al. 1995; Chao, Hayashi et al. 1999).
MEK5a is a protein with 89 amino acids longer than MEK5b at the N-terminal.
Both of MEK5a and MEK5b can individually interact with ERK5. Double
nuclear translocation, but not MEK5b (Kato et al., 1997). MEK5a directly interacts and
stimulates ERK5 kinase activity by phosphorylating threonine and Tyrosine residues in
the TxY motif. On the other hand the overexpression of MEK5b disrupts the interaction
of MEK5a with ERK5, which indicates MEK5b is a putative dominant negative mutant
which regulates MEK5a kinase function to activate ERK5.
The expression and cellular localization of MEK5a and MEK5b are tissue specific
(English, Vanderbilt et al. 1995). MEK5a is localized dominantly in the cytosol and
MEK5b is distributed evenly in the whole cell. MEK5a expression is abundant in actively
mitotic tissues, such as liver and brain (English, Vanderbilt et al. 1995). MEK5b has
more expression than MEK5a in differentiated tissues, such as muscle, lung, kidney et al.
Many studies showed the expression of MEK5 is closely related with
tumorigenesis. MEK5 is overexpressed in human prostate cancer cells as detected by
antibodies that recognize the specific N-terminal of MEK5a (Mehta, Jenkins et al. 2003).
Immunohistostaining results also show that MEK5 is overexpressed in human prostate
cancer but not in benign prostate tissues (Mehta, Jenkins et al. 2003). Moreover, the
expression level of MEK5 in malignant prostate cancer is correlated with its bone
metastases (Mehta, Jenkins et al. 2003). Patients with higher expression of MEK5 had a
shorter disease-specific survival time (52 months) compared to those with weaker MEK5
expression which survived in 58 months. The activation of MEK5 induces prostate
cancer cell proliferation. The overexpression of a constitutively active MEK5 mutant
(MEK5D) in LNCaP cells, a metastatic prostatic adenocarcinoma cell line derived from
the lymph node, induces a 3.7 fold higher cell proliferation compared to control vectors.