Effect of Adding Banana Cell Wall to Fat-Reduced
Shortbread Cookie on Dough Hardness and Toughness
Aida Safina Aridi
School of Food Science and Nutrition, University of Leeds *Corresponding Author: [email protected]
Copyright © 2014 Horizon Research Publishing All rights reserved.
Abstract
The effect of banana cell wall on dough hardness and toughness with 10% fat reduction was investigated. Alcohol insoluble solids containing cell wall (AIS) was prepared from ripe bananas using hot ethanol extraction. Analysis of AIS for monosaccharide composition showed that it contains fucose, rhamnose, arabinose, galactose, glucose, maltose, xylose and mannose, galacturonic acid and glucuronic acid. Changes in hardness and toughness of the dough were analysed using a texture analyser. As the fat content decreased by 10%, the dough hardness was increased to 52.63 N ± 6.33 compared to control (31.29 N ± 2.34). However, the dough hardness was then reduced to 28.36 N ± 3.11 when 0.5 g of banana AIS was added to the dough and this indicates that banana AIS helps to reduce the hardness caused by fat reduction. Similar results were obtained for dough toughness. The addition of banana AIS decreased toughness to 48.16N.sec ±7.54 from 79.99N.sec ± 1.85 in fat reduced dough. In conclusion, banana cell wall has beneficial effects on dough rheology in fat reduced cookie dough.
Keywords
Banana Cell Wall, Dough Rheology, Low Fat Cookies1. Introduction
Consumers are more aware about the fat content in their food. Not long ago the terms ‘low-fat’ or ‘reduced-calorie’ would not have been applied to sweet bakery products. Today, these types of products are becoming well known to the consumers as more and more bakery products are offering ‘healthier’ choices. Research by the Calorie Control Council in January 1991 showed that consumers tend to choose low-calorie food for the reason to stay healthy followed by maintaining current weight. In the research, only 43% of the respondents indicated taste as the reason for using light foods (Brandt and Antenucci, 1993). Satisfying taste is always a main key for overall product acceptance. Despite these problems, fat and sugar cannot be easily replaced, especially in a complex food system such as biscuits.
Shortbread cookies are soft type biscuits whose textural characteristics are mostly provided by their high fat content. Fat provides flavour and mouthfeel, contributes to appearance, palatability, texture and lubricity (Zouliaset al., 2002).
Therefore, it is important to make sure the taste is not changed although certain amount of fat has been reduced from the ingredient. Cookies are made from soft wheat flour and are characterized by formula high in sugar and shortening. The basic ingredients used to make cookies are 3 parts of flour, 1 part of sugar and 2 parts of fat or shortening. Khatkar(2006) stated fat or shortening is responsible to reduce the toughness of dough. As gluten network does not form until the flour is in contact with water and mixing action, the inclusion of fat tends to insulate the gluten forming proteins from the water and as a result, less gluten will be produced which is ideally suited for cookie making. As cookies must contain high amount of fat in order to produce good quality, it become a big challenge to food industry to come out with the right formulation. The fat content must be reduce and at the same time the cookies produced must have good quality equivalent as the original formulation. One way to overcome this problem is by using fat replacer. Jones and Jonnalagadda(2006) stated that fat replacers must replicate some of the functional properties of fat such as create creamy mouth feel and tender texture. In fact, they must lower the fat and calorie content of the food. There are three types of fat replacers on the market, that is carbohydrate-based, protein-based and fat-based fat replacers. In this research, banana cell wall (carbohydrate-rich) will be extracted and used as the fat replacer.
Banana is easily ripe and it becomes a huge waste to the food industry. In order to reduce this type of waste, this research aim to investigate the usage of banana cell wall as carbohydrate-based fat replacer in shortbread cookie dough.
Banana is monocotyledon and belongs to the family Musaceae. It is estimated that as many as 100 million people consume banana as their main energy anddietary source (Rowe, 1981). This fruit is classified as a berry, and plant of the tropical humid lowlands. Wild-seeded diploid forms of
Malaysian area (Seymour, 1993). In Malaysia, banana is the second most widely cultivated fruit after durian. Most of the bananas produced are consumed locally and about 10% are exported, mainly to Singapore, Brunei and Middle East (Molina et al., 2003).
Softening in fruits appears to be closely related with changes in their cell wall structure. In bananas, the changes in texture of the fruit during ripening possibly result from alteration in both cell wall structure and degradation of starch.
The objective of this work was to study the effect of addition of banana AIS into hardness and toughness of fat-reduced shortbread cookies dough using texture analyser. The experiment started with preparation of banana AIS using hot alcohol extraction and then characterization of AIS using High Performance Anion Exchange Chromatography with Pulsed Amperometric Detection (HPAEC-PAD) that separates carbohydrates via specific interactions between the hydroxyl groups of the glycan and the stationary phase of the column at high pH. Once the banana AIS was characterised, it was added to cookie dough and the mechanical properties was evaluated.
2. Experimental
2.1. Chemicals
Ethanol, trifluroacetic acid (TFA) and ascorbic acid from SIGMA-ALDRICH used in this study were obtained from Food Laboratory University of Leeds.
2.2. Banana.
The fruits were purchased at a local supermarket and were stored at room temperature before the analysis. All fruits used were fully ripe (nearly all black skin) before use.
2.3. Microscopy Analysis
The cells for microscopic analysis were harvested by smearing a little (less than the size of a sesame seed) of fresh banana and AIS on microscope slide to rub the cells apart in the presence of a drop of water. They were observed under light microscope with 10x magnification and iodinelugol solution was added to observe starch in the banana cell.
2.4. Preparation of Alcohol Insoluble Solids (AIS)
Hot insoluble solids were prepared according to Renard et al. 1990 with slightly changes. The fresh bananas were weighed and cut into small pieces. 30ml of distilled water was added and then the bananas were homogenized for 5 minutes. For sample 2, 5 mg of ascorbic acid was added to avoid browning of the banana. Then, 70ml of ethanol were added into both samples and then incubated at 80○C for 20 minutes in order to inactivate possible endogenous enzymes
and remove alcohol-soluble solids. The solution was filtered through filter paper, and the solids were washed four rimes with 50 ml of 96% ethanol. The alcohol insoluble solids (AIS) produced were then dried at 40○C until the weights were constant.
2.5. Hydrolysis of Polysaccharide
Both samples were hydrolysed in 2M TFA for 1 hour at 100○C (Øbroet al., 2004).TFA was removed by evaporation under vacuum (evaporation repeated three times).
2.6. High Performance Anion Exchange
Chromatography with Pulsed Amperometric Detection (HPAEC-PAD)
Nine cell wall monosaccharides were determined by HPAEC-PAD of hydrolysed material. Chromatography was on a PA20 column (dionex) at flowrate of 0.5 ml/min. Before injection, the column was washed with 200mMNaOH for 20 minutes and then equilibrated with 1M NaOH for another 20 minutes. AIS hydrolysed was prepared in 1/50 dilution in water and the analysis was begin with distilled water. Each sample was run for 45 minutes in order to separate the cell wall monosaccharides.
2.7. Preparation of Shortbread Cookie Dough
All ingredients needed for cookie dough were bought at local supermarkets. The cookie formulation consisted of wheat flour 36 g, sugar 11g and butter 25 g. For the preparation of low fat cookie dough, the fat formulation was reduced by 10% To study the effect of banana AIS into rheology of dough, 0.5 g of banana AIS was added into samples C, D, F and G. In order to study the effect of sugar and flour into dough hardness and toughness, the amount of sugar and flour were also varied (see Table 1). Butter and sugar was creamed for 5 minutes and after that flour (+/- banana AIS) was added and continued creaming for another 2 minutes to get the shortbread cookie dough. The dough was then cut into small pieces (11g each pieces) and shaped into a round ball.
2.8 Analysis of Dough
Dough hardness and toughness of seven dough samples were tested byTAXT2i Texture Analyser. The sample dough was analysed for compression test mode at speed of 5 mm/sec. The target mode was distance (20 mm) and trigger type was auto (force) and the plot will stop at target position. The probe used was Ottawa Cell (each samples were prepared triplicate).
2.9. Statistical Analysis
used to investigate if there is a significant different in peak force and peak area between control dough and other samples. The significant level was established at p ≤ 0.05. The hypotheses tested stated as below
Dough Hardness
H0 = There is no significant difference in peak force
between control and other sample.
H1 =There is a significant difference in peak force
between control and other sample.
Dough Toughness
H0 = There is no significant difference in peak area
between control and other sample.
H1 =There is a significant difference in peak area between
[image:3.595.58.300.265.411.2]control and other sample.
Table 1. Composition of ingredients in each sample
Samples Weight of butter (g) Weight of sugar (g) Weight of flour (g) Weight of AIS (g)
Control(A) 25.0 11 36 0
B 22.5 13 36 0
C 22.5 13 36 0.5
D 22.5 13 36 0.5
E 22.5 11 38 0
F 22.5 11 38 0.5
G 22.5 11 38 0.5
3. Results and Discussion
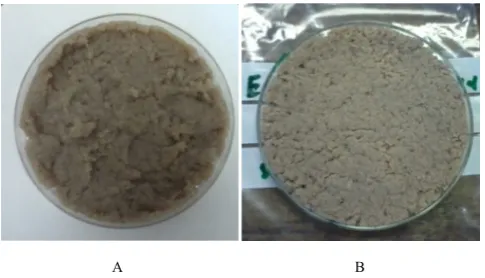
Banana AIS was prepared with or without the presence of ascorbic acid. The AIS without ascorbic acid had a darker colour, while the AIS with ascorbic acid had a lighter brown colour (Figure 1).
A B
Figure 1. (A) Banana AIS (without ascorbic acid) and (B) (with ascorbic
acid) from hot alcohol extraction using 70% of fresh ethanol.
3.1. Microscopic Analysis
From figure 2(A), it can be observed that fresh banana cell
had a round long shape and small starch granules were visible after staining with iodine. Banana contains certain amount of starch but as it is ripe, that amount usually decreases. During harvesting, the starch breakdown is slow at first and then speeds up as the climacteric peak is attained, with storage conditions having a strong effect on the rate of breakdown. In figure 2(B), as the banana AIS was stained with iodine, the presence of starch granules was observed. The starch granules were swelled up as the banana AIS had been heated at 80○C. At this temperature, starch should become gelatinized. Gelatinization of starch is defined as a process that occurs in the presence of heat and water when starch undergoes a transition process, during which the granule breaks down into a mixture of polymer-in-solution (Ratnayake and Jackson, 2009). However, since during AIS preparation, the amount of water in the solution was only 30% and another 70% was ethanol so it can be said that starch was not fully gelatinized since the amount of water present was limited.
[image:3.595.309.555.312.426.2]A B
Figure 2. (A) Fresh banana cell and (B) banana AIS under light
microscope at 10x magnification staining with iodine.
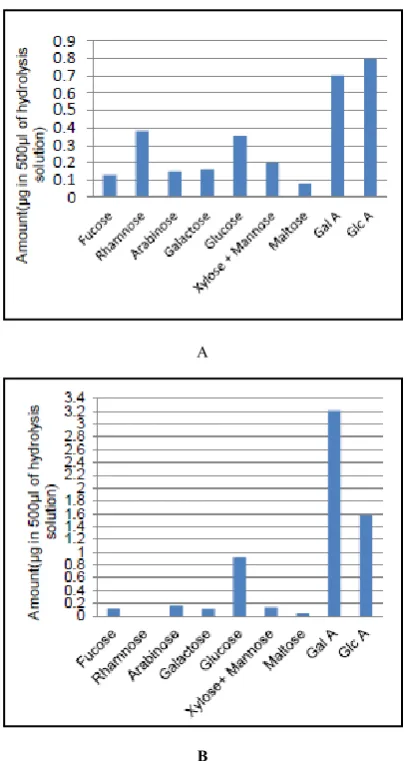
3.2. Monosaccharide Composition
[image:3.595.58.301.511.650.2]A
[image:4.595.76.280.72.453.2]B
Figure 3. Cell wall monosaccharide composition in (A) banana AIS
(sample 1) and (B) banana AIS with ascorbic acid (sample 2) expressed as
μg in 500 μl of hydrolysis solution.
3.3. Cookie Dough Analysis
Shortbread cookie is classified as soft wheat products. Szczesniak (1963) stated that textural characteristics can be grouped into mechanical, geometrical and those related to fat and moisture content. Rheology is defined as mechanical response of the food to applied stress or strain. The stress or strain can be applied by bending, compressing, tearing, biting and also swallowing. In this project, dough hardness and toughness were measure by texture analyser using Ottawa Cells as the probe. Peak force in this project represents the hardness of the cookie dough and peak area will represents the toughness of dough. From figure 4 (A), measurement of dough hardness by texture analyser showed sample B has the highest peak force while sample C showed the lowest. As the fat content in cookie dough was reduced to 10% in sample B, the dough becomes harder compared to the sample A (control). Fat contribute many functions in cookies such as to develop and mould texture, mouth feel and overall sensation of lubricity of the product (Giese, 1996). In fact, fat also influences the rheological properties of cookie dough
(Jissy and Leelavathi, 2007).Sudha et al. (2006) reports that increased in dough hardness when fat in the biscuit formulation was reduced. But, as the banana AIS was added into the dough, the peak force was reduced 46% from 52.63 N in sample B to 28.36 N in sample C and this value was 9.35% lower compared to sample A (control). This value indicates that addition of banana AIS help to reduce the dough hardness.
From figure 4 (B), dough toughness was increased as the fat content in dough was decreased. But, for sample C and D, the dough toughness was decreased although the amount of fat had been reduced by 10% and this is probably because sample C contain 0.5 mg of banana AIS. This showed that, banana AIS do help to reduce the dough toughness to levels almost similar with the control. However, in sample F and G, although both samples contain 0.5 g of banana AIS but still the peak area for both samples were increased. Research by Gallager et al. (2001) showed that sugar inhibits gluten development during dough mixing by competing with flour for the water, which results in less tough and more crumby biscuits. So, this explaining why samples F and G produced high peak area compared to samples C and D.
A
[image:4.595.326.535.345.671.2]B
Figure 4. Bars show average of triplicate analysis (A) Effect of fat
reduction in different dough on peak force. (B) Effect of fat reduction in different dough on peak area.
3.4. Statistical Analysis
role in the bakery industry. In order to investigate the effect of sugar and flour to dough rheology, a statistical analysis using t-test assuming equal variance were used. A t-test compares two samples of test data. The data obtained from texture analysis will be evaluated and check for significance by inspecting the p-value. Table 2represents the p value from t test analysis assuming equal variance on peak force of all dough samples. Ingredients influence rheological behaviour of dough. The effect of adding sugar, flour and banana AIS on dough toughness and hardness of dough are investigated and discussed using t test.
[image:5.595.313.553.167.291.2]Firstly, the hypothesis was being tested whether there was a significance difference in peak force between sample A (control) with other dough sample. The null hypothesis (H○) will be accepted if the p value is ≥ 0.05. From table 2, the highlighted data showed the p value which is less than 0.05. From Table 2, p value for sample A and sample B was 0.0054 and ≤ 0.05 so null hypothesis was rejected and this showed that there is a significant difference in peak force between sample A and sample B with 10% reduced fat. Then, the p value between sample A and sample C was 0.2630 and it is ≥0.05 so null hypothesis was accepted. There is no significant difference in peak force between sample A (control) and sample C with addition of 0.5g of banana AIS. This is a positive result which indicates that addition of banana AIS help to maintain the same dough hardness as in control. However, since sugar composition was increased by18.18% in sample B, C and D this might affect the hardness of dough as well. Sugar causes softening of the dough, due to competition between added sugar and the availability of water in the system. The limited amount of water used in biscuit formulation partially contributes to the crispiness of biscuits. The effect of sugar level and type on rheological properties of biscuit dough was determined by Manohar and Rao (1997). Increasing sugar content decreased extrusion time, consistency and hardness of biscuit dough.
Table 2. p value for t test (two sample assuming ≥equal variances) to compare significant difference on peak force at p≤ 0.05
B C D E F G
A 0.0054 0.2630 0.0390 0.0980 0.8480 0.8940
B - 0.0040 0.0180 0.0188 0.3680 0.3530
C - - 0.0180 0.0396 0.7277 0.7742
D - - - 0.7740 0.8892 0.8486
E - - - - 0.9231 0.8815
F - - - - - 0.9685
G - - - - - -
Besides that, sample E, F and G showed p value ≥ 0.05 which indicates that there is no significant difference in peak force although the amount of flour used was increased by 5.56%. This value demonstrates that banana AIS help to maintain the dough hardness although the amount of flour had been increased.
Second row in Table 2 showed p value between sample B
and other samples. Sample C and D have p value less than 0.05 so null hypotheses were rejected. There is a significance difference in peak force between sample B (10% of fat had been reduced) with sample C and D which contain 0.5g of banana AIS.
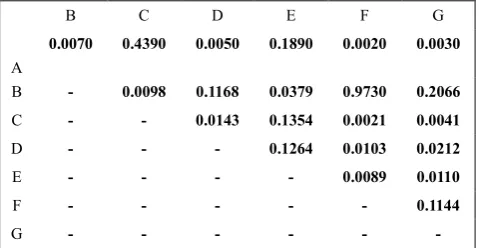
Table 3. p value for t test (two sample assuming equal variance) to
compare significant difference on peak area at p≤ 0.05
B C D E F G
A
0.0070 0.4390 0.0050 0.1890 0.0020 0.0030
B - 0.0098 0.1168 0.0379 0.9730 0.2066
C - - 0.0143 0.1354 0.0021 0.0041
D - - - 0.1264 0.0103 0.0212
E - - - - 0.0089 0.0110
F - - - - - 0.1144
G - - - - - -
Dough toughness is also one of the important rheology properties in baking industry. Table 3 shows p value from t test analysis to determine if there is a significant difference in peak area between all six samples and the control. Peak area represents the toughness of shortbread cookie dough. From Table 3, the highlighted showed the p value from t-test analysis. From table 3, only sample C and sample E have p
value ≥0.05 so null hypotesis was accepted. There is no
significance difference in peak area between sample A (control) and sample C and E. As the fat content had been reduced by 10% in all dough except sample A, the dough toughness had been changed significantly. Fat is an essential ingredient in biscuit and is the largest component after flour and sugar. It performs shortening and textural function in biscuits. During mixing, fat acts as a lubricant and also competes with the aqueous phase for the flour surface and prevents the formation of gluten network in the dough. Sample C contains 0.5g of banana AIS and there is no significant difference in peak area between sample C and sample A (control) so this indicates that banana AIS does help to maintain the doughness even though the fat content had been reduced. While in sample E, although that sample does not contain banana AIS but still no significant difference in peak area with the control because of the increase in flour content by 5.56%. As a result, more gluten network can be formed so the dough toughness is almost the same with the control.
The reduction of fat in cookie dough does affect the hardness and toughness of the dough. However, addition of banana AIS showed improvement in dough rheology by maintaining the hardness and toughness similar with the control. Among the samples used, sample C is probably the best sample that represents the effect of addition banana cell wall as the fat replacer in cookie dough.
[image:5.595.60.295.552.662.2]in order to determine optimize recipe so that the fat-reduced cookies have the similar taste and texture as cookies produced from the original recipe.
Acknowledgements
I would like to thank the School of Food Science at the University of Leeds for the use of equipment, and in particular Caroline Orfila and PhD students ; Jin, Sarah and Regiane for their guidance on this project.
REFERENCES
[1] BARNDT, R. L. and R. T. ANTENUCCI.1993. Fat and calorie-modified bakery products. In: R. Khan, ed. Low-calorie foods and food ingredients. Glasgow: Chapman & Hall, pp. 106-107.
[2] CATHERINE, M. G. C.2005. Variability in cell wall preparations: quantification and comparison of common methods. Carbohydrate Polymers. 60, pp. 515-522.
[3] GALLAGHER, E., C.M. O’BRIEN, A. G. M. SCANENELL, and E.K. ARENDT.2001. Evaluation of sugar replacers in short dough biscuit production. Journal of Food Engineering. 56, pp. 261-26.
[4] GISSE, J. 1996. Fats and fat replacers, balancing the health benefits. Food Technology. 50, pp. 76-78.
[5] ØBRO, J., J. HARHOLT, H. V. SCHELLER and C. ORFILA. 2004. Rhamnogalacturonan I in Solanumtuberosumtubers contains complex arabinogalactan structures. Phytochemistry. 65, pp. 1429-1438.
[6] JISSY, J., and K. LEELAVATHI.2007. Effect of fat-type on cookie dough and cookie quality. Journal of Food Engineering. 79, pp. 299-305.
[7] JONES, J. M., S.S.JONNALAGADDA.2006. The use of fat
replacers for weight loss and control. In: C. WILLIAMS AND J. BUTTRISS, ed. Improving the fat content of foods. Cambridge: Woodhead Publishing Limited, pp. 380-390. [8] KHATKAR, B.S. 2006. Classification and processing
technology of biscuits. Post Graduate Diploma in Bakery Science and Technology. thesis, University of Science and Technology Hisar.
[9] MANNOHAR, R. S. and P.H. RAO. 1997. Effect of sugars on rhelogical characteristics of biscuit dough and the quality of biscuits. European Food Research and Technology.210, pp. 43-48.
[10] MOLINA, A.B., EUSEBIO, J.E., ROA, V.N., VAN DEN BERGH, I. and MAGHUYOP, M. A. G. 2003. Advancing banana and plantain R&D in asia and the pacific. Proceedings of the 2ndBapnet Steering Committee Meeting. Jakarta. 12.
[11] RATNAYAKE, W.S. and D.S. JACKSON.2009. Starch gelatinization. Adv Food Nutr Res. 55, pp.221.
[12] ROWE, P. 1981. Breeding an ‘intractable’ crop: bananas. In Genetic Engineering for Crop Improvement. Working Papers, The Rockefeller Foundation, New York.
[13] SEYMOUR, G. B. 1993. Banana. In:G. B. SEYMOUR, J. E. TAYLOR and G.A. TUCKER, ed. Biochemistry of fruit ripening. London: Chapman & Hall, pp. 83-94.
[14] SMITH, N. J. S. 1989. Textural and biochemical changes during ripening of bananas. Ph. D Thesis, University of Nottingham, UK.
[15] SZCZESNIAK, A.S.1963. Classification of textural characteristics. J. Food Sci. 28, pp. 385-389.
[16] SUDHA, M. K., A. K. SRIVASTAVA, R. VETRIMANI and K. LEELAVATHI. 2007. Fat replacement in soft dough biscuits:its implications on dough rheology and biscuit quality. Journal of Food Engineering. 80, pp. 922-930. [17] ZOULIAS, E.I., V. OREOOULO, and E. KOUNALAKI.