Procedia Engineering 53 ( 2013 ) 337 – 346
1877-7058 © 2013 The Authors. Published by Elsevier Ltd.
Selection and peer-review under responsibility of the Research Management & Innovation Centre, Universiti Malaysia Perlis doi: 10.1016/j.proeng.2013.02.044
Malaysian Technical Universities Conference on Engineering & Technology 2012, MUCET 2012
Part 3 - Civil and Chemical Engineering
Development of Optimum Controller based on MPPT for Photovoltaic
System during Shading Condition
Abd Kadir Mahammadª
,*, Sharifah Saonª and Wong Swee Chee
a ªDepartment of Electrical and Electronic EngineeringUniversiti Tun Hussein Onn Malaysia 86400 Parit Raja, Batu Pahat, Johor, MALAYSIA
Abstract
The output powers of photovoltaic (PV) system are crucially depending of the two variable factors, which are the cell temperatures and solar irradiances. A method to utilize effectively the PV is known as a maximum power point tracking (MPPT) method. This method is extract the maximum available power from PV module by making them operates at the most efficient output. This paper presents two controllers to control the MPPT which are conventional proportional integral derivative (PID) and Fuzzy Logic. In particular, the performances of the controllers are analyzed in these four conditions with are constant irradiation and temperature, constant irradiation and variable temperature, constant temperature and variable irradiation and variable temperature and irradiation. The proposed system is simulated by using MATLAB-SIMULINK. According tothe results, PID controller has shown better performance during partially shaded conditions.
© 2013 The Authors. Published by Elsevier Ltd.
Selection and/or peer-review under responsibility of the Research Management & Innovation Centre, Universiti Malaysia Perlis.
Keywords: Solar photovoltaic; MPPT; PID; fuzzy logic
.
1.Introduction
PV power generation systems have intensively been investigated as an environment-friendly technology since 1970s because of their advantages of infinite energy resources and no carbon dioxide (CO2) emission [1]. Furthermore, it is crucial
to operate PV energy conversion systems near maximum power point (MPP) to increase the output efficiency of PV [2]. Nevertheless to obtain the MPP required a method to let the controller operate at the mentioned optimum operating point. Hence, many tracking control technique have been developed and implemented. The most common techniques that has been used such as Hill-Climbing/Perturb and Observe, constant voltage, neural network and fuzzy logic [3]-[4]. At the same time, these techniques have some drawback such as fail performance due to partially shaded irradiance conditions, costly and complexity.
The primary purpose of this project is to design the optimum controller based maximum power point tracking control of uce the maximum power point tracking in certain time especially during shading condition. Since, partial shading has been identified as a main cause for reducing energy yield of many PV systems.
Partial shadowing has been identified as a main cause for reducing energy yield of photovoltaic systems. There have many reason lead to the PV array had be shaded. For instance, other building, trees, chimneys and the dust or dirt on the
* Corresponding author. E-mail address: [email protected]
Available online at www.sciencedirect.com
© 2013 The Authors. Published by Elsevier Ltd.
-uniform irradiance is cloudy day. This factor is unavoidable issue. During the cloudy day, the non-uniform insolations lead to more complicated current-voltage (I V) and power-voltage (P V) with multiples local MPP. Hence, under these conditions, the MPPT controller hard to pick the MPP.
During the partially shaded conditions, the shaded cells or modules will try to constrain output current of non-shaded PV cell to be low following the output current of non-shaded PV modules. Accordingly, the output power of PV modules is remarkably dropped because of the mismatching of current-voltage characteristic of PV modules. The controller also is hard to look for the MPP due to multiple MPP appear during partially shaded conditions. Consequently, it is essentially to develop a suitable MPPT controller to solve this issue.
The techniques used to design the controller are by using conventional PID and fuzzy logic. A PID controller is a controller that includes elements of proportional, integral and derivative. Whereas fuzzy logic controller (FLC) based on fuzzy logic (FL) provides a mean of converting a linguistic control strategy based on expert knowledge into an automatic strategy [4]. To achieve the objective of this project, MATLAB/SIMULINK software is used to analysis the MPPT for PV system.
To sum up, this project is to analyze and compares the simulation result of two intelligent systems which are PID controller and Fuzzy Logic Controller.
2.Literature Review
[image:2.544.150.390.345.673.2]There are several journal and conferences have been analyzed which are ANN Based Optimal Operating Points of PV Array under Partially Shaded Condition by Syafaruddin and HIYAMA, Artificial Intelligence Based P&O MPPT Method for Photovoltaic Systems by B. Amrouche, M. Belhamel and A. Guessoum, Improvement of A MPPT Algorithm for PV Systems and Its Experimental Validation by A.J Mahdi, W.H Tang and Q.H Wu, Maximum Power Point Genetic Identification Function for Photovoltaic System by Adel El Shahat and Robust maximum power point tracking method for photovoltaic cells by Chen-Chi Chu and, Chieh-Li Chen. The methodology and the results of the journals are shown in Table 1.
Title Authors Methodologies Results
ANN based Optimal Operating Points of PV Array under Partially Shaded Condition [5]
Syafaruddin and
HIYAMA Artificial Neural Network (ANN) The trained ANN is sufficiently accurate in mapping between a partial shading condition and optimum power and voltage for SP, BL and TCT connections of PV array Artificial Intelligence based P&O MPPT Method for Photovoltaic System [6] B. Amrouche, M. Belhamel and A. Guessoum
A New Modified Artificial Intelligence based Perturbation and Observation Method (MP&O) The improved tracking performance of the Artificial Intelligence based P&O MPPT method was successful and proven trough simulation Improvement of a MPPT Algorithm for PV Systems and its Experimental Validation [7]
J. Mahdi, W. H. Tang and Q. H. Wu Improved maximum power point tracking (MPPT) algorithm based on the perturbation and observation (P&O) strategy The proposed MPPT algorithm is accurate which has a fast dynamic response under rapid solar irradiance variations Maximum Power Point
Adel El Shahat Genetic Algorithm and
Genetic Identification Function for Photovoltaic System [8] Artificial Neural Network (ANN) genetic algorithm is produced by using the training data for the ANN model Robust maximum power point tracking method for photovoltaic cells [9] Chen-Chi Chu and Chieh-Li Chen Sliding mode control The controller is robust due to environment changes and load variations
Table1: Summaries Of The Previous Research
3.Methodology
There are several things should be considered in development of this project. Methodology is a process that has to be followed when analyzes data and designing a project. The process includes the method, technique, and the tools/equipments.
3.1. Photovoltaic Modules Modeling
Simulation tools provide the opposite view to the design tools. The user specifies the nature and dimensions of each component and the application provides a detailed analysis of the characteristics of the system. The accuracy of calculations and the simulation time required varies depending on the level of detail required and the type of data provided. They are used to verify the sizing of the system and investigate the impact of future changes in the systems being simulated.
In the first place describe to the solar panel which constitutes the main source of power for the whole photovoltaic installation. The equivalent model of the electrical circuit to use as the main element of the panel is formed by a current source that depends on the solar radiation in W/m2, of temperature in Celsius degrees (T), a shunt diode whose intensity of inverse saturation in series depends on the temperature and a resistance (RS), which represents the effect of the internal resistance of each solar cell and of the contacts of the generator as it is.
The equation is solved by designing a program in MATLAB, taking into account the number of solar cells which has the photovoltaic panel. The main equation is shown as in equation (1):
1 1
1 a Tak T
Iph
Iph T (1)
where T1 can be calculated by substitute the equation (2) into equation (1)
(2)
a is the ratio of short circuit current at T1 and the short circuit current at T2, can be calculated using equation (3)
T2 - Working temperature 2
IscT1 - Current of short circuit at temperature T1 IscT2 - Current of short circuit at temperature T2.
The saturation current is show in equation (4), whereby b is equal to Vg q/ A k ; Vg is diode voltage which is equal to 1.12 eV for crystalline Silicon <1.75 for amorphous silicon.
(4)
1
2
1 1 2T
T
Isc
Isc
Isc
a
T T T C T T b A rT re
T
Tak
I
I
1 1 3 1 Ref 1 Ref Suns IscTRef - Reference temperature
The photocurrent Iph is directly proportional to solar radiation IRA which taking into account a constant of proportionality, according to the equation (2). The terms of reference are: solar radiation (IRA = 1 sun = 1000 W/m2), atmospheric mass (AM=1.5) and temperature (T = 25 °C).
(5)
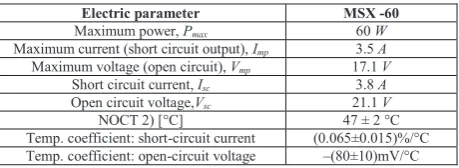
[image:4.544.158.388.280.364.2]The relationship between the photocurrent and the temperature is linear, according to the equation (1) and follows from the variation of photocurrent with temperature variation. When the panel is short circuited and illuminated, the photocurrent ntirely by the diode. The value of reverse saturation current Ir to 25 °C was calculated from the short circuit current and open circuit voltage at this temperature as shown in equation (3) [10]. Finally the value of diode ideality factor A is referring to the data appears in the specifications sheets and is provided by the manufacturer. In this project used the Solarex MSX -60 photovoltaic module. The Typical Electrical Characteristics of MSX -60 PV modules are shown in Table 2.
Table 2:Solarex MSX -60 Specifications
By knowing all the important required equations of the generalized PV model, hence, the generalized PV model subsystem can be built up.
diagram of the solar MSX -60 PV modules is shown in Figure 1. The inputs to the solar PV panel are cell temperature, solar irradiation and voltage.
3.2. MPPT Algorithms
All the MPPT algorithms are designed to dynamically extract the maximum power from the PV panels. Usually, the p v = 0 is adopted to locate this operating point, since PV panels show a unique global MPP. The MPPT age, i.e., the power p v
voltage of the PV panels and the reference voltage v* corresponding to the MPPT. In the region nearby v* the power
derivative can be considered a straight line having the slope k p v it is
necessary to introduce a voltage and current perturbation around any operating point of the PV array. Traditional MPPT algorithms
Among these techniques, the P&O and the incremental conductance algorithms are the most common. These techniques have the advantage of an easy implementation but they also have drawbacks. In normal conditions the V-P curve has only one maximum, so it is not a problem. However, if the PV array is partially shaded, there are multiple maxima in these curves. In order to relieve this problem, some algorithms have been implemented as in [12]. In the next section the most popular MPPT techniques are discussed.
The concept behind the "perturb and observe" (P&O) method is to modify the operating voltage or current of the photovoltaic panel until obtain maximum power from it. For example, if increasing the voltage to a panel increases the power output of the panel, the system continues increasing the operating voltage until the power output begins to decrease. Once this happens, the voltage is decreased to get back towards the maximum power point. This perturbation continues indefinitely. Thus, the power output value oscillates around a maximum power point and never stabilizes.
Electric parameter MSX -60
Maximum power, Pmax 60 W
Maximum current (short circuit output), Imp 3.5 A
Maximum voltage (open circuit), Vmp 17.1 V
Short circuit current, Isc 3.8 A
Open circuit voltage,Vsc 21.1 V
NOCT 2) [°C] 47 ± 2 °C
Temp. coefficient: short-circuit current (0.065±0.015)%/°C Temp. coefficient: open-circuit voltage (80±10)mV/°C
1 1
1 1 1
_
T VT A
T T T
r
e
Voc
P&O is simple to implement and thus can be implemented quickly. The major drawbacks of the P&O method are that the power obtained oscillates around the maximum power point in steady state operation, it can track in the wrong direction under rapidly varying irradiance levels and load levels, and the step size (the magnitude of the change in the operating voltage) determines both the speed of convergence to the MPP and the range of oscillation around the MPP at steady state operation [13].
Incremental conductance considers the fact that the slope of the power-voltage curve is zero at the maximum power point, positive at the left of the MPP, and negative at the right of the MPP. The MPP is found by comparing the instantaneous conductance (I/V
p v= 0, and as p IV, it yields
(6)
By comparing the increment of the power vs. the increment of the voltage (current) between two consecutives samples, the change in the MPP voltage can be determined. In addition, S is defined, as the sum of the array incremental and instantaneous conductance. Thus,
(7)
p v= 0, can be rewritten as
(8)
3.3. Controllers
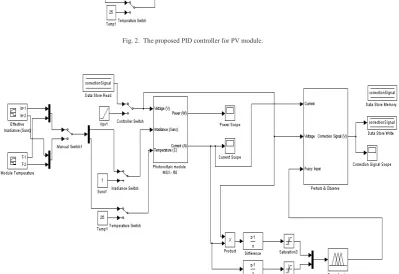
3.3.1 PID Controller
In the control of dynamic systems, no controller has enjoyed both the success and the failure of the PID control. Nowadays, the PID controller is the most widely used. The proposed PID controller is shown on Figure 2.
The PID algorithm is described in equation (9).
(9)
Propotional Integral Derivative
3.3.2 Fuzzy Logic Controller
In order to increase the performance of the P&O method, a fuzzy logic controller is used to dynamically modify the step size, based on the changes in power and reference voltage of the solar panel. The aim of the fuzzy logic controller is to let the P&O method reach MPPT faster.
There are four basic elements needed when designing a fuzzy logic controller, namely fuzzification, rule base, inference engine and defuzzification. Fuzzification is the process of converting the solar panel parameters into fuzzy sets using a pre-determined fuzzy membership function. The membership function is the curve that decides the membership value of each range of input signal values.
The fuzzy rule base is a collection of if-then rules which controls what the output should be given fuzzy values of input. They are set according to experience and operation of the system to be controlled.
The fuzzy inference engine is used to generate an output based on the given inputs and fuzzy rule base. The fuzzy inference engine will generate a logical decision based on the fuzzy rule setting. The defuzzifier is then used to convert the fuzzy output back into an actual value. The proposed FL controller is shown as in Figure 3. Meanwhile Figure 4a and b are
Vmp V at V
p
Vmp V at V
p
Vmp V at V
p
0 0 0
V I dV
dI S
0
S
d d K d e K t e K t
u d
t i
shown the Rule viewer and Rule editor respectively.
4.Results and analysis
The performance of the four systems, namely incremental conductance, incremental conductance with PID, perturb & observe (P&O) and P&O with fuzzy logic controller are analyzed.
The performances of the controllers are analyzed in these four conditions: 1) Constant irradiation and temperature
2) Constant irradiation and variable temperature 3) Constant temperature and variable irradiation 4) Variable temperature and variable irradiation
The metrics that are used to measure the performance are the maximum power achieved by the solar panel, the average power and the time for the controller to reach steady state from zero voltage (under constant irradiation and temperature).
4.1 Comparison of Temperature and Irradiation Effects on PID Controller versus Constant Conductance Algorithm
Table3. Comparison of Temperature and Irradiation Effects on Constant Conductance Algorithm
Table4. Comparison of Temperature and Irradiation Effects on PID Controller
From the Table 3 and 4, it can be seen that the PID Controller results in the solar panel reaching the MPP point faster as compared with the pure incremental conductance algorithm, with a comparable or better average power value. The PID controller is able to reach MPP within 0.016 seconds for a maximum power of 64.44 W and average power of 64.35 W. The settling time shows an improvement from 0.181 seconds to 0.016 seconds, while the average power shows an improvement from 62.62 W to 64.35 W. The PID controller gives a slightly less optimal value of average power as compared to incremental conductance algorithm alone in the case of variable irradiation, constant temperature, possibly due to overshoots as the power and current output from the solar panel is changing rapidly due to the changing irradiation. However, the difference is small. As such, it can be seen that the PID controller is able to give a much faster response time
Parameters
Constant conductance Constant Irr,
Const Temp Variable Temp Constant Irr, Variable Irr, Const Temp
Pmax 64.44 W 69.92 W 9.662 W
Vmax 18.1 V 19.7 V 18.2 V
Imax 3.56 A 3.549 A 0.5309 A
Tmax 0.191 s 1.199 s 2.503s
Rise Time 0.181 s 0.195 s 0.3 s
Average
power 62.62 W 67.71 W 7.557 W
Parameters
FL controller Constant Irr,
Const Temp
Constant Irr, Variable Temp
Variable Irr, Const Temp
Pmax 64.44 W 69.9 W 7.696 W
Vmax 18.07V 19.67 V 17.91 V
Imax 3.566A 3.554A 0.4298 A
Time 1.009 s 0.503 s 0.601 s
Rise Time 0.22 s 0.15 s 0.04 s
Average
and a comparable or better average output power as compared to incremental conductance algorithm alone.
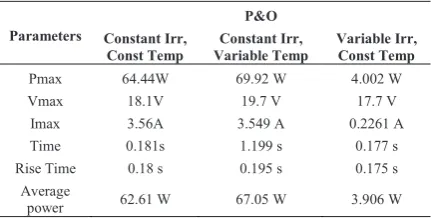
4.2 Comparison of Temperature and Irradiation Effects on FL Controller Versus P&O Algorithm
[image:7.544.165.381.174.283.2]From the Table 5 and 6, it can be seen that the FL controller results in the solar panel reaching the MPP
Table 5. Comparison of Temperature and Irradiation Effects on P&O Algorithm
[image:7.544.177.390.385.494.2]point faster as compared with the P&O algorithm, with a comparable or better average power value. In the case of variable irradiation, constant temperature, the average power and the maximum power of the FL controller are obviously higher than the P&O algorithm. However, for the constant irradiation and temperature, both of the controllers are give same values of maximum power and slightly different values of the average power.
Table 6. Comparison of Temperature and Irradiation Effects on FL Controller
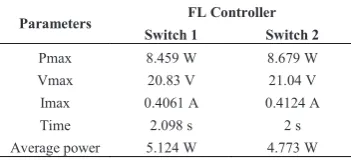
4.3 Comparison of PID and FL Controller (Variable temperature and variable irradiation)
The results from Table 7 and Table 8 have shown the PID and FL controller in two different stages. Which, the inputs for these two controllers are analyzed by the two categories variance irradiance and temperature which called switch 1 and switch 2. Meanwhile, switch 1 is represented normal irradiance which is sunny day. On the other hand, switch 2 is represented partially shaded conditions. For case 1, both of the controllers are turned to switch 1. The result for the maximum power of the FL controller is slightly higher than the PID controller. The FL controller is able to reach the MPP within 2.098 seconds for a maximum power of 8.459 W and average power of 5.124 W. In contrast, when the switch is turned to switch 2, maximum power of FL controller becomes lower than the PID controller.
Table 7. Comparison of Two Different Temperature and Irradiation Effects on PID Controller Parameters
P&O Constant Irr,
Const Temp Variable Temp Constant Irr, Variable Irr, Const Temp
Pmax 64.44W 69.92 W 4.002 W
Vmax 18.1V 19.7 V 17.7 V
Imax 3.56A 3.549 A 0.2261 A
Time 0.181s 1.199 s 0.177 s
Rise Time 0.18 s 0.195 s 0.175 s
Average
power 62.61 W 67.05 W 3.906 W
Parameters
PID Controller Constant Irr,
Const Temp Variable Temp Constant Irr, Variable Irr, Const Temp
Pmax 64.44 W 69.91 W 9.022 W
Vmax 18.07 V 19.62 V 18.07 V
Imax 3.566 A 3.564 A 0.4992 A
Tmax 3 s 1.2 s 2 s
Rise Time 0.016 s 0.018 s 0.285 s
Average
power 64.35 W 69.73 W 7.548 W
Table 8. Comparison of Two Different Temperature and Irradiation Effects on FL Controller
5.Conclusion
This paper has presented the modeling of PV module and the development of the MPPT techniques. In particular, the performances of the controllers are analyzed in these four conditions with are constant irradiation and temperature, constant irradiation and variable temperature, constant temperature and variable irradiation and variable temperature and variable irradiation. The proposed system is simulated by using MATLAB-SIMULINK. Based on the simulation result, the project is successfully achieve the objective.
[image:8.544.96.464.423.595.2]From the simulation result, PID controller has shown the better performance than FL controller when partially shaded conditions. Which, the PID controller has the greater maximum power and average power compared to FL controller. The maximum power and average power for PID controller is 9.884W and 5.884W, whereas, for the FL controller is 8.679W and 4.733W respectively. According the results, again has proof the PID controller is the optimum controller.
Fig. 1. Masked block diagram of the modeled solar MSX -60 PV Switch 1 Switch 2
Pmax 8.404 W 9.884 W
Vmax 18.12 V 17.77 V
Imax 0.4638 A 0.5541 A
Time 2.112 s 2.502 s
Average power
5.74 W 5.844 W
Parameters FL Controller Switch 1 Switch 2
Pmax 8.459 W 8.679 W
Vmax 20.83 V 21.04 V
Imax 0.4061 A 0.4124 A
Time 2.098 s 2 s
Fig. 2. The proposed PID controller for PV module.
[image:9.544.72.472.200.474.2]Fig. 4a. Rule viewer Fig. 4b. Rule editor
References
[1]
of Electrical Engineering in Japan, Volume 160, Issue 1, pages 79 86, 15 July 2007
[2] Array Modeling and Maximum Power Point Tracking Using Neural
Power Tech Conference Proceedings, 2003 IEEE Bologna, 5 pp. Vol.2
[3] R. Messenger and G. Ventre, Photovoltaic Systems Engineering, Second Edition Wiley, 2003.
[4] Lee, C. C. (1990). Fuzzy-logic in control-systems: Fuzzy logic controller, Part I. IEEE Trans Syst Man Cybern, 20(2), 404-418. [5]
Conference on Electric Engineering 2008
[6] Artificial Intell
Renouvelables ICRESD-07 Telmcen (2007) 11 -16
[7] Conference
3 to 25 March, 2010
[8] IJRRAS3 (3). June 2010
[9] Chen-Chi Chu and, Chieh-Li Chen,
revised form 26 January 2009 Accepted 2 March 2009 Communicated by: Associate Editor Elias Stefanakos [10] L. Castaner, Modelling Photovoltaic Systems Using PSpice. CRC Press, 2002.
[11] T. Esram, P.L. Chapman, "Comparison of Photovoltaic Array Maximum Power Point Tracking Techniques," IEEE Transactions on Energy Conversion, vol. 22, no. 2, pp. 439-449, June 2007.
[12] Tat Luat Nguyen, Kay-Soon Low, "A Global Maximum Power Point Tracking Scheme Employing DIRECT Search Algorithm for Photovoltaic Systems," IEEE Transactions on Industrial Electronics, vol.57, no. 10, pp. 3456- 3467, Oct. 2010.
[13] intTracking using Fuzzy Logic Control for Photovoltaic
18, 2011, Hong Kong