Supporting Student Engagement Through
Explorable Visual Narratives
Bilal Yousuf
and Owen Conlan
Abstract—This paper introduces VisEN, a novel visual narrative framework that has been shown to facilitate, support, and enhance student engagement in an adaptive Online Learning Environment (OLE). VisEN provides explorable visual narratives personalized to students in order to support them in engaging with course content. The evaluation of VisEN showed that the explorable visual narratives encouraged the majority of ‘improving engagement students’, that completed the Information Management and Data Engineering module as part of their undergraduate degree, to engage with assigned activities, and subsequently these learners enhanced their engagement levels. Visualizations have been used in OLEs to support students by presenting student data. Information Visualization research has demonstrated the value of visual narratives in communicating a message, by highlighting facts and making the message more memorable. In addition, visual data exploration can support users in understandings the message. However, in OLEs, explorable visual narratives have not been used to date to support student engagement or to guide learners through a message that they could explore and understand. This paper evaluates the impact that explorable visual narratives had on student course engagement during two successive academic years.
Index Terms—Personalized E-learning, Interactive narrative, Information visualization
Ç
1
I
NTRODUCTIONA
SOnline Learning Environments (OLEs) grow inpop-ularity [26], student engagement with such environ-ments remains an open issue. The literature has highlighted that engagement decreases over time in OLEs and overall is lower when compared to traditional classroom learning [3], [61]. Student engagement is a key factor for development and learning [34], hence this research focuses on supporting learner engagement when using OLEs. This section introduces explorable visual storytelling to support learner engagement.
Information Visualization (IV) facilitates an effective means to comprehend data by supporting pattern discover-ies and the communication of data [15]. Storytelling in IV or visual narratives can be defined as an ordered sequence of steps consisting of visualizations, which are linked to make the communicated message more memorable [4], [39], [54], [56]. Visual narratives provide effective ways of highlight-ing facts and supporthighlight-ing user guidance [33]. Decorative fea-tures can be included in visual narratives and research has shown that visual embellishment supports memorability [7]. Visual Explorations enable users to understand data bet-ter through views showing data transformations [15]. Both visual narratives in IV and visual explorations have yielded positive results [25], [39], [54].
Guiding students through their personal logged data can highlight important facts, such as learner engagement and resource usage trends, while at the same time it can present a message that can be more easily consumed. In addition, supporting students in exploring this data during the con-sumption of visual narratives can enable them to scrutinize areas of personal interest. Hence, one way of addressing poor learner engagement when using OLEs [3], [61] is to provide them with visual narratives that can be navigated and explored, and which can guide them through a per-sonal message related to their course activity. The goal of this research is to support students using OLEs, to engage with course content through personalized visual narratives. These visual narratives aim to guide learners through their data and enable it to be explored. Engagement in the context of this research is associated with students studying course content and completing assigned activities.
This research introduces Explorable Visual Narratives (hereafter referred to as visual narratives) into OLE (an adaptive OLE in this work). The visual narratives are made available to students through VisEN (a novel framework supporting the construction and consumption of visual nar-ratives). Visual narratives are comprised of narrative slices, which represent segments of the story. Each narrative slice contains dynamically generated interactive visualizations and textual descriptions of the data (personalized to each learner). Narrative slices also consist of data transforma-tions (exploratransforma-tions) which are made available to students. Data transformation [15] is the process of providing derived values and structure for input data. The state of the art in both IV and OLEs support data transformations through data parsing, extraction, and derivation and by providing statistical measures [22], [52], [58]. VisEN progresses how data transformations are generated in both domains. It does
The authors are with the ADAPT Centre, School of Computer Science and Statistics, Trinity College Dublin, Dublin 2, Ireland.
E-mail: {yousufbi, owen.conlan}@scss.tcd.ie.
Manuscript received 5 Sept. 2016; revised 6 June 2017; accepted 20 June 2017. Date of publication 3 July 2017; date of current version 20 Sept. 2018. (Corresponding author: Bilal Yousuf.)
For information on obtaining reprints of this article, please send e-mail to: [email protected], and reference the Digital Object Identifier below.
Digital Object Identifier no. 10.1109/TLT.2017.2722416
so by applying predefined mappings to data from narrative slices to automatically generate transformations containing related data. These novel transformations, calledslice trans-formations in this research, present visualizations of data related to the message within each narrative slice of the visual narratives.
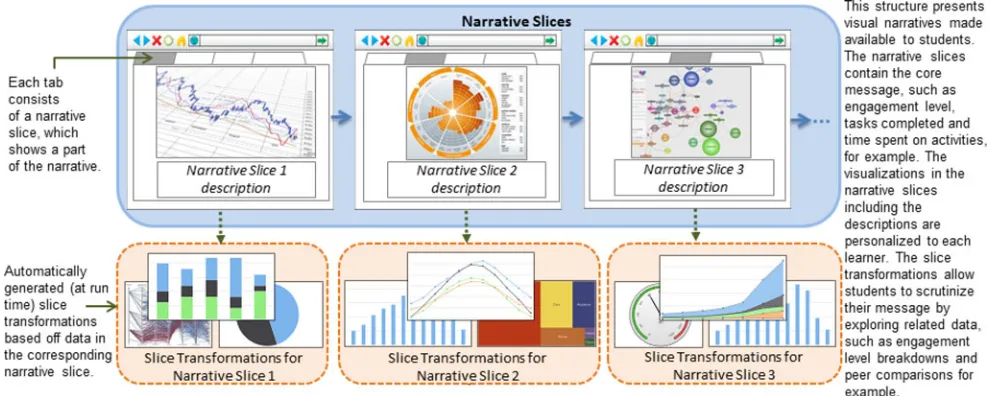
Fig. 1 presents the structure of a visual narrative which is constructed using VisEN through a combination of
informa-tion provided by the educator (narrative author) and the
automatic generation of visualizations, slice transforma-tions, and personalized descriptions. Visual narrative gener-ation is described in Section 3 of this paper. The visual narratives are presented through a web browser and each narrative slice (visualization, title, and description) is pre-sented within a browser tab. Navigating through the indi-vidual tabs enables the learners to consume the entire message. Several slice transformations are generated for each narrative slice as relevant mappings are automatically applied to the data. The slice transformations for each narra-tive slice are presented as links within the associated tab and manifested as visualizations when selected.
This research aims to communicate a personalized story to students by adopting a slide-show type approach (typi-cally used in visual narratives in online journalism). Each slice or tab consists of a single visualization with a descrip-tion to communicate part of the narrative. Collectively all the narrative slices communicate the entire story.
This paper first describes how VisEN supports the con-struction and consumption of visual narratives. This is fol-lowed by the evaluation of the framework, which focuses on the impact the visual narratives had on student course engagement, learner perceptions, perceived understandings of the message, and narrative usage patterns. VisEN was used during two successive academic years in Trinity College Dub-lin to provide visual narratives to a total of 233 undergraduate
students studying theInformation Management and Data
Engi-neeringmodule. This module consisted of two parts: one part consisted of lectures on relational database management sys-tems delivered by the module professor (not the focus of this research). The other part involved students studying Data-base development and SQL programming using the AMAS
adaptive OLE [57] (referred to as the coursein this paper).
Apart from being introduced to AMAS and given a demon-stration of it, the students were not provided with any other form of support when working through their activities using the OLE. VisEN was deployed to AMAS and provided stu-dents with personalized visual narratives. The personalized visual narratives communicated learners’ course engage-ment, activity completion and time spent on resources. The visual narratives were based on student logged data and aimed to support learners to understand and explore their engagement, study patterns and view peer comparisons.
The evaluation discussed in this paper analyzes learner activities and visual narrative usage during the course. It examines visual narrative visits by learners when their course engagement levels were poor and/or good. At the end of the course, learners completed a questionnaire addressing the usefulness of the visual narratives and were encouraged to provide comments. The evaluation compares the students with improving course engagement against the rest of the learners to determine the impact that the visual narratives had on their engagement.
The remainder of this paper is as follows: Section 2 dis-cusses the related work. Section 3 describes VisEN and Section 4 discusses the research approach. Section 5 evalu-ates the effectiveness of visual narratives in supporting stu-dent engagement and Section 6 presents the conclusions.
2
R
ELATEDW
ORK [image:2.565.36.530.46.244.2]Visualizations are commonly used in OLEs within the Learning Analytics (LA), Open Learner Modeling (OLM) and Educational Data Mining (EDM) domains. In OLM, vis-ualizations are used to present student models showing learner competencies to support reflection. EDM uses visu-alizations to present patterns of sequences to enable predic-tions to be made. LA uses visualizapredic-tions to present student activity to educators and at times to students to raise aware-ness and to promote behavioral change. This section ana-lyzes the state of the art in OLEs, specifically in domains that present data to learners using visualizations (LA, OLM, and EDM) by examining the level of guidance and visual scrutability available to students.
2.1 Guidance
In LA, OLM and EDM, data has been visually presented to learners through dashboards [2], [16], [23], [44], [50], [52] and through highly structured visualizations sometimes present-ing multiple views on a spresent-ingle screen [11], [22]. Some of these visualizations allow data to be interpreted at a glance [52], [62], some provide brief explanations for the data presented [16], [60] and others require a deeper level of understanding through user scrutability and negotiation which may encour-age reflection [11], [9]. Usencour-age patterns presenting the number of sessions and the times of visual interactions have highlighted the value of visualizations for student learning and engagement [27], [51]. In addition, studies have shown positive student perceptions towards visualizations in online learning [22], [27]. However, in some cases feedback has highlighted that students at times had difficulties interpreting the views [45], [53]. Lonn et al. in their study [42] found that the visualizations presented to learners led to students misin-terpreting their data and recommended that learners should be guided through complex data. The evaluation conducted by Kuosa et al. [36] found that the visualization closest to resembling a story was the most useful for learners.
In recent years, an increasing interest in visual narratives in IV [56] and online journalism [59] has emerged to support data analysis. In IV, tools such as Ellipsis [54], Tableau [58], SketchStory [39] and Gapminder [19] have successfully pre-sented data through visual narratives and their evaluations have shown encouraging results. For example, an evaluation of Gapminder [38] showed that it was successfully used by students to design a project exploring statistical data. An eval-uation of SketchStory [39] showed that visual narratives were found be very engaging for end users when compared to pre-sentations using similar data through MS PowerPoint.
To date, visual narratives have not been used to present learner data to students or educators. VisEN enables narrative authors to construct a story, which is automatically visual-ized, personalized and made explorable. The visual narrative consists of a personal message, displayed across multiple screens that can have a beginning, middle and end in order to guide the learner. Each narrative slice of the story focuses on guiding the student through the data presented by the visuali-zation via a textual description, as shown in Fig. 1 above. Visual narratives provide effective ways of passing on infor-mation [4]. In addition, they can guide students through data to minimize misinterpretation, which can significantly affect learner motivation levels and performance [42].
2.2 Visual Exploration
Visual exploration through visual interactions, scrutable data models and data transformations can support users in understanding data better [13], [15], [25], [31], [32]. Popular visual interaction techniques supported in OLEs include select, explore and elaborate (details-on-demand, drilldown views), filter and coordinated views and these have been implemented across LA, OLM and EDM [5], [22], [27], [30], [35], [40], [45], [46], [52], [60], [62]. Scrutable user models can support learners in understanding their data by enabling them to explore and navigate through it, detect errors, and negotiate and share their models [13], [31]. Data transformations can also be considered as a form of data scrutability through the generation of derived values or
derived structure of user data to support the analysis pro-cess [15], [25]. Data transformations are applied using source data, metadata, and database schema including data types and relationships. An example of derived values can refer to applying statistical measures to the data and an example of derived structure can refer to sorting and classi-fying the data. These can support various views of the data. In addition, findings in OLM have shown that visualiza-tions and visual scrutability support metacognition by pro-moting regulated learning, assessment, and self-reflection [20], [41]. For example, Bull et al. show how visu-alizations and visual scrutability enabled students to think about their competencies, compare their performance against targets, and plan the next activities [10].
Implementations of data exploration are prevalent in LA allowing students to scrutinize their data and analyze peer comparisons [16], [22], [45], [62]. In LA, several systems sup-port data transformations. For example, SAM [22] has a dedicated panel displaying statistical measures that include average, maximum, and minimum time spent and resources used by learners. Moodog [62] provides visual representa-tions of statistical reports presenting activity and resource usage, which can be considered as data transformations of the logged data. The LARAe [16] dashboard displays points which represent activities and contain a number that is an aggregation of the total posts or comments associated with it. The eMUSE [49] platform presents action aggregations and averages from the student data and ALAS-KA [50] dis-plays class averages that are shown next to learners’ data.
In OLM, learners have access to explore and scrutinize their user models. Research presented by Brusilovsky et al. enables students to explore their progress and performance by analyzing their user models through visualizations which support peer comparisons [8], [27], [28]. Bull et al. present Next-TELL, which provides a range of visualizations present-ing student competencies, some of which support the explora-tion of student data [11]. Kay and Upton present Narcissus, which provides visual representations of a group model, allowing individual learners to analyze their own progress and the progress of their team [60]. Long and Aleven imple-ment two views of the OLM to enable students to perform self-assessments and to explore their progress [41]. Some sys-tems allow students to update their user models [35], [43] and enable students to negotiate with their learner models [21]. Data transformations have also been used in OLM, generally to build the user models. This involves, 1) extracting and gath-ering student traces and applying transformations to the data before calculating confirmed knowledge or 2) transforming data by applying certain criteria prior to displaying the mod-els [1], [12], [18], [23], [35].
EDM also enables student data to be scrutinized by navi-gating through it and analyzing student comparisons [2], [17], [47], [48]. Data transformations have also been sup-ported by EDM. Within this domain, data transformations are typically applied prior to running the mining algo-rithms. The results of the transformed data that has been data mined are then visualized [2], [17], [47], [55].
across the three domains. VisEN also supports visual explora-tion through the implementaexplora-tion of popular visual interacexplora-tion techniques and data transformations. However, it enhances how data transformations are generated beyond those avail-able through the state of the art. VisEN incorporates data transformations (slice transformations) into visual narratives. It dynamically produces slice transformations by applying mappings to narrative slice data to generate visualizations that are related to it. All relevant mappings are applied indi-vidually to narrative slices resulting in multiple transforma-tions generated per narrative slice. In OLM, transformatransforma-tions are applied to student data to generate the visualizations to present the learner model. In EDM, transformations are applied to the data prior to it being fed into the data mining algorithms. The output of the data mining algorithms is used to generate the visualization that is presented. In both of these domains, data transformations are not used to generate views that support the exploration of the data presented. Instead, they are used to generate the initial set of views that are pre-sented to the users. In LA, data transformations are generated to supplement the core visualizations presented to the learn-ers. However, multiple transformations that are directly related the individual visualizations are not generated, instead, transformations related to the data source such as averages and aggregations are produced. In the approach used by VisEN, the slice transformations are directly related to the visualization in each narrative slice that the user is ana-lyzing. This enables the student to explore data directly asso-ciated with the message.
2.3 Progressing the State of the Art
This research takes the opportunity to introduce visual tives to OLEs, specifically adaptive OLEs. The visual narra-tives support interactions to assist students in analyzing the message and include slice transformations to enable them to explore data directly related to the individual narrative slices.
The data transformation approach implemented by VisEN is different from those found in the LA, OLM and EDM domains as each visualization in the visual narrative can be explored through multiple transformations of the data used in the narrative slices. This approach enables stu-dents to explore each narrative slice of the visual narrative which can be useful to understand the message communi-cated. Slice transformations are more appropriate for pre-sentations that display a flow of individual visualizations, one after the other (visual narratives) where each view can be explored as opposed to dashboards, where one or several visualizations are available on a single screen.
3
V
ISUALN
ARRATIVEC
ONSTRUCTION ANDC
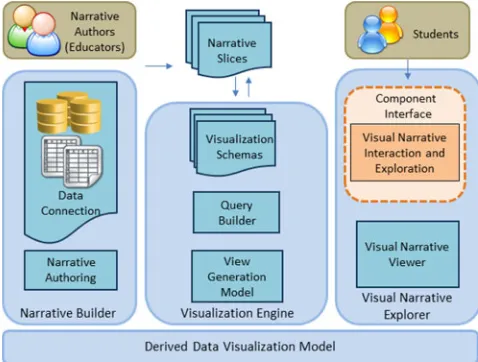
ONSUMPTIONThe VisEN framework was developed to enable the con-struction and consumption of visual narratives for OLEs. This section describes the process of constructing visual nar-ratives using VisEN and how they are consumed. Fig. 2 presents the architectural overview of VisEN.
3.1 Narrative Construction
The Narrative Builder component is used by narrative authors (course instructor in this work) to construct a story, consisting of a beginning, middle, and end. It enables
narrative authors to connect to data sources and construct a story by specifying the data for each narrative slice. This invokes the Visualization Engine which returns a set of appropriate visualizations. The narrative author also pro-vides a description for each narrative slice, which is later personalized by VisEN. For the course discussed in this paper, the instructor connected to the data source housing historical student data (2012-2013 data) and specified the data, filters, and descriptions for three narrative slices. The Visualization Engine generated the visualizations using this data and the Derived Data Visualization Model generated a set of slice transformations per narrative slice.
3.2 Narrative Consumption
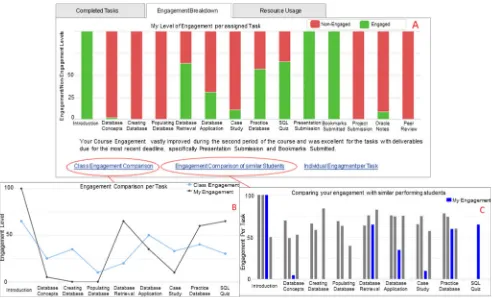
The Visual Narrative Explorer component enables students to view, interact and explore their visual narratives. This component personalized the visual narratives for each stu-dent by 1) updating the data used by the course instructor in the visual narrative to use current student logged data, and 2) personalizing the descriptions in the message. Fig. 3 presents screenshots of a part of a visual narrative of a stu-dent enrolled in the course during the 2014-2015 academic year. The students’ visual narratives consisted of three nar-rative slices: 1) Completed Tasks, which enabled learners to examine their tasks and the times they spent on them; 2) Engagement Breakdown, which allowed students to ana-lyze their engagement per task (Fig. 3A); and 3) Resource Usage presenting the material they used and shared. Com-bined, these slices presented a personalized story with per-sonalized descriptions to each learner. Each narrative slice consisted of two-three slice transformations (links within the slice), which when selected displayed popup windows enabling students to scrutinize and explore the story through related data (Fig. 3B and Fig. 3C).
4
R
ESEARCHA
PPROACH [image:4.565.294.533.45.226.2]The aim of this research was to present personalized explor-able visual narratives to students and then to evaluate 1) the impact (if any) that these visual narratives had on student course engagement, 2) learners’ perceptions towards them, 3) whether students were able to understand them, and 4) their usage patterns. A detailed study was conducted
during and after the course (across the two academic years) consisting of three sets of analyses as part of the evaluation.
This section discusses the research approach used in the study consisting of quantitative and qualitative analyses. The analyses comprised of the following:
1. The collection of data included student interactions
with their visual narratives, learners’ responses to a post-course questionnaire, and their opinions towards their visual narratives. Data collection pro-cedures were consistent across both academic years of the course. The course, visual narratives and the questionnaire were also unchanged. Data from all students who participated in the course across both years was collected and used in the analyses. In addition, the material from the course remained unchanged, including activities, books, and support.
2. The quantitative method examined the impact that
the visual narrative usage had on course engagement through statistical measures. This was conducted by examining the student logged data, which consisted of almost 120,000 student interactions for both aca-demic years. Over 10 percent of these interactions were visual narrative interactions. The quantitative data also examined students’ responses to the post-course questionnaire statements. It also included the running of chi-square tests for independence on the responses.
3. The qualitative method examined student opinions
towards the various aspects of their visual narratives (via the open-ended post-course questionnaire). These comments were used together with the quanti-tative findings to derive conclusions.
The self-reported usage data used by the study was veri-fied using the student logged data as they were linked. Due to the nature of the course (students working on activities at best suited times) and the lack of access to the students fol-lowing the completion of the course, it was not possible to conduct further forms of qualitative analysis.
5
E
VALUATIONThis section discusses the evaluation of VisEN which was conducted via a real world use case by deploying it on AMAS. It was used by 233 undergraduate students across two academic years (108 students in 2013-2014 and 125 in 2014-2015) at Trinity College Dublin as part of their degree program. AMAS enabled students to log in to the course and work on several tasks/activities, which included the develop-ment of a database using the environdevelop-ment. Further details of the course including its structure, screenshots and details of the assigned activities can be found in the AMAS publica-tions, such as [57].
Throughout the course, each student was given access to a visual narrative, as shown in Fig. 3, which provided a per-sonalized message of course engagement to date, resources used, and time spent on activities. The students could also view the slice transformations, allowing them to explore data directly related to the narrative slices of the visual nar-rative. The difference in setup between the two years included two extra slice transformations in the second year and an upgrade to the servers in the same year to improve the speed by which the pages were loaded.
[image:5.565.38.531.43.341.2]The course was split into four 3-week long engagement periods and at the end of each of these periods, students were emailed engagement notifications. These notifications described the learner’s current engagement level with the
course as below average, good or excellent engagement. A below average engagement notification meant that the student had completed under half of what was expected at that point (study content and tasks). The average number of student interactions with their assigned tasks on AMAS during below average engagement periods was 38:84 17:6(median: 38).
The motivation behind this research was to address poor learner engagement with course content when using OLEs [3], [61]. Through the AMAS notifications, the students who had engagement levels of below average and who subse-quently improved their engagement to average or higher could be clearly identified. As part of the study, these learners (hereafter referred to as ‘improving engagement students’) were separated from the rest of the class. The objective of this separation was to determine the effect if any, that the visual narratives had on their enhanced engagement. From the 233 students across both academic years, 97 were identified as improving engagement students. During the subsequent period in which the improving engagement students enhanced their engagement, their mean interactions increased to130:1 36:9(median: 107). This represented a magnitude
of a three-fold enhancement (from 38:84 17:6 to
130:1 36:9) in the usage of the OLE over an engagement
period. The improving engagement students had on average at least two times more visual narrative interactions (mean of
58:3 24:7) than the rest of the class (mean of22:1 15:8). Hence the questionnaire responses were categorized by improving engagement students versus the rest of the class. 70 percent of students across both academic years responded to the questionnaire. 66 percent of the improving engagement students and 72 percent of the rest of the class responded.
The evaluation consisted of one study with three sets of analyses conducted across the two academic years. The first analysis assessed student visual narrative usage, specifically when their course engagement improved (following a noti-fication highlighting an engagement level of below aver-age). It also examined students’ responses and opinions towards the support offered by the visual narratives in enhancing their engagement levels. The second analysis examined the correlations between visual narrative usage versus course engagement and grades. The third analysis examined the perceptions and understandings that learners had of their visual narratives. All three analyses were con-ducted using 1) student logged data (consisting of student interactions with the course and their visual narratives), 2)
students’ questionnaire responses, and 3) their opinions towards their visual narratives.
An important note when analyzing this study is that the students were not given any support in terms of using their visual narratives. They were told about them when they were introduced to AMAS.
5.1 Analysis 1: Visual Narrative Usage Following a below Average Engagement Level Notification
This section discusses Analysis 1, which consists of three parts focusing on the impact and support that visual narra-tive usage had on enhancing course engagement. The analy-sis examines student visual narrative usage when their course engagement improved and assesses learner feedback to determine whether the visual narratives supported engagement. In the 2013-2014 academic year, 46 learners and in 2014-2015 academic year, 51 learners were from amongst the category identified as improving engagement students. From the rest of the students that received below average engagement level notification but did not show the same level of improvement, there were 43 learners in 2013-2014 and 44 learners in 2013-2014-2015.
5.1.1 Visual Narrative Sessions
The first part of Analysis 1 examines the number of visual narrative sessions (visits) before and after students received a below average engagement notification.
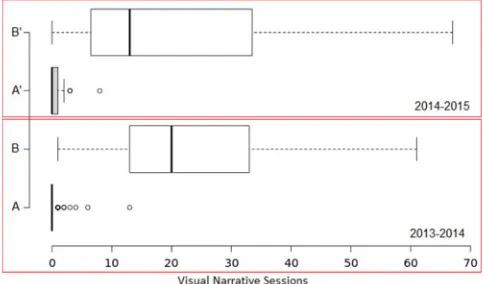
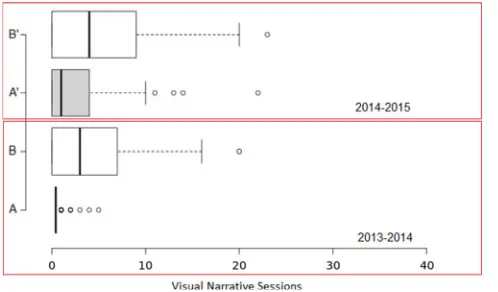
Fig. 4 presents the spread in visual narrative sessions between a period of below average engagement and the sub-sequent period of average or higher engagement for the 97 improving engagement students. In 2013-2014, A and B in Fig. 4 show the increase in visual narrative sessions, A highlighting the number of sessions during below average engagement and B showing the number of sessions during improved engagement. The same holds true for 2014-2015, shown through A’ (below average engagement) and B’ (improved engagement). It is important to note that at A and A’ in Fig. 4, students showed some level of engagement with their study content and tasks as highlighted above (mean of
38:84 17:6 interactions), however, their visual narrative sessions were minimal. The shift from A to B and from A’ to B’ highlights how these students increased their usage of their visual narratives as their course engagement improved. The visual narrative sessions for these students (B and B’ in Fig. 4) was higher than mean visualization sessions reported by
OLEs which ranged from 3:75 0:53 to 8:4 1:39 for a
semester across several systems [27], [28], [40], [53].
Fig. 5 presents the spread in visual narrative sessions before and after a below average engagement level notifica-tion was issued to the rest of the students. These students did not improve their engagement to the same level as the improving engagement students as it remained at below average. Fig. 5 shows a smaller shift in the number of visual narrative sessions in the engagement period following below average engagement notifications for this group of students.
[image:6.565.31.273.46.188.2]These findings highlight a link between increased usage of visual narratives and increased course engagement, espe-cially amongst the improving engagement students.
5.1.2 Visual Narrative Interactions
The second part of Analysis 1 examined visual narrative sessions and visual narrative interactions following a below average engagement level notification. All of the 97 identi-fied improving engagement students showed increased interactions with their visual narratives during the period in which their engagement improved. The analysis found that the majority of these students (85 percent in 2013-2014 and 76 percent in 2014-2015) showed a minimum of a four-fold increase in their visual narrative interactions and had revisited their visual narratives at least seven times during the period of improved engagement. This highlights a posi-tive link between visual narraposi-tives usage and enhanced stu-dent course engagement.
From the rest of the students (77) that received a below average engagement level notification but did not improve to the same level as the former group, 21 percent in 2013-2014 and 8 percent 2014-2015 showed a similar level of increase in their visual narrative interactions and sessions. These students (21 and 8 percent) had shown improvement in their engagement but it was not at the same level as the 97 identified improving engagement students.
One of the primary aims of AMAS is to support weaker students in completing their course assignments. Across both academic years, a total of 45 learners were identified as weak students as they had an average grade below 55 per-cent coming into the course for each of the previous years of their degree program. From these 45 students (all of whom had received a below average engagement level notification during the course), 23 were from the identified as improv-ing engagement students. The analysis of the logged data of these 23 students was analyzed and it was found that all of them immediately viewed their visual narratives following a below average engagement level notification. 22 out of the 23 students showed a minimum of a 90 percent increase in interactions with their visual narratives during the period in which their engagement improved. For the 22 of the 45 weaker students who did not show the same level of engagement improvement, the analysis of the logged data found that on average, the visual interactions amongst them were four times less than the visual interactions of the improving weaker students. This again highlights a positive link between visual narrative usage and enhanced course engagement.
5.1.3 Students Views on the Impact of the Visual Narratives
The final part of this analysis examines student responses and opinions to statement 1 in the post-course question-naire. The improving engagement students’ responses are separated from the rest of the class as the former had on average two times more visual interactions than the rest (details provided at the start of Section 5).
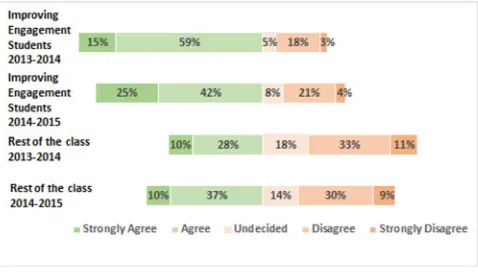
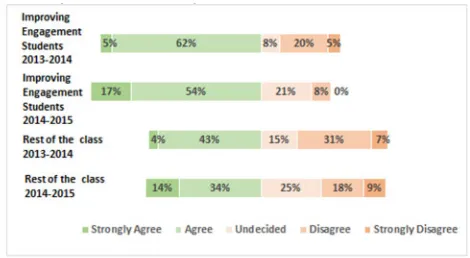
Statement 1: The visual narrative motivated me to engage
with the course, incorporated all the visualizations from the visual narrative presented to the individual students. Fig. 6 shows the students responses. The responses from the improving engagement students showed that 71 percent of them in both academic years, strongly agreed or agreed that the visual narratives supported them in engaging with the course. This percentage is higher than those reported in LA and OLM (which ranged from 54.8-70.2 percent) [27], [29], [37]. This result indicates a positive impact of the visual nar-ratives on supporting course engagement amongst the improving engagement students. The response from the rest of the class was spread across the five options, where 45 and 56 percent of these students from the 2013-2014 and 2014-2015 academic years respectively, strongly agreed or agreed with the statement.
The opinions from the improving engagement students suggested that the visual narratives motivated them to engage with the course. Some of their comments included: “It motivated me to improve my engagement levels”, “It was interesting to see my progress in this format”, “Useful but some-times slow” and “Yes it did but the study concepts were not pre-sented”. The comments suggested that these students found their visual narratives useful. Comments regarding the speed of loading pages were made in the 2013-2014 aca-demic year but not in the subsequent year as server upgrades were made which enabled the visualizations to load faster. Some of the improving engagement students commented on preferring certain views over others, for
example, one comment was “Most of the visualizations, yes,
[image:7.565.290.536.44.179.2]but the pie chart, not really”. This highlighted that not all visu-alizations are suitable for every student, however, none of their comments indicated any issues in following or under-standing the associated textual message in the visual narra-tive. Overall the feedback suggested that although a small number of these students preferred some visualizations offered over others, the visual narratives still supported them in enhancing their engagement.
[image:7.565.31.280.45.191.2]Fig. 5. Visual Narrative session: rest of the students.
The comments from the rest of the class mostly focused on issues regarding how the engagement metric was calcu-lated (which did not include the optional external resour-ces). Some of their comments were “Did not reflect my overall progress as it did not include resources that were external to the course content”, “Did not include the PDF studies.” and “The task engagement didn’t take into account the complexity of tasks”. While these comments provide valuable feedback, they do not reflect upon the visual narratives, rather they raise issues with how AMAS calculated engagement, which is out of the scope of this study.
5.1.4 Findings from Analysis 1
The findings from the first two parts of Analysis 1 showed that the majority of students who improved their engagement following below average engagement level notifications increased the usage of their visual narratives. A shift of their
visual interactions (from a mean of 2:38 4:06 to
56:67 38:29) was calculated to be significant at p < 0:05 (t-value¼ 10:06). It also showed that the rest of the students who had received below average engagement level notifica-tions and subsequently did not improve to a similar level had considerably fewer interactions with their visual narratives. A shift of their visual interactions (from a mean of3:52 6:95 to6:18 8:85) was calculated as not significant atp < 0:05 (t-value¼ 1:89). This difference in the usage of the visual nar-ratives between the two groups of students (Figs. 4 and 5) and the resulting change (or lack thereof) to course engagement combined with the feedback from the students to statement 1 discussed above meant that email notifications cannot be solely attributed to the enhanced engagement.
From these findings, it can be seen that the visual narra-tives had an important role in supporting course engagement. It is important to note that visiting and interacting with the visual narratives did not improve student course engagement as these interactions were not included in the engagement cal-culation. In addition, the email notifications sent to students did not reference the visual narratives, meaning that students were not directed to their visual narratives. Although AMAS was discussed during the module lectures, the visual narra-tives were never mentioned by the module professor as they were not part of the course content and activities, meaning that students visited them through their own volition. Finally, an improvement in course engagement does not necessarily mean increased visual narrative usage or vice versa and poor course engagement does not map to low visual narrative usage. As Analysis 1 only focused on students that received a below average engagement level notification at any point in the course, it did not include those who engaged well throughout. 59 students were not included in this analysis as they engaged at the higher engagement levels throughout the course. When the visual narrative usage of these 59 students was analyzed, it was found to be varying and lower than that of the improving engagement students. This showed that high or low visual narrative usage does not necessarily mean high or low course engagement respectively.
The feedback from students to the statement discussed in this analysis was generally reflective of their visual narra-tives usage. The statement responses and opinions from the students with high visual narrative usage, namely the improving engagement students, highlighted the positive
impact that the visual narratives had on their course engagement and how it helped them become more engaged. The feedback from learners with lower visual narrative usage highlighted concerns regarding how the engagement score was calculated, however, the students were informed that external resources were excluded from the engagement score. Overall the findings from Analysis 1 indicated that the visual narratives helped students to improve their course engagement.
5.2 Analysis 2: Correlation between Visual Narrative Usage versus Engagement and Performance
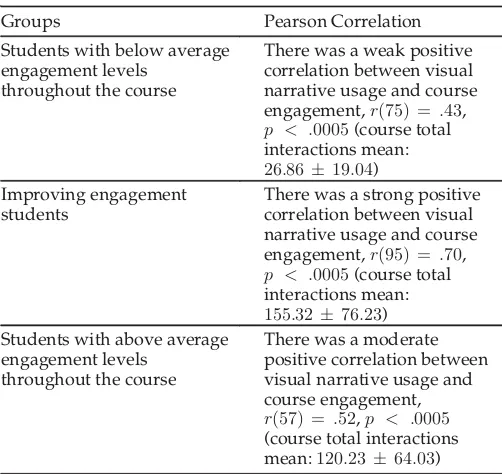
The objective of Analysis 2 was to examine (for all of the stu-dents) the correlation between visual narrative usage and course engagement, and the correlation between visual nar-rative usage and student grades using the Pearson correla-tion coefficient. For the first correlacorrela-tion (visual narrative usage and course engagement) students were grouped by their overall engagement levels throughout the course. The first group (consisting of 77 students) were those with below average course engagement throughout the course. The sec-ond group consisted of the 97 improving engagement stu-dents (those with below average engagement followed by improved levels of engagement). The third group of learn-ers consisted of those who engaged at the higher engage-ment levels throughout the course and AMAS did not identify these students as needing to show improvement (59 students). The results are presented in Table 1 for all three groups of students.
[image:8.565.289.540.69.306.2]Analysis of the logs showed that the improving engage-ment students had on average the most visual narrative interactions followed by the students with high engagement throughout the course. The results shown in Table 1 highlighted that in the case of improving engagement stu-dents, an increase in visual narrative usage was strongly correlated to an increase in learner engagement.
TABLE 1
Correlation between Visual Narrative Usage and Engagement
Groups Pearson Correlation Students with below average
engagement levels throughout the course
There was a weak positive correlation between visual narrative usage and course engagement,rð75Þ ¼ :43,
p < :0005(course total interactions mean:
26:86 19:04) Improving engagement
students
There was a strong positive correlation between visual narrative usage and course engagement,rð95Þ ¼ :70,
p < :0005(course total interactions mean:
155:32 76:23) Students with above average
engagement levels throughout the course
There was a moderate positive correlation between visual narrative usage and course engagement,
To determine the correlation between visual narrative usage and performance, the analysis examined 1) the grades related to students’ continuous assessment and 2) those based on the examination results. The continuous assessment grade included the mark a student achieved for the deliverables that he/she worked on using AMAS. It also included the mark that a student achieved for his/her project submission at the end of the course. In the 2013-2014 academic year, both these marks were separately available. There was a moderate posi-tive correlation between visual narraposi-tive usage and the AMAS deliverables marks, rð106Þ ¼ :53, p < :0005 (the mean grade was76:22 13:97). For the historically weaker students, there was a strong positive correlation between visual narrative usage and the AMAS deliverables marks,
rð20Þ ¼ :868,p < :0005(the mean grade was71:6114:86). In the 2014-2015 academic year, only a combined mark for the AMAS submissions and the end of the course project was available. There was a weak positive correlation between this combined mark and visual narrative usage for the class,
rð123Þ ¼ :36,p < :0005(the mean grade was78:0617:94). For the historically weaker students, there was a moderate
positive correlation between these two variables, rð21Þ ¼
:572,p < :05 (the mean grade was73:52 19:89). Project work did not require students to use AMAS to the same degree as the AMAS deliverables (which were due prior to commencing work on the project), hence a combined mark resulted in a weaker correlation.
The examination consisted of questions related to data-bases that the class had studied using AMAS and other questions related to topics covered by the professor in the module lectures. Only the grades from the examination questions related to the AMAS content were used in this analysis. The Pearson correlation coefficient between visual narrative interactions and the AMAS related questions
grades for the class across both years was rð231Þ ¼ :03,
p ¼ :65(the mean grade was50:94 18:21). Hence it was
concluded that there was no relationship between these two variables. It should be noted that this is not necessarily a negative result as any usage of AMAS prior to the examina-tion was not in the attainment of course work but rather as a revision tool. At that point, the visual narratives were of less value as they focused on course work, and the students at this point were revising for their examination.
5.2.1 Findings from Analysis 2
The findings from Analysis 2 showed strong positive corre-lations between improving engagement students’ course engagement and visual narrative interactions and between historically weaker students’ continuous assessment grades and visual narrative interactions. These results can be useful for making predictions, specifically for an unknown, such as continuous assessment grades in this case. Based on these findings AMAS has now started monitoring visual narrative interactions and using it together with the student engage-ment scores to formulate advice for learners.
5.3 Analysis 3: Student Perception and Usage of Visual Narratives
The aims of Analysis 3 were: 1) to assess how the visual narra-tives were perceived, 2) whether the message communicated
was understood and 3) how the visual narratives were used by students. This analysis examines both student feedback (questionnaire responses and comments) and visual narrative usage patterns to address these aims.
5.3.1 Student Perception towards Their Visual Narratives
To determine students’ perceptions towards their visual narratives, this part of the analysis assesses learners’ responses and opinions to three statements. These state-ments addressed 1) the overall usefulness of the visual nar-ratives, 2) the value of the slice transformations in the visual narratives and 3) the benefit of peer comparisons (some of the slice transformations presented peer comparisons).
Analysis 1 discussed student responses and opinions in relation to statement 1 from the post-course questionnaire:
The visual narrative motivated me to engage with the course. This statement addressed the entire visual narrative. The responses and opinions from students indicated a positive perception of visual narratives, specifically from the stu-dents with higher visual narrative usage.
An important element of the visual narratives were the slice transformations presenting data related to the mes-sage within each narrative slice, to enable students to explore the story presented. As slice transformations were part of the visual narrative, it was important to analyze rele-vant student feedback to help determine learner perceptions towards the entire visual narrative. In the post-course ques-tionnaire, students were asked to provide feedback regard-ing the usefulness of the slice transformations embedded
within their visual narratives through statement 2: It was
[image:9.565.296.535.45.184.2]useful to explore related data through other visualizations. They responded using a five-point Likert scale and provided comments. The responses shown in Fig. 7 highlight that the majority of the improving engagement students found this feature beneficial, with 74 percent in the 2013-2014 academic year and 67 percent in the 2014-2015 academic year agreeing or strongly agreeing with the statement. This indicated a positive perception from these learners towards slice trans-formations. The response from the rest of the students was mixed with 38 and 47 percent agreeing or strongly agreeing in 2013-2014 and 2014-2015 respectively. As with all the statement responses from this group of students (rest of the class), a mixed response was expected as the visual narra-tive interactions were lower amongst these learners. It is also important to note that not all of the students from the rest of the class viewed their slice transformations.
A chi-square test for independence was conducted between the responses from the two student groupings. There was a statistically significant association between the
responses of the two sets of students, x2ð4Þ ¼ 10:95,
p ¼ :027. The association was moderately strong (Cohen,
1988), Cramer’sV¼ :271. This showed that there was a rela-tionship between the student groupings and the response type. Analyzing the responses from both student groupings together with the chi-square statistic result indicated that the students with a higher level of interactions with their visual narratives found the slice transformations more useful.
The individual opinions provided by students to this statement suggested that learners with higher visual narra-tive usage (generally the improving engagement students) found the slice transformations useful. Comments from the
improving engagement students included: “It was nice to get
such breakdowns”, “Useful during the phases of learning about databases”, “Great idea when available” and “Yes when they worked”. The latter example of comments (“. . .when
available” and “. . .when they worked”) was raised by students in the 2013-2014 academic year, due to a server issue. There were also comments from the improving engagement stu-dents that suggested that they liked the idea but the slice transformations did not help them learn about databases,
for example, one student wrote: “Fun, but did not help me
learn about databases”. However, supporting students to learn about databases was not the objective of the visual narratives, this was the aim of AMAS. Comments from the students from the rest of the class suggested that several of these learners did not use the slice transformations: “Didn’t realize that happened”, “I did not use this functionality” and “unaware of these”. The students that made these comments had lower usage of their visual narratives and from their logged data, it was found that they had not viewed the slice transformations. The perceptions of students towards the explorations were reflective of their usage of their visual narratives. Generally, those with higher visual narrative usage found the transformations useful.
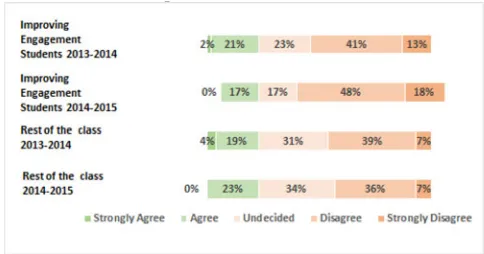
Several slice transformations within the visual narratives presented peer comparisons (many related to activity times) to the learners. Research has shown that peer comparisons can promote self-reflection [6]. Students were asked to pro-vide feedback indicating whether the peer comparison views were beneficial. The students responded to statement 6:I did not find it useful to view how much time others spent on activities, using a five-point Likert scale and provided comments.
The responses to this statement, shown in Fig. 8, were spread, with high a percentage of learners from the improv-ing engagement students and the rest of the class undecided regarding the benefit of peer comparisons. Although the students that disagreed or strongly disagreed with the state-ment were in majority from both groups, the responses sug-gested that learners were unsure about the benefit of such comparisons.
A chi-square test for independence was conducted between the responses from the two student groupings. There was no statistically significant association between the responses of the two sets of students, x2ð4Þ ¼ 7:72,
p ¼ :102. The association was small to moderate (Cohen,
1988), Cramer’s V¼ :22. This showed that there was no
significant relationship between the student groupings and the response type. This could be explained by the fact that responses were quite spread across the five response catego-ries (strongly agree to strongly disagree), especially from the rest of the class students.
The feedback from both improving engagement students and the rest of the learners to this statement suggested that they had mixed feelings towards peer comparisons. Some comments from students who either strongly agreed,
agreed or were undecided in their responses included: “I
don’t care how everyone else is doing”, “Why would I compare myself to other people”, “Other peoples’ timings are irrelevant to me”and “I wasn’t particularly interested in this information”. Although some studies have presented cases where stu-dents could be averse to peer comparisons or where it could lead to poor diversity of student navigation [14], [24], the lit-erature has also highlighted the benefits of peer compari-sons in learning. For example, the evaluation of Progressor found that through peer comparisons, the stronger students provided trails that the rest of the learners could follow [28]. The evaluation of Mastery Grids found that 54.2 percent of students felt motivated through peer comparisons [40], and the evaluation of SAM showed that showed that students were in favor of seeing what peers were doing during the course [22].
5.3.2 Perceived Understandings of the Visual Narratives
To determine how well students were able to follow and understand the message communicated to them through their visual narratives, student responses and opinions to
statement 4 in the questionnaire were analyzed:I was able to
[image:10.565.293.535.45.172.2]follow the story provided by the visual narrative and I was able to obtain a good understanding about my own and fellow students’ course related activities. The statement addressed learners’ understanding of the message communicated by their per-sonal visual narratives. The responses, displayed in Fig. 9, show that 67 and 71 percent of the students (who improved their engagement) agreed or strongly agreed with this state-ment in the 2013-2014 and 2014-2015 academic years respec-tively. Two extra slice transformations (through additional mappings) were generated and added to the students’ visual narratives in 2014-2015, which may explain the slightly more positive responses to this statement in that academic year. The extra slice transformations presented the breakdown of the students’ completed activities and
showed students who had similar engagement levels. Over-all, the responses to this statement (from learners with higher visual narrative interactions) indicated that these students believed that the visual narratives were effective in communicating the intended message. Again, the responses were mixed from amongst the rest of the class students, with 47 and 48 percent agreeing or strongly agreeing with the statement in the 2013-2014 and the 2014-2015 academic years respectively.
A chi-square test for independence was conducted between the responses from the two student groupings. There was no statistically significant association between the responses of the two sets of students, x2ð4Þ ¼ 7:55,
p ¼ :109. The association was small to moderate (Cohen,
1988), Cramer’s V¼ :217. From the analysis of the
responses, it can be seen that more of the students with a higher number of interactions with their visual narratives (improving engagement students) believed they could fol-low their visual narratives. Nevertheless, the responses from the rest of the class students consisted of more stu-dents that agreed or strongly agreed with this statement than disagreed or strongly disagreed with it. Hence there was no relationship between the student groupings and their responses.
From the students that disagreed, strongly disagreed or were undecided regarding the statement, it was inter-esting and at the same time important to note that none of their comments indicated that they had any difficulties understanding the message in their visual narratives. On the contrary, many of their comments expressed con-cerns about how the engagement level was calculated. For example, comments from these students included: “Engagement breakdown values didn’t seem to represent actual engagement but focused more how much time was spent on tasks” and “The engagement calculation did not include some of the later tasks”. Regarding the latter comment, the engagement score did not include the final task as no fur-ther engagement notification emails were to be sent. Overall these comments do not reflect students’ inability to understand the message. Nevertheless, the concern regarding the engagement level calculation has been taken into consideration by AMAS. Findings from OLE evaluations have highlighted that students reported diffi-culties in understanding the data presented through visu-alizations and at times misinterpreting it [22], [42], [45], [53], which was never suggested by any of AMAS stu-dents after using their visual narratives.
5.3.3 Visual Narrative Usage Patterns
Students’ visual narrative usage patterns were analyzed at various times throughout the course when their engagement improved. Usage patterns were identified by examining stu-dent logged data (namely examining when and how often students viewed their visual narratives following a notifica-tion). This part of Analysis 3 examines how the learners that received a below average engagement level notification inter-acted with their visual narratives immediately after receiving the notification. It also examines the percentage of interactions that these students had with their visual narrative against overall course interactions during the period when their engagement improved. The aim of this assessment was to determine if the learners were drawn to their visual narratives to understand a below average engagement level notification and whether these students continually visited their narra-tives as they worked through the course content.
This analysis found that in the 2014-2015 academic year, 71 percent of the improving engagement students executed at least half of their total visual narrative interactions on the first day after reading a below average engagement level notification. In the 2013-2014 academic year, this figure was 63 percent. From the students that received a below average engagement level notification but did not subsequently improve their engagement to the same degree across both academic years, 20 percent executed half of their visual interactions on the day they received the notification. This 20 percent of learners did show an increase in course engagement, however, it was not to the same degree as the improving engagement students.
Following on, this analysis examined students with high visual narrative usage to determine their visual narrative interactions as a percentage of overall course interactions. It also examined whether these students always visited all narrative slices of their visual narratives or focused on cer-tain slices, or whether it was a combination of both. The analysis found that at least one-fifth of the total interactions with the course was dedicated to the visual narratives for 67 percent of the improving engagement students across both academic years. The examination of the learner logged data for the improving engagement students showed that visual narrative interactions at the start of engagement periods involved all narrative slices and slice transformations. Dur-ing later revisits durDur-ing the same engagement periods the students focused more on the engagement breakdown and task completion narrative slices and transformations where learners could view updates instead of navigating and read-ing the entire story.
[image:11.565.32.267.44.173.2]These findings suggested that over two-thirds of the improving engagement students who enhanced their course engagement used their visual narrative as the first place to go to understand the reasons behind receiving a below aver-age engaver-agement level notification. It also showed that most of the improving engagement students had a minimum of 20 percent of their overall course interactions, during the period when their engagement improved, dedicated to their visual narratives. These usage patterns with the visual nar-ratives as the improving engagement students worked through their tasks (together with the responses to the ques-tionnaire) indicated that improving engagement learners benefitted from their visual narratives. In addition,
dedicating one-fifth of their total interactions to their visual narrative throughout the course suggested a meaningful intent when accessing their visual narratives.
5.3.4 Findings from Analysis 3
The findings from Analysis 3 showed that the perceptions of learners towards their visual narratives were positive, espe-cially from the improving engagement students. These learners highlighted through their comments that the visual narratives supported their engagement and mentioned the usefulness of the slice transformations. Further evidence indicating the positive perception was highlighted from the analysis of the student logged data which showed that these students continuously returned to their visual narra-tives as they worked through the course.
The feedback from statement 4 (understanding the visual narratives) indicated that learners believed that they could understand and follow the message communicated in the visual narratives. In addition, the findings that showed that the majority of improving engagement students immedi-ately visited their visual narratives following a below aver-age engaver-agement level notification, provided evidence that the visual narratives brought them value.
As mentioned in the Research Approach section of this paper, it was not possible to conduct further forms of quali-tative analysis. Nevertheless, the evidence from Analysis 3 including the qualitative analysis that was conducted through student opinions allowed clear conclusions to be drawn regarding student perceptions towards their visual narratives and whether they found them beneficial.
6
C
ONCLUSION ANDF
UTUREW
ORKThis paper introduced the VisEN framework supporting the construction and consumption of novel explorable visual narratives personalized to students using an adaptive OLE. VisEN was used to introduce explorable visual narratives into an adaptive OLEs, specifically to the AMAS OLE. The evaluation discussed in this paper focused on 1) assessing the impact that the visual narratives had on supporting learners to engage with their course content using AMAS, 2) student perceptions and understandings of their visual narratives, and 3) student usage patterns of their visual nar-ratives. The evaluation also assessed the impact that visual narrative usage had on the grades achieved by the students. One study with three sets of analyses was conducted using student logged data, post-course questionnaire responses, student opinions, and the grades achieved by the 233 under-graduate students over two successive academic years. The study found that the visual narratives had a positive impact on learners, especially improving engagement students, in supporting them to engage with the course. It showed that the students who improved their engagement levels throughout the course had a positive perception of their visual narratives. Student feedback showed that the mes-sage communicated via the visual narratives was perceived to be clearly understood by learners. Overall the findings from the study showed that the visual narratives had a posi-tive impact in supporting students to improve their course engagement through a personalized message that was eas-ily understood. These findings showed that explorable
visual narratives can bring value to students using OLEs, specifically adaptive OLEs.
The future work will focus on human-computer interac-tion studies to analyze further the impact of visual narra-tives in online learning. This will be conducted by asking students to reflect on the visual narratives as they use the system. The evaluation showed a strong positive correlation between visual narrative usage and course engagement for the improving engagement students and highlighted that the majority of them repeatedly visited their visual narra-tives as they worked through their tasks. It also showed that 71 percent of them believed the visual narratives motivated them to engage. Nevertheless, factors such as students improving their engagement as they progress through the course, or clicking on various links to get used to the system can not be discounted. By asking students about when and how the visual narratives supported them as they use the system will provide more clarity regarding the exact bene-fits of the visual narratives. Finally, some learners com-mented that their engagement score did not include the optional resources that they used. Although all of the stu-dents were made aware of this at the start of the course, AMAS is currently being updated to factor in the optional resources into the engagement calculation.
A
CKNOWLEDGMENTSThis research is supported by the ADAPT Centre for Digital Content Technology under the SFI Research Centre’s Pro-gram (Grant 13/RC/2106) and is co-funded under the Euro-pean Regional Development Fund.
R
EFERENCES[1] D. Albert, A. Nussbaumer, and C. M. Steiner, “Towards generic visualisation tools and techniques for adaptive e-learning,” in Proc. 18th Int. Conf. Comput. Educ. ICCE, 2010, pp. 61–65.
[2] K. E. Arnold and M. D. Pistilli, “Course signals at Purdue,” in Proc. 2nd Int. Conf. Learning Analytics Knowl., 2012, pp. 267–270. [3] I. Arroyo, et al., “Repairing disengagement with non-invasive
interventions,” in Proc. Conf. Artif. Intell. Educ. Building Technol. Rich Learning Contexts That Work, 2007, pp. 195–202.
[4] M. Austin,Useful Fictions: Evolution, Anxiety, and the Origins of Lit-erature. Lincoln, NE, USA: Univ. Nebraska Press, 2011.
[5] A. Bakharia and S. Dawson, “SNAPP: A bird’s-eye view of tempo-ral participant interaction,” inProc. 1st Int. Conf. Learning Analytics Knowl., 2011, pp. 168–173.
[6] L. Barolli, A. Koyama, A. Durresi, and G. De Marco, “A web-based e-learning system for increasing study efficiency by stimu-lating learner’s motivation,” Inf. Syst. Frontiers, vol. 8, no. 4, pp. 297–306, Sep. 2006.
[7] S. Bateman, R. L. Mandryk, C. Gutwin, A. Genest, D. McDine, and C. Brooks. “Useful junk?: The effects of visual embellishment on comprehension and memorability of charts,” in Proc. SIGCHI Conf. Human Factors Comput. Syst., 2010, pp. 2573–2582.
[8] P. Brusilovsky, I. H. Hsiao, and Y. Folajimi, “QuizMap: Open social student modeling and adaptive navigation support with TreeMaps,” inProc. Eur. Conf. Technol. Enhanced Learning, 2011, pp. 71–82. [9] S. Bull, “Negotiated learner modelling to maintain today’s learner
models,”Res. Practice Technol. Enhanced Learning, vol. 11, no. 1, 2016, Art. no. 10.
[10] S. Bull, B. Ginon, C. Boscolo, and M. Johnson. “Introduction of learning visualisations and metacognitive support in a persuad-able open learner model,” inProc. 6th Int. Conf. Learning Analytics Knowl., 2016, pp. 30–39.
[12] S. Bull and J. Kay, “SMILI: A framework for interfaces to learning data in open learner models, learning analytics and related fields,” Int. J. Artif. Intell. Educ., vol. 26, no. 1, pp. 293–331, Jan. 2016.
[13] S. Bull and J. Kay, “Open learner models,” inAdvances in Intelli-gent Tutoring Systems. Berlin, Germany: Springer, 2010, pp. 301– 322.
[14] K. Burleson, C. W. Leach, and D. M. Harrington, “Upward social comparison and self-concept: Inspiration and inferiority among art students in an advanced programme,”British J. Soc. Psychology, vol. 44, no. 1, pp. 109–123, 2005.
[15] S. K. Card, J. D. Mackinlay, and B. Shneiderman,Readings in Infor-mation Visualization: Using Vision to Think. Burlington, MA, USA: Morgan Kaufmann. 1999.
[16] S. Charleer, S. Odriozola, J. Luis, J. Klerkx, and E. Duval, “LARAe: Learning analytics reflection & awareness environment,” inProc. CEUR Workshop Proc., 2014, pp. 85–87.
[17] A. Essa and H. Ayad, “Improving student success using predic-tive models and data visualisations,” Res. Learning Technol., vol. 20, p. 19191, 2012.
[18] M. H. Falakmasir, I.-H. Hsiao, L. Mazzola, N. Grant, and P. Brusilovsky, “The impact of social performance visualiza-tion on students,” inProc. IEEE 12th Int. Conf. Advanced Learn-ing Technol., 2012, pp. 565–569.
[19] Gapminder, 2005. [Online]. Available: http://www.gapminder. org. 2005.
[20] J. K. Gilbert. “Visualization: A metacognitive skill in science and science education,” In Visualization in Science Education. Amsterdam, Netherlands: Springer, 2005, pp. 9–27..
[21] B. Ginon, C. Boscolo, M. D. Johnson, and S. Bull. “Persuading an open learner model in the context of a university course: An exploratory study,” inProc. Int. Conf. Intell. Tutoring Syst., 2016, pp. 307–313.
[22] S. Govaerts, K. Verbert, E. Duval, and A. Pardo, “The student activity meter for awareness and self-reflection,” in Proc. ACM Annu. Conf. Extended Abstracts Human Factors Comput. Syst., 2012, pp. 869–884.
[23] J. Grann and D. Bushway, “Competency map: Visualizing student learning to promote student success,” inProc. 4th Int. Conf. Learn-ing Analytics Knowl., 2014, pp. 168–172.
[24] J. Guerra, R. Hosseini, S. Somyurek, and P. Brusilovsky, “An intel-ligent interface for learning content: Combining an open learner model and social comparison to support self-regulated learning and engagement,” in Proc. 21st Int. Conf. Intell. User Interfaces, 2016, pp. 152–163.
[25] J. Heer and B. Shneiderman, “Interactive dynamics for visual ana-lysis,”Queue, vol. 10, no. 2, Feb. 2012, Art. no. 30.
[26] M. Horn, “Report that says online learning growth is slowing misses big picture,” 2015. [Online]. Available: https://www. forbes.com
[27] I.-H. Hsiao, F. Bakalov, P. Brusilovsky, and B. K€onig-Ries, “Progressor: social navigation support through open social stu-dent modeling,”New Rev. Hypermedia Multimedia, vol. 19, no. 2, pp. 112–131, Jun. 2013.
[28] I.-H. Hsiao and P. Brusilovsky, “Motivational social visualizations for personalized e-learning,” inProc. Eur. Conf. Technol. Enhanced Learning, 2012, pp. 153–165.
[29] S.H. Jin, “Using visualization to motivate student participation in collaborative online learning environments,”J. Educ. Technol. Soc., vol. 20, no. 2, pp. 51–62, Apr. 2017.
[30] J. Jovanovic, D. Gasevic, C. Brooks, V. Devedzic, and M. Hatala, “LOCO-analyst: A tool for raising teachers’ awareness in online learning environments,” in Proc. Eur. Conf. Technol. Enhanced Learning, 2007, pp. 112–126.
[31] J. Kay and B. Kummerfeld, “Creating personalized systems that people can scrutinize and control: Drivers, principles and experi-ence,”ACM Trans. Interactive Intell. Syst., vol. 2, no. 4, Dec. 2012, Art. no. 24.
[32] R. Kosara, H. Hauser, and D. L. Gresh, “An interaction view on information visualization,” inProc. EUROGRAPHICS State-of-the-Art Report, 2003, pp. 123–137.
[33] R. Kosara and J. Mackinlay, “Storytelling: The Next Step for Visu-alization,”Comput., vol. 46, no. 5, pp. 44–50, May 2013.
[34] G. D. Kuh, “Assessing what really matters to student learning inside the national survey of student engagement,”Change Mag. Higher Learning, vol. 33, no. 3, pp. 10–17, 2001.
[35] B. Kump, C. Seifert, G. Beham, S. N. Lindstaedt, and T. Ley, “Seeing what the system thinks you know: Visualizing evidence in an open learner model,” inProc. 2nd Int. Conf. Learning Analytics Knowl., 2012, pp. 153–157.
[36] K. Kuosa, et al., “Interactive visualization tools to improve learn-ing and teachlearn-ing in online learnlearn-ing environments,”Int. J. Distance Educ. Technol., vol. 14, no. 1, pp. 1–21, Jan 2016.
[37] C. Y. Law, J. Grundy, A. Cain, R. Vasa, and A. Cummaudo, “User Perceptions of using an open learner model visualisation tool for facilitating self-regulated learning,” inProc. 19th Australasian Com-put. Educ. Conf., Jan. 2017, pp. 55–64.
[38] D. T. Le, “Bringing data to life into an introductory statistics course with gapminder,”Teaching Statistics, vol. 35, no. 3, pp. 114– 122, Jun. 2013.
[39] B. Lee, R. H. Kazi, and G. Smith, “SketchStory: Telling more engaging stories with data through freeform sketching,” IEEE Trans. Vis. Comput. Graph., vol. 19, no. 12, pp. 2416–2425, Dec. 2013.
[40] T. D. Loboda, J. Guerra, R. Hosseini, and P. Brusilovsky, “Mastery grids: An open source social educational progress visualization,” inProc. Eur. Conf. Technol. Enhanced Learning, 2014, pp. 235–248. [41] Y. Long and V. Aleven, “Supporting students’ self-regulated
learning with an open learner model in a linear equation tutor,” in Proc. Int. Conf. Artif. Intell. Educ., 2013, pp. 219–228.
[42] S. Lonn, S. J. Aguilar, and S. D. Teasley, “Investigating student motivation in the context of a learning analytics intervention dur-ing a summer bridge program,”Comput. Human Behavior, vol. 47, pp. 90–97, Jun. 2015.
[43] A. Mabbott and S. Bull, “Student preferences for editing, persuad-ing, and negotiating the open learner model,” inProc. Int. Conf. Intell. Tutoring Syst., 2006, pp. 481–490.
[44] L. P. Macfadyen and S. Dawson, “Mining LMS data to develop an ‘early warning system’ for educators: A proof of concept,” Com-put. Educ., vol. 54, no. 2, pp. 588–599, Feb. 2010.
[45] M. May, S. George, and P. Prev^ot, “TrAVis to enhance students’ self-monitoring in online learning supported by computer-medi-ated communication tools,”Comput. Inf. Syst. Ind. Manage. Appl., vol. 3, pp. 623–634, 2011.
[46] R. Mazza and C. Milani, “Gismo: A graphical interactive student monitoring tool for course management systems,” in Proc. Int. Conf. Technol. Enhanced Learning, 2004, pp. 1–8.
[47] A. Merceron and K. Yacef, “Tada-ed for educational data mining,” Interactive Multimedia Electron. J. Comput.-Enhanced Learning, vol. 7, no. 1, pp. 267–287, May 2005.
[48] J. Mostow, J. Beck, H. Cen, A. Cuneo, E. Gouvea, and C. Heiner, “An educational data mining tool to browse tutor-student interac-tions: Time will tell,” inProc. Workshop Educ. Data Mining National Conf. Artif. Intell., 2005, pp. 15–22.
[49] E. Popescu, “Project-based Learning with eMUSE,” inProc. Int. Conf. Web-Based Learning, 2012, pp. 41–50.
[50] J. A. Ruiperez-Valiente, P. J. Munoz-Merino, and C. D. Kloos, “A~ demonstration of ALAS-KA: A learning analytics tool for the khan academy platform,” in Proc. Eur. Conf. Technol. Enhanced Learning, 2014, pp. 518–521.
[51] J. L. Santos, S. Charleer, G. Parra, J. Klerkx, E. Duval, and K. Verbert, “Evaluating the use of open badges in an open learning environment,” in Proc. Eur. Conf. Technol. Enhanced Learning, Sep. 2013, pp. 314–327.
[52] J. L. Santos, S. Govaerts, K. Verbert, and E. Duval, “Goal-oriented visualizations of activity tracking,” inProc. 2nd Int. Conf. Learning Analytics Knowl., 2012, pp. 143–152.
[53] J. L. Santos, K. Verbert, S. Govaerts, and E. Duval, “Addressing learner issues with StepUp!,” inProc. 3rd Int. Conf. Learning Ana-lytics Knowl., 2013, pp. 14–22.
[54] A. Satyanarayan and J. Heer, “Authoring narrative visualizations with ellipsis,”Comput. Graph. Forum, vol. 33, no. 3, pp. 361–370, Jun. 2014.
[55] O. Scheuer and C. Zinn, “How did the e-learning session go? The student inspector,”Frontiers Artif. Intell. Appl., vol. 158, 2007, Art. no. 487.
[56] E. Segel and J. Heer, “Narrative Visualization: Telling stories with data,”IEEE Trans. Vis. Comput. Graph., vol. 16, no. 6, pp. 1139– 1148, Nov. 2010.