METEOROLOGICAL SERVICE
SOlAR-RADIAl ION OBSERVATIONS
1985
ME1692
U,D.C
551.506,3
551.521.12(419.6)
DUBLIN
1987
-.. , ..
c;\.~;.= .~',.
,~.. , '.
, .\.~----
--
'
,
,CONTENTS
1. Introduction
2. Solar Radiation Network
3.
Instru:nents used in 10
il5
4. Tables for 1985
Table
1
Table
2
Table
3
Table
4
Table
5
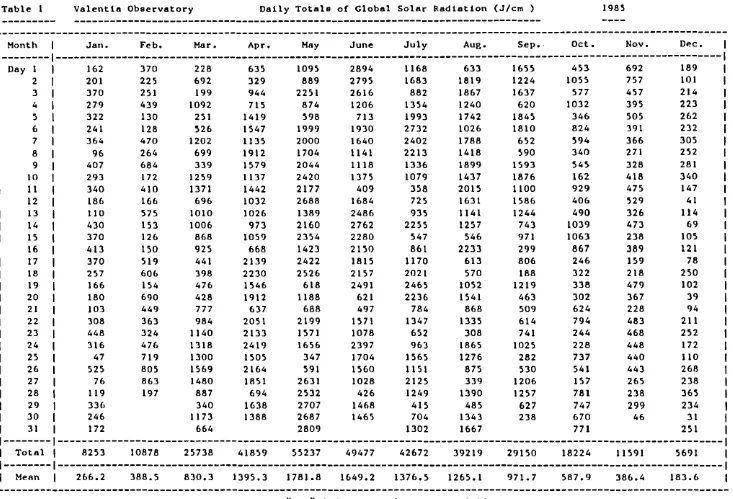
Daily Totals of Global Solar Radiation at Valentia
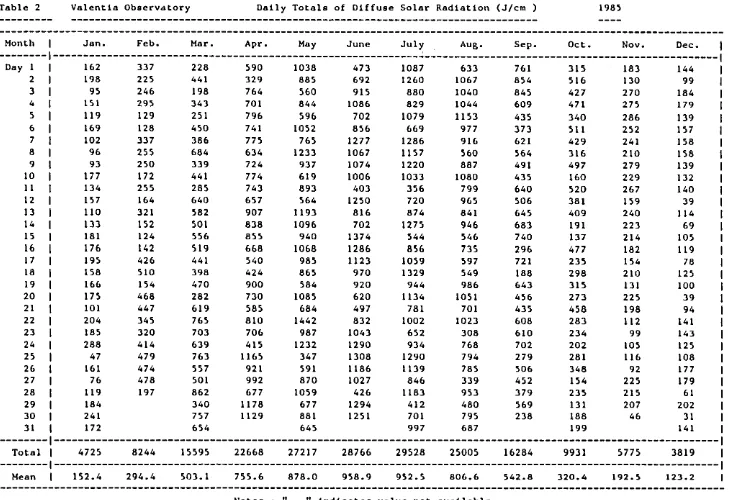
Daily Totals of Diffuse Solar Radiation at Valentia
Daily Totals of Radiation Balance at Valentia
Instantaneous Values of Direct Solar Radiation at
~1orrnl
Incidences at Valentia
Daily Totals of Direct Solar Radiation at llorrnl
Incidence at '1alentia
1
2
3
4
5
6
7
11
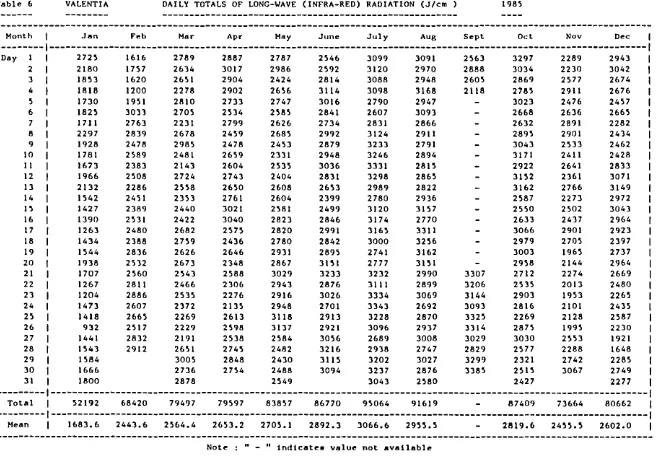
Table 6 Daily Totals of
Long-~~ve(Infra-Red) Radiation at Valentia
12
Table 7 Daily Totals of Global Solar Radiation at Kilkenny
14
Table 8 Daily Totals of Diffuse Solar Radiation at Kilkenny
15
Table 9 Daily Totals of Global Solar Radiation at Birr
16
Table
10
Daily Totals of Diffuse Solar Radiation at 3irr
Table 11 Daily Totals of Global Solar Radiation at Dublin Airport
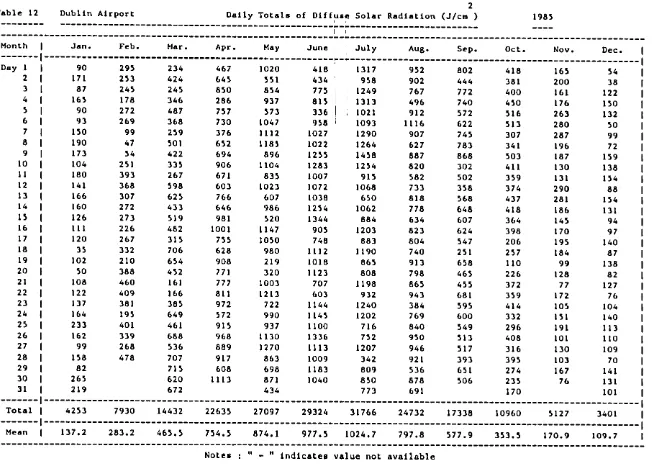
Table 12 Daily Totals of Diffuse Solar Radiation at Dublin Airport
Table
13
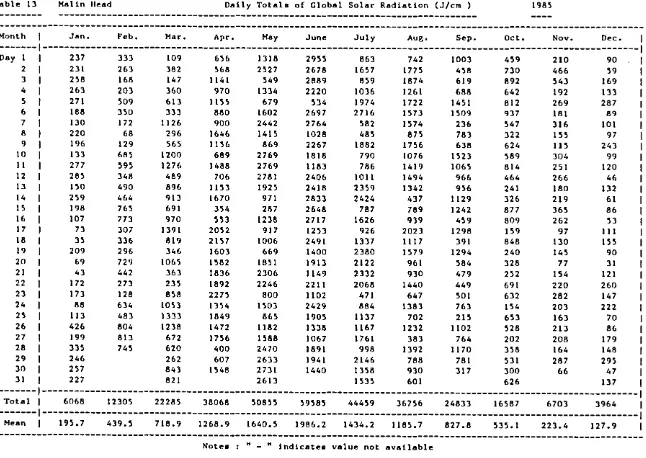
Daily Totals of Global Solar Radiation at r1alin Head
Table 14 Daily Totals of Diffuse Solar Radiation at r1alin ;lead
Table 15 Daily Totals of Global Solar Radiation at Clones
Table 16 Daily Totals of Diffuse Solar Radiation at Clones
Table 17 Daily Totals of Global Solar Radiation at Belmullet
~
"I\l-'"
- "{,"J\\;
c.,
VIC_~_
• --j:l).--
- / •'-~ ,
....
~ ... ~.,
,
-,
--•
17
11l
19
20
21
22
23
1
-Introduction
Solar radiation observations by the
~rishMeteorological Service
c~encedin 1954 when the first pyranometer was installed at Valentia Observatory. At
present, global and diffuse radiation instrlL'1Jents are installed at Valentia
Observatory, Kilkenny, Birr, Dublin Airport, Clones and !'.alin Head. Global.
radiation only is measured at Belmullet. Diffuse radiation is measured
using a pyranometer and shade ring to screen the pyranometer from the direct
sun; correction factors are applied to allow for the portion of the sky obscured
by the ring. Kipp and Zonen
CMn
pyranometers are used throughout the network.
Data are recorded by strip chart recorders and, for all global and some diffuse
installations, by electronic integrators.
In
addition to the global and diffuse instruments Valentia Observatory is also
equipped with the
following:-Eppley lIomal :rncidence Pyrheliometer and a solar tracker for the measurement
of Direct Sun radiation.
Eppley Precision Radiometer (Pyrgeometer) for the measurement of Terrestrial
Downward Tnfra Red radiation.
Funk
net pyrradiometer for the measurement of tlet Radiation Balance.
Kipp and Zonen Linke-Feussner Actionmeter No. 93 with
0:;1'
RG
2
and RGg filters
for the measurement
o~Atmospheric eurbidity.
Volz sun photometer for the measurement of Atmospheric Turbidity.
An Angstrom Compensation Pyrheliometer, tlo. 548, is maintained as a national
reference instru.'1Jent and
is
regularly calibrated against the Horld Radiometric
Reference standard at Horld Meteorological Organisation international comparisons.
All the network pyranometers and pyrheliometers are calibrated using the
Angstrom Pyrheliometer as a standard reference.
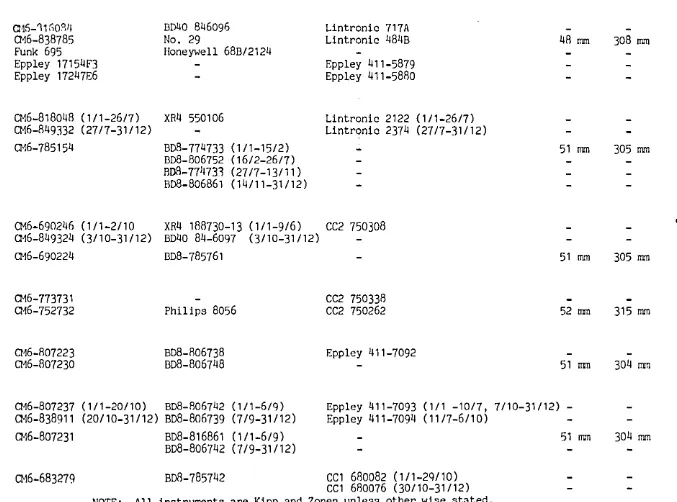
A complete list of instruments in use is contained in Page 3. A detailed
description of each site, including obstruction diagrams, will be found in [1J.
Further information on solar radiation measurements and the Irish network is
available in
(21.
Only daily totals are published, apart from spot values of direct sun at norral
incidence (Table 4). Hourly values may be had, on request, from The Director,
:rrish Meteorological Service, Glasnevin Hill, Dublin 9.
References
(1]
"Solar Radiation Observations 19R3 and 1984" nleteorological
Service 1981).
2
-G 1981
Clones. D 1981
Dubli n
. e
G 1971
Birr
D 1979
Kilkenny
e
G
1969
D 1979
G 1976
D 1976
Scale 0
50
100 Kilometres
r=..-__ ._ -
-
..
Valentia
Global
Diffuse
fulance
Infra-Red
Direct-Sun
Kilkenny
Global
Diffuse
Birr
Global
Diffuse
Dublin Airport
Global
Diffuse
Malin Head
Global
Diffuse
Clones
Global
Diffuse
Ilelmullet
Global
Table of Instruments in use - 1985
Q1S-'11(iOO,II
CM6-838785
Funk 695
Eppley 17154F3
Eppley 172471':6
BD40 846096
No. 29
Honeywell 68B/2124
CM6-818048 (1/1-26/7)
XR4 550106
CM6-849332 (27/7-31/12)
CM6-785154
BD8-774733 (1/1-15/2)
BD8-806752 (16/2-26/7)
RoB-77
11731
(2717-13/11)
B08-806861 (14/11-31/12)
Lintronic 717A
Lintronic 484B
Eppley 411-5879
Eppley 411-5880
Lintronic 2122 (1/1-26/7)
Lintronic 2374 (27/7-31/12)
CM6-690246 (1/1-2/10
XR4 188730-13 (1/1-9/6)
CC2 750308
CM6-849324 (3/10-31/12) BD40 84-6097 (3/10-31/12)
CM6-690224
BD8-785761
CM6-773731
CM6-752732
CM6-807223
CM6-807230
Philips 8056
BD8-806738
B08-806748
CC2 750338
CC2 750262
Eppley 411-7092
48 mm
51 mm
51 mm
52 mm
51 mm
CM6-807237 (1/1-20/10)
BD8-806742 (1/1-6/9)
CM6-83B911 (20/10-31/12) BD8-B06739 (7/9-31/12)
Eppley 4117093 (1/1 10/7, 7/1031/12)
-Eppley 411-7094 (11/7-6/10)
CM6-B07231
CM6-6B3279
BD8-816B61 (1/1-6/9)
BDB-B06742 (7/9-31/12)
BDB-785742
CC1 680082 (1/1-29/10)
CC1 680076 (30/10-31/12)
NOTE:
All instruments are Kipp and Zonen unless other wise stated.
51 mm
308 mm
305 mm
w
305 mm
315 mm
304 mm
[image:5.833.105.782.69.571.2]Table I Valentia Observatory
2
Daily Total. of Global Solar Radiation (J/cm ) 198~
---1
Month1
Jan. Feb. Mar. Apr. May June July Aug. Sep. Oct. Nov. Dec.1---1---1
Day I1
162
370
228
635
1095
2894
1168
633
1655
4B
692
189
1
2
1
201
225
692
329
889
2795
1683
1819
1224
1055
757
101
1
3
1
370
251
199
944
2251
2616
882
1867
1637
577
457
214
1
4
1
279
439
1092
715874
1206
13~41240
620
1032
395
223
1
5
1
322
130
251
1419
598
713
1993
1742
1845
346
505
262
1
6
241
128
526
1547
1999
1930
2732
1026
1810
824
391
232
1
7
364
470
1202
1135
2000
1640
2402
1788
652
594
366
305
1
8
96
264
699
1912
1704
1141
2213
1418
~90340
271
252
1
9
407
684
339
1579
2044
1118
1336
1899
1593
545
328
281
1
10
293
172
1259
1137
2420
1375
1079
1437
1876
162
418
340
1
II340
410
1371
1442
2177
409
358
2015
1100
929
475
147
12
186
166
696
1032
2688
1684
725
1631
1586
406
529
41
13
110
575
1010
1026
1389
2486
935
1141
1244
490
326
114
14
430
153
1006
973
2160
2762
2255
1257
743
1039
473
69
15
16
17
18
19
20
21
22
23
24
25
26
27
28
29
30
31
Total
Mean
370
413
370
257
166
180
103
308
448
316
47
525
76
119
336
246
172
8253
266.2
126
150
519
606
154
690
449
363
324
476
719
805
863
197
10878
388.5
868
925
441
398
476
428
777
984
1140
1318
1300
1569
1480
887
340
1173
664
25738
830.3
1059
668
2139
2230
1546
1912
637
2051
2133
2419
1505
2164
1851
694
1638
1388
41859
1395.3
2354
1423
2422
2526
618
1188
688
2199
1571
1656
347
591
2631
2532
2707
2687
2809
55237
1781.8
2280
2150
1815
2157
2491
621
497
1571
1078
2397
1704
1560
1028
426
1468
1465
49477
1649.2
547
861
1170
2021
2465
2236
784
1347
652
963
1565
1151
2125
1249
415
704
1302
42672
1376.5
546
2233
613
570
1052
1541
868
1335
308
1865
1276
875
339
1390
485
1343
1667
39219
1265.1
Notes : II - I. indicates value not available
971
299
806
188
1219
463
509
614
741
1025
282
530
1206
1257
627
238
29150
971.7
1063
867
246
322
338
302
624
794
244
228
737
541
157
781
747
670
771
18224
587.9
238
389
159
218
479
367
228
483
468
448
440
443
265
238
299
46
11591
386.4
[image:6.835.38.771.46.545.2]Table 2 Valentia Observatory
2
Daily Totals of Diffuse Solar Radiation (J/cm ) 1985
1
Month1
Jan. Feb. Mar. Apr. May June July. Aug. Sep. Oct. Nov. Dec.---1---~---Day I
2 3 4 5 6 7 8 9 10 II 12 13 14 15 16 17 18 19 20 21 22 23 24 25 26 27 28 29 30 31 Total
1---1
Mean162 198 95 lSi 119 169 102 96 93 177 134 151 110 133 181 176 195 158 166 IlS 101 204 185 288 47 161 76 119 184 241 172 4725 152.4 337 225 246 295 129 128 337 255 250 172 255 164 321 152 124 142 426
SlO
154 468 447 345 320 414 479 474 478 197 8244 294.4 228 441 198 343 251 450 386 684 339 441 285 640 582 501 556 Sl9 441 398 470 282 619 765 703 639 763 557 501 862 340 757 654 15595 503.1 590 329 764 701 796 741 775 634 724 774 743 657 907 838 855 668 540 424 900 730 585 810 706 415 1165 921 992 677 1178 1129 22668 755.6 1038 885 560 844 596 1052 765 1233 937 619 893 564 1193 1096 940 1068 985 865 584 1085 684 1442 987 1232 347 591 870 1059 677 881 645 27217 878.0 473 692 915 1086 702 856 1277 1067 1074 1006 403 1250 816 702 1374 1286 1123 970 920 620 497 832 1043 1290 1308 1186 1027 426 1294 12S1 28766 958.9 1087 1260 880 829 1079 669 1286 1157 1220 1033 356 720 874 1275 544 8% 1059 1329 944 1134 781 1002 652 934 1290 1139 846 1183 412 701 997 29528 952.5 633 1067 1040 1044 1153 977 916 560 887 1080 799 965 841 946 546 735 597 549 986 1051 701 1023 308 768 794 785 339 953 480 795 687 25005 806.6Notes : " - " indicates value not available
[image:7.833.42.782.50.550.2]Tabl .. 3 Valentia Observatory
2
Dally Totals of Radiation Balance (J/cm ) 1985
\ Month \ Jan. Feb. Mar. Apr. May June July Aug. Sep. Oct. Nov. Dec.
---\---Day 1
1
66 34 88 254 489 1156 593 274 649 260 -56 -372 \ -197 102 191 180 474 1006 903 844 637 494 25 -4
3
1
-347 118 -21 539 882 1098 382 971 842 113 60 -1644 \ -417 -4 281 348 356 556 702 677 346 377 169 -125
5
1
-405 -3 95 676 298 332 884 832 696 111 2 -1586
1
-290 -29 139 634 940 933 1229 513 650 187 -11 -757
1
-307 43 280 544 909 807 1081 767 336 64 III -1698 \ -77 21 201 836 740 541 1192 601 350 76 38 -86
9 \ -143 106 217 739 1009 520 702 886 729 222 -77 8
10 -149 12 402 476 914 670 524 654 699 78 -59 -130
11 -293 -13 292 622 891 203 233 907 451 366 131 -61
12 -241 -15 254 470 1036 904 428 716 696 199 19 -4
13 -115 11 331 451 500 1104 402 458 655 203 75 70
14 -252 -93 286 417 914 1183 1077 607 225 342 -113 -69
15 -295 -108 203 563 946 909 283 271 414 217 -39 27
16 -322 -36 283 361 618 1027 436 965 202 178 -82 -5
17 -338 91 164 841 1092 957 620 410 477 137 64 -52
18 -115 27 212 733 1255 1026 1012 301 136 162 -120 -259
19 -73 43 114 618 250 1339 1251 529 359 148 -349 -129
\ 20 100 112 168 765 537 357 964 849 229 30 -207 -54
\ 21 -65 -25 328 165 333 337 419 295 265 60 -158 -140
\ 22 -122 116 323 682 1108 771 628 568 308 137 -251 -114
1
23 -5 III 409 724 836 560 387 109 350 5 -276 -242\ 24 -30 16 467 767 865 1103 564 873 431 -80 -223 -143
1
25 -141 206 349 576 197 890 794 591 169 -126 -225 -1461
26 -46 160 501 994 373 834 569 448 288 147 -214 -2281
27 -14 304 428 717 1468 511 894 150 418 -13 -28 -3511
28 30 42 386 273 1094 263 538 603 287 198 -104 -3771
29 32 212 755 1148 770 206 256 346 150 50 -130\ 30 -8 483 583 1033 697 389 700 139 94 6 -59
\ 31 \ 33 304 1082 663 653 126 -155
\---1---\ Total \ -4546 1349 8370 17303 24587 23364 20949 18278 12779 4662 -1842 -3561 \
\---\---\
7
-Tobie 4
DIRECT SOLAR RADIATION AT tlORMAL INCIDENCES
INSTANTANEOUS BALUES
(mW/cm2)1985
,
RADIATION
CLOUD
w ; w
u n:
>-
z
I
:::>-< -<
-
Vl0 >-
-I
w Vl>- Vl
'"
n: w>-0
-
-
0-
:::> n:>-Z -< 0 Vl N
-'"
w >- C---<
-
Vl Cl,
Cl n: -< ...J...J I N
~-
n:'"
n: :::> n: n:-
>-I >- - n:
-
0-
Vl w :::> Clz
>- w
-
E -< ...J Vl C- O-
w :::>z
::;;z
'"
-
W 0 ...J 0 W ::;; C- Vl C- O0
-
w-
...J W W W n: w -<-
>-;;:
::;; >- N -< U
'"
>-'"
C- >- > >>-Xl0
l
Xl0
l
Xl0
l
Xl0
l
hPo
°c
hPo
Kbl
Okto
Jon
I
3
1128
75.1
3.87
664
478
572 I 386
1018
6.9
6.6
88
FcSc
Tr
3
1328
77.2
4.47
598
445
523
I
362
1017
7.5
6.7
70
FcSc
Tr
1120
75.0
I395
1015
60
CuFc
Tr
5
3.84
664
486
574 I
6.0
5.6
7
1400
78.8
5.08
593
444
522
I
358
I
1020
5.7
6.8
60
Fe
Tr
9
1140
74.2
3.65
696
500
597
,
400
1020
6.6
8.5
50
Cu
Tr
9
1344
77.5
4.57
650
473
564
384
1021
7.8
7.9
50
CuSc
3
10
1028
76.5
4.25
593
439
513
362
I
1025
1.6
6.2
40
Sc
Tr
11
1028
76.4
4.22
603
456
535
374
!1027
5.0
6.8
50
CuFc
Tr
14
1120
73.8
3.57
607
465
536
I
382
i
1032
4.0
5.6
20
Se
Tr
14
1336
76.2
4.16
571
449
513
372
I
1032
4.4
5.1
25
0
17
0930
79.7
5.50
253
230
239
I
201
I
1007 -1.9
4.3
16
Cu
1
17
1022
75.8
4.05
360
307
338
I257
1007 -0.7
4.4
16
Fe
Tr
17
1056
74.0
3.61
380
315
349
,265
I1007
0.0
4.4
16
0
17
1140
72.8
3.37
380
311
338
270
I
1007
,
,
0.0
4.4
16
0
26
1044
72.6
3.33
677
486
575
396
I
1003 I 5.4
7.0
30
Cu
3
26
1148
70.7
3.00
719
505
606
408
1003
5.9
6.5
30
CuFc
3
29
1340
73.1
3.43
517
348
424
276
I
1011
11.5
11.8
20
CuFc
2
,
Mor
10
1412
62.6
2.17
786
525
I
638
420
1039
11.7 9.7
35
Cu
1
11
0900
67.4
2.59
693
479
579
386
1043
5.5 7.9
45
0
11
0956
61.5
2.09
773
518
I ,630 , 414
1043
8.3 8.1
45
0
11
1124
56.1
1.79
782
518
628
414
1042
10.0 9.1
45
Cu
1
11
1332
58.9
1. 93
763
512
I
623
411
1041
10.5 8.9
45
Cu
1
11
1528
70.8
3.02
591
425
,422
347
1040
10.5 8.8
45
Cu
1
26
1012
54.5
1.72
833
555 I
,678
444
~1002
9.0 7.8
50
CuC!
Tr
26
1036
52.6
1. 64
838
552
673
443
1002
9.0 7.8
50
CuC!
Tr
26
1108
50.8
1. 58
833
550 I 669
i
444
1002
9.4 7.8
50
CuC!
2
:
,
,
Apr
!
8
1448
56.3
1. 80
740
496
597
393
995
11.2 10.1
40
CuSc
2+
9
1034
47.8
1.49
824
530
649
418
1001
9.5
8.2
40
CuSc
5
9
1348
49.5
1. 54
818
525
650
418
1002
11.01
9
•
7
40
Cu
5
18
0924
51.8
1. 61
843
540
669
;429
1022
16.0
9.6
45
Cl
2
18
1024
45.4
1.42
851
540
673
429 . 1023
16.5 10.5
45
C!
2
18
1100
42.8
1. 36
854
544
679
435
1023
16.5,10.5
45
C!
2
23
1524
56.6
1. 81
764
517
629
417
1023
13.0· 8.3
40
SeC!
2
24
0844
55.3
1. 75
800
531
649
423
1027
9.1
,
7.3
25
0
24
0932
49.1
1.53
827
538
658
436
1027
10.7 6.5
25
0
24
1034
42.8
1.36
840
546
667
440
1027
11.8 6.2 I 25
,
0
24
1428
49.0
1.52
801
526
645
424
1026
14.4 7.0
i25
0
26
1052
40.7
1. 32
834
531
,
657
419 . 1020
11.7 10.3
i60
ICuFe~_ ~_
--TobIe 4 IContd.)
,
w
u >- Z
«
«0 >->-
'"
0
-z
«
0'"
-<
-
'"
-' I N
:li-I >- -
'"
>- w-
E«
Z
"
Z"'-
W0
-
w-
-'"
>- N«
uI
xliiI
I
Moy
3
1452
49.6
1. 54
801
10
1100
36.3
1. 24
900
10
1412
43.0
1. 37
877
11
0916
46.8
1.46
836
11
1436
45.7
1 43
649
12 0940
43.5
1.38
794
12
1104
35.5
1.23
860
12
1308
36.3
1. 24
841
12
1452
47.6
1.48
711
12
1540
54.4
1.72
718
15
1444
46.0
1.44
744
17
1436
44.5
1.40
844
18
1100
34.4
1. 21
898
18
1500
47.5
1.48
848
1
e
1544
53.9
1.69
817
27
1012
37.1
1. 25
886
28
1032
34.9
1.22
880
29
1236
31.0
1. 17
869
30 0900
45.8
1.43
739
31
0908
44.6
1.40
709
31
1356
37.4
1.26
667
June
1 0904
45.0
1.41
790
1 1002
37.5
1.26
820
1 1100
32.0
1. 18
812
1 1252
31.5
1. 17
849
1
130~32.3
1. 18
828
3 1408
38.5
1.28
759
6 1424
40.2
1. 31
753
13
1404
37.2
1.25
857
l'
1336
34.0
1 .21
903
1. 1544
51.1
1. 59
834
19
1256
30.5
1.16
864
22 1432
40.7
1.32
729
22 1512
46.3
1.45
774
July
:19
0916
44.4
1.40
819
Aug
7
1356
42.4
1.35
7328
1404
43.4
1.38
825
,
R
-DIRECT SOLAR RADIATION AT I.ORMAL INCIDENCES
INSTANTANEOUS BALUES ImW/em2)
1985
RADIATION
CLOUD
w
'"
:0
-
-
w'"
'"
'"
'"
w>--
0-
:0'"
>-'"
-
a> w >- "--'"
'"
'"
«
-''"
,.
'"
:0'"
'"
-
>--
0-'"
w :0 <D Z -''"
"- 0-
w :00 -' 0 w
"
"-'"
"- 0w w w a: w
«
-
>-:i
'"
>-'"
"- >- > >>-xliiI >-xliiI xlii
1
hPo
°c
hPo
Kbl
Okto
513
634
413
1014
12.5
I
8.2
70
CuSeCi
1
573
707
453
1025
11.6
7.8
82
Cu
2
558
681
449
1025
12.2
8.7
82
FeCi
3
530
659
426
1024
13 5
9 7
,50
CuCi
Tr
535
362
444
1023
13 8
11.2
I
40
Cu
3
525
643
422
1019
13.9
10.5
25
CuCI
3+
555
I
680
444
1018
15.3
9.7
i25
'FeCI
2
540
I659
431
1018
16.0
10.3
25
f:uCI
1+
479
577
386
1017
15.5
10.9
25
,CuCI
1
484
587
393
1017
15.6
10.6
25
CuCI
1
498
604
399
1005
14.3
11.0
I15
:CuCI
2+
, 522
657
410
1023
16.0
1
14
.
0
I40
.CuSeCI
1+
I
551
I 707
443
1023
14.5
12.1
, I50
CuSe
3
541
667
426
1024
14.8
11.8
50
Cu
5
526
654
416
1023
15.0
1
1
1.3
,
50
Cu
1
559
694
441
1006
11 • 1
9.7
50
Cu
3
555
688
437
1019
13.0
i
9.650
Cu
I
4-539
676
426
1026
13.5
1
11
.
2
50
Cu
2
505
608
402
1024
17.2
10.7
50
FeCI
i
Tr
475
579
379
1025
18.4 ,11.6
I40
CI
I2
454
546
360
1026
16. 1 114. 1
40
Cu
1
I
511
628
407
1025
19.0
11.6 60
CI
,
1
522
646
414
1025
20.3
12.5 ' 60
CI
1
518
640
412
1024
20.5
12. 1
!60
0
537
667
428
1024
23.4
13.3 : 60
I0
530
654
420
1023
22.3
11. 8
I
60
,0
496
611
395
1015
24.4
1 S. 9
i
25
CuCI
I
3
495
598
396
1014
13.2
9.9: 25
Cu
5
531
664
419
1015
14.2
10.6, 50
CuSeCI
I3+
559
I
698
443
1018
13.7
10.8 : 60
CuCi
I
1
531
657
420
1019
13.5
10.9' 60
CuCi
3
531
,
I668
417
1010
15.0
13.4 ' 40
Cu
2
. 499
,
,625
396
1002
13.9
12.81 20
CuSe
5
; 487
603
383
1002
13.8
12.61 20
Cu
3
!
I
I
511
643
1
401
1007
14.4
12. 1 45
CbSe
1+
I
1
I
j
463
' 578
I
364
1009
15.4
12.9 25
CuSeCI
4I
516
1 643
,
412
998
15.5
13.5
16
~uFe,
3
,
1
I
q
-Tobl. 4 (Contd.'
DIRECT SOLAR RADIATION AT NORMAL INCIDENCES
INSTANTANEOUS SALUES (m'll/em
2
,
1985
,
RADIATION
CLOUD
w w
U
'"
>- z :::>
"'"
"'"
-
'"
0
...
-
w'"
...
'"
'"
'"
w>-0
-
-
0-
:::>'"
...
z
"'"
0 V> N-I
'"
w...
n--"'"
-
V>"
"
'"
"'"
...J...J I N
~-
0: 0='"
:::>'"
'"
-
...
I
...
-'"
-
0-'"
w :::> CD z....
w-
E"'"
...J'"
n- O-
w :::> z'"
z'"
-
W 0 ...J 0 W ::;n-'"
n- O0
-
w-
...J W W W'"
W"'"
-
>-:i
'"
...
N"'"
U 0: >-'"
n-...
> >...
x15
1
x15
1
x15
1
x15
1
hPa
°c
hPa
KblOkta
Sept
1
1240
44.5
1. 40
,
855
537
668
422
1017
14.6
i11.9
40 :CuSe
3,
5
1344
50.1
,
1. 56
I844
533
666
419
1025
15.0
10.6
50
CuFe
26
1404
52.3
i
,
1.63
!828
517
648
I406
1029
15.3
i
11.7
60
Cu
1
I
9
1348
51.8
I
1 .61
I872
552
685
434
1019
18.5 . 17.4
40
CuC!
29
1408
53.7
,
1.69
860
551
681
I
432
1019
17.6
15.8
45 :CuAc
Tr
10
1352
52.6
I
1. 64
788
507
629
401
1022
18.9
16.9
SO
StSeC!
310
1432
56.7
1. 82 ! 717
479
586
378
1021
18.7
17.0
40 . St SeC!
312
1400
I
53.9
1:69
,
791
495
618
383
I02Q
15.6
14.0
30
Cu
213- 1056
50.1
- . . 56-;-773
480
-603
375
1026
15.8
12.9
35
:CuScFc ~19
1440
60.5
2.03
801
518
642
407
1015
14.0
10.9
60
,CbCuC!
328
11 02
55.4
1.76
602
423
513
336
1018
24.1
18.6
10
I
0I
Oct
I
2
0932
63.7 1 2.2 5
742
463
588
368
1001
16.0
13.5
30
CuC!
314
0916
69.6 ' 2.85
629
439
529
351
1036
12.2
13.9
15
;St1
1
14
1328
63.1 ; 2.20
714
480
587
378
1035
15.5
14.4
25
Ise
0
22
0928
71.0
3.05
430
334
380
271
1030
9.4
10.7
15
222
11 04
64.2
I2.29
544
396
465
319
1030
12.5
11.6
10
I
025
1128
64.5
2.31
546
405
470
333
1027
11.7
10.5
6
I
0i
28
1348
69.2
2.80
I675
470
568
372
1030
15.0
12.5
25
'Cu
329
1140
65.6
2.41
I777
513
632
400
1026
11.0
9.9
50
b
229
1244
66.1
2.46
I I696
466
574
366
1026
12.0
10.4
50
'Ci
1
29
1410
71.2
3.08
I
675
457
558
360
1025
11.8
10.4
50
1~~Ci
1
I30
1204
65.7
2.42
I769
521
637
429
1019
12.0
8.5
40
1.
I,
30
1048
67.6
I
2.61
I
732
499
607
414
1020
10.9
9.5
45
SeCi
1.
I
Nov I
I
1
0940
73.1
I
3.43
I
507
394
454
334
1014
7.3
9.0
20
,
01
1216
66.5 . 2.50
I
631
460
546
386
1014
11.4
9.9
12
~u
Tr
1
1344
70.2
2.93
596
443
520
370
1013
12.0
9.2
12
'Fe
Tr
I
2
1020
69.5
2.84
784
524
638
439
1011
8.4
6.5
40
~ec!
2
2
1142
66.3
2.48
806
540
661
445
1011
9.2
6.6
I
40
eAc
2. I12
1400
74.5
3.72
705
492
598
406
i
lO19
10.0
7.6
60
~eSe
Tr
19
1008
75.5
3.97
540
410
479
347
1
1030
6. 1
6.5
115
019
1100
72.7
3.35
639
471
557
393
1
1030
6.1
6.5
,15
019
1200
71.4
3.11
644
469
558
392
,1029
7.0
6.6
,12
e
Ir
22
0932
79.0
5.16
561
440
509
370
1
1030
3.0
5.6
35
u
Tr
22
1352
76.2
4.16
613
464
540
389
1029
4.6
5.8 . 35
u
Tr
23
11 00
73.5
3.51
712
507
607
421
:1028
6.3
6.5 ' 40
l-uFe
Tr23
1348
76.1 ,4.13
651
479
568
400
1027
7.0
6.6
40
e
Tr24
0956
77.4 !4.54
586
451
522
376
r
26
3.1
6.7
40
e
1
25
1144
72.8
3.37
642
473
557
406
1020
6.9
5.9
40
e
Tr26
1020
76.2
4.16
687
508
595
417
016
3.8
5.9
40
eSc
Tr26
1140
73.1
3.43
741
529
629
439
,
,015
4.8
5.9
40
eSe
Tr
-
10
-Tobie
4(Contd.)
DIRECT SOLAR RADIATION AT
NOR~~LINCIDENCES
INSTANTANEOUS BALUES (mW/cm2)
1985
,
RADIATION
CLOUD
w w
U
'"
>- z ::>
< <
-
Vl'"
....
-
w Vl....
Vl <.:>'"
w>-'"
-
-
0-
::> a:....
z <
'"
Vl N-'"
w....
Cl.-<
-
Vl <.:> <.:>'"
< ...J...J I N
:l-
a: ~ a: ::> a:'"
-
....
I
....
-
'"
-
0-
Vl w ::>'"
z...
i l l-
E < ...J Vl a. 0-
w ::>z
'"
z
"'-
w'"
...J'"
W'"
Cl.'"
Cl. C)0
-
w-
...J W W W'"
W <-
>-~
'"
....
N -< U'"
>- a: Cl.....
> >....
XI5
1
x15
1
x15
1 "xI5 1
,
hPo
I
°c
hPo
Kbl
Okto
Dec
11
1444
82.0
6.96
387
294
353
239
994
13.5
12.0
20
FcSc
Tr
28
0956
80.0
5.65
665
511
587
426
1013
1 .5
4.9
40
0
28
1100
I
76.4
4.22
764
561
657
462
1012
2.5
4.4
50
0
28
1200
1
75.2
3.89
780
563
664
465
1012
3.7
3.7
60
0
28
1404
I
Table: ~ VALENTIA
2
DAILY TOTALS
or
DIRECT SOLAR RADIATION AT NORMAL INCIDENCES (J/cm ) 198~---Month Jan reb Mar Apr May June: July Aug Sept Oct Nov Dec
---
---p---p---.---Day I 2 3 4 ~ 6 7 8 9 10 II 12 13 14
n
16 17 18 19 20 21 22 23 24 25 26 27 28a
7 1199 519 79S 292 1119a
1347 478 742 86a
1147 633 868 541 284a
24 287 91l 49a
1149a
a
39o
378 3o
298 7 1064o
291o
508 3o
2 212 154o
472 4 24 8 140 496 ~72 68So
2 452 I 1536o
158 1678 35o
1722 2242 61 773 887 454 715a
I 10 281 287 307 675 1213 957 1860 1796 56 120 2 273 31 839 1281 452 2054 1398 493 1079 Sl4 162 234 287o
2533 2918 948 1850 82 1824 2321 3115 545 1747 1300 8 65 5 2484 38 12 1291 1813 ~73 1671 254~ 1970 3092 238 1394 1927 610 2005 2299 25 84 3 744 634 451o
o
2294 2198 3763 2930 2501 106 301 ~SI
543 90 100 485 42 754 2526 3385 1710 1127 934 1443 2113 42 40 1137 100 1644 587 ~12 41 6 148 702 2 887 1358 303~ 1460 1169 171 113
o
3 14~ 1211 8 3 136 745 2141 1524 7 819 4 4~ 429 35 1862 96 24 828 997 193 798 43 1261 1319 1399 395 1701 924 450 422 5 2230 18 46 84 644 407 359 17 1581 597 121 1 537 1299 473 1098 6 2232 2479 ~ 18 1634 2566 697 1704 776 111 268o
53o
1196 2 207 3 168 ~26o
7 1409 1729 lSi 907 248 919 2 537 247 22 28o
663 7 68 2004 2358 741o
4 4 22 180 1124 1 36 1014 333o
1~07 1450 1931 414 222 SZI 295 253 127 73 ~12 638 1173 209 783 22 560o
12 1174 479 68 1396 1480 1395 1274 n12 89 27 211o
48 142 447 249 584 293 610 811 4o
o
o
o
5o
457o
o
o
244 384 181o
308 140 150729 481 477 2804 165 11 0 76 1736 242 60
1
30 4 ~69 287 2835 4~8 9 2147 0 1191 0 01
31 0 15 3296 406 1506 1666 4111---
---1
Total 12968 5364 18744 29174 39400 30885 18684 21054 20742 17720 18331 70961
Table 6
Month
Day 1
2 3 4 5 6 7 8 9 10 1 1 12 13 14 15 16 17 18 19 20 21 22 23 24 25 26 27 28 29 VALENTIA Jan 2725 2180 1853 1818 1730 1825 1711 2297 1928 1781 1673 1966 2132 1542 1427 1390 1263 1434 1544 1938 1707 1267 1204 1473 1418 932 1441 1543 1584 Feb 1616 1757 1620 1200 1951 3033 2763 2839 2478 2589 2383 2508 2286 2451 2389 2531 2480 2388 2836 2532 2560 2811 2886 2607 2665 2517 2832 2912 2
DAILY TOTALS OF LONG-WAVE (INFRA-RED) RADIATION (J/cm )
Har 2789 2634 2651 2278 2810 2705 2231 2678 2985 2481 2143 2724 2H8 2353 2440 2422 2682 2759 2626 2673 2543 2466 2535 2372 2269 2229 2191 26H 3005 Apr 2887 3017 2904 2902 2733 2534 2799 2459 2478 2659 2604 2743 2650 2761 3021 3040 2575 2436 2646 2348 2588 2306 2276 2135 2613 2598 2538 2745 2848 Hoy 2787 2986 2424 2656 2747 2585 2626 2685 2453 2331 2535 2404 2608 2604 2581 2823 2820 2780 2931 2867 3029 2943 2916 2948 3118 3\37 2584 2482 2430 June 2546 2592 2814 3114 3016 2841 2734 2992 2879 2948 3036 2831 2653 2399 2499 2846 2991 2842 2895 3151 3233 2876 3026 2701 2913 2921 3056 3216 3115 July 3099 3120 3088 3098 2790 2607 2831 3124 3233 3246 3331 3298 2989 2780 3120 3174 3165 3000 2741 2777 3232 3111 3334 3343 3228 3096 2689 2938 3202 Aug 3091 2970 2948 3168 2947 3093 2866 2911 2791 2894 2815 2865 2822 2936 3157 2770 3311 3256 3162 3151 2990 2899 3069 2692 2870 2937 3008 2747 3027 Sept 2563 2888 2605 2118 3307 3206 3144 3093 3325 3314 3029 2829 3299 1985 Oct 3297 3034 2869 2785 3023 2668 2632 2895 3043 3171 2922 3152 3162 2587 2550 2633 3066 2979 3003 2958 2712 2535 2903 2816 2269 2875 3030 2577 2321 Nov 2289 2230 2577 2911 2476 2636 2891 2901 2533 2411 2641 2361 2766 2273 2502 2437 2901 2705 1965 2144 2274 20\3 1953 2101 2128 1995 2553 2288 2742 Doc 2943 3042 2674 2676 2457 2665 2282 2434 2462 2428 2833 3071 3149 2972 3043 2964 2923 2397 2737 2964 2669 2480 2265 2435 2587 2230 1921 1648 2285 30 1666 2736 2754 2488 3094 3237 2876 3385 2515 3067 2749
31 1800 2878 2549 3043 2580 2427 2277
---1---Total
1
52192 68420 79497 79597 83857 86770 95064 91619 87409 73664 806621---1---1
Mean1
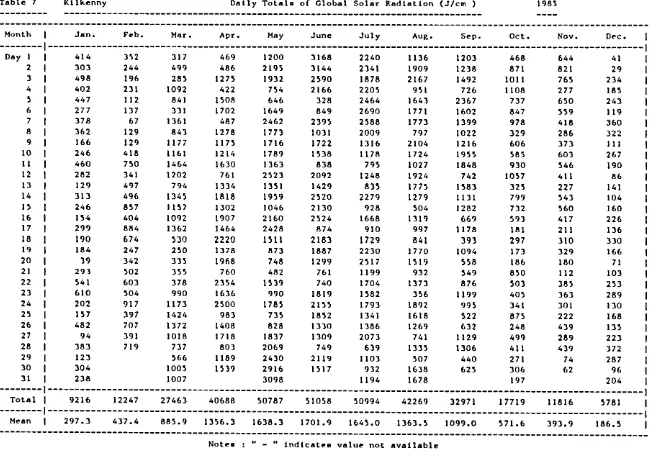
1683.6 2443.6 2564.4 2653.2 2705.1 2892.3 3066.6 2955.5 2819.6 2455.5 2602.0 [image:14.837.118.778.58.517.2]Table 7 Kllk«!!nny
2
Dally Totals of Global Solar Radiation (J/cm )
---
---
198~---I
Month Jan. Feb. Mar. Apr. May June July Aug. Sep. Oct. Nov. Dec.---
---DOY 2 3 4 ~ 6 7 8 9 10 11 12 13 14 1~ 16 17 16 19 20 2 I 22 23 24
n
26 27 28 414 303 498 402 447 277 378 362 166 246 460 282 129 313 246 1~4 299 190 184 19 293 ~41 610 202 IH 482 94 383 3~2 244 196 231 I 12 137 67 129 129 418 750 341 497 496 8H 404 884 674 247 342 ~02 603 ~04 917 397 707 391 719 317 499 28~ 1092 841 331 1361 841 1177 116 I 1464 1202 794 134511 ~7
1092 1362
no
2~0 315 355 378 990 1173 1424 1372 1018 737 469 486 1275 422 1508 1702 487 1278 1175 1214 1630 761 1334 1818 1302 1907 1464 2220 1378 1968 760 23~4 1636 2500 983 1408 1718 803 1200 2195 1932 7H 646 1649 2462 1773 1716 1789 1363 2~23 13~1 19~9 1046 2160 2428 IHI 873 746 482 In9 990 178~ 73~ 828 1837 2069 3168 3144 1590 2166 328 849 239~ 1031 1722 IB8 838 2092 1429 2~20 2130 2~24 874 2163 1887 1299 761 740 1819 21~5 1852 1330 1309 749 2240 2341 1878 220~ 2464 2690 1588 2009 1316 1178 795 1248 835 2279 928 1668 910 1729 2230 2517 1199 1704 1~82 1793 1341 1386 2073 639 1136 1909 2167 951 1643 1771 1773 797 2104 1724 1027 1924 177~ 1279 ~04 1319 997 641 1770 1519 932 1373 3~6 1892 1618 1269 741 133~ 1203 1218 1492 726 2367 1602 1399 1022 1216 195~ 1848 742 1583 1131 1282 669 1178 393 1094 ~58 H9 876 1199 99~ ~22 632 1129 1306 468 871 lOll 1108 737 847 978 329 606 ~8~ 930 10H 32~ 799 732 593 181 297 173 186 8~0 ~01 405 341 675 248 499 411 644 821 76~ 277 650 559 418 286 373 601 546 411 227 543 560 417 211 310 329 180 112 38~ 363 301 222 439 289 439 41 29 234 185 243 119 360 322I I I
267 190 86 141 104 160 226 136 330 166 71 103 2B 289 130 168 135 223 372
29 123 ~66 1189 2430 2119 1103 507 440 271 74 287
30 304 1005 1539 2916 1~17 932 1638 62~ 306 62 96
31 238 1007 3096 1194 1678 197 204
---1---_____________________ _
Total
1
9216 12247 27463 40688 ~0787 ~1058 ~0994 42269 32971 17719 11816 ~7811---1---____________________ _
1
M •• n1
297.3 437.4 88~.9 13~6.3 1638.3 1701.9 164~.0 1363.~ 1099.0 ~71.6 393.9 186.~[image:15.833.122.778.55.507.2]
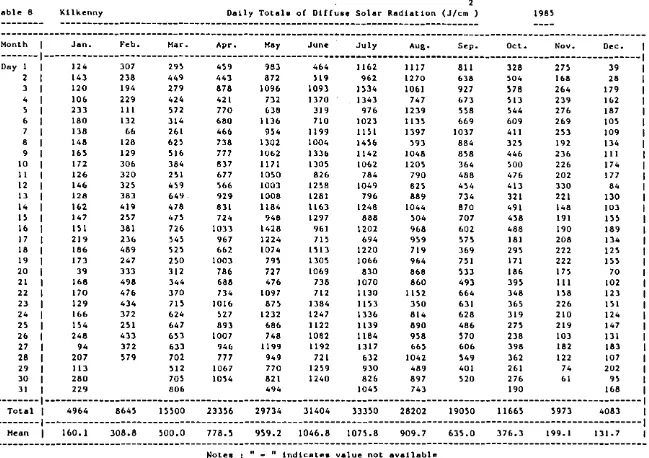
Table 8 Kllkenny
2
Dally Totals of Dlffuse Solar Radlatlon (J/cm ) 198~
---I
MonthI
Jan. Feb. Mar. Apr. May June July Aug. Sep. Oct. Nov. Dec.---1---Day I 1 124 307 29~ 4~9 983 464 1162 1117 811 328 27~ 39 2
1
143 238 449 443 872 ~19 962 1270 638 ~04 168 28 31
120 194 279 878 1096 1093 1~34 1061 927 ~78 264 179 4 1 106 229 424 421 732 1370: 1343 747 673 ~13 239 162~
1
233III
~72 770 638 319 976 1239 ~~8 ~44 276 187 61
180 132 314 680 1136 710 1023 113~ 669 609 269 10~7
1
138 66 261 466 9~4 1199 II~I 1397 1037 411 253 109 81
148 128 62~ 738 1302 1004 14~6 ~93 884 32~ 192 134 91
16~ 129 516 777 1062 1336 1142 1048 858 446 236III
10 172 306 384 837 1171 130~ 1062 120~ 364 ~OO 226 174
II 126 320 251 677 10~0 826 784 790 488 476 202 177
12 146 32~ 4~9 ~66 1003 12~8 1049 825 454 413 330 84 13 128 383 649 929 1008 1281 796 889 734 321 221 130 14 162 419 478 831 1184 1163 1248 1044 870 491 148 103
I~ 147 2~7 47~ 724 948 1297 888 ~04 707 4~8 191 15~
16 151 381 726 1033 1428 961 1202 968 602 488 190 189 17
18 19 20 21 22 23 24
H
26 27
28
219 186 173 39 168 170 129 166
1~4
248 94 207
236 489 247 333 498 476 434 372 2H 433 372 H9
~4~ ~2~ HO
312 344 370
7n
624 647 653 633 702
967 662 1003 786 688 734 1016
~27
893 1007 946
777
1224 1074 795 727 476 1097
8n
1232 686 748 1199 949
71~
I ~ 13 1305 1069 738 712 1384 1247
1122
1082
l I n
721
694 1220 1066 830 1070 1130
1153
1336
1139
1184 1317 632
959 719 964 868 860 1152 350 814 890 958
66~
1042
5H 369 7H
~33
493 664 631 628 486
~70
606 H9
181
29~
171 186
39~
348
365 319 2H
238
398 362
208 222 222 175 III
1~8
226 210 219 103 182 122
134 125
n5
70 102 123
IH
124 147 131 183 107
29 113 512 1067 770 12~9 930 489 401 261 74 202
30 280 70~ 10~4 821 1240 826 897 520 276 61 9~
31 229 806 494 1045 743 190 168
---1---1
Total1
4964 864~ I~~OO 233~6 29734 31404 333~0 28202 190~0 1166~ ~973 40831---1---1
Hean1
160.1 308.8 ~OO.O 778.5 959.2 1046.8 1075.8 909.7 63~.0 376.3 199.1 131.7Notes : " - " indicate. value not available
[image:16.836.126.775.90.548.2]-Tabl. 9
I
MonthDay 2 3 4 ~ 6 7 8 9 10 1 1 12 13 14 1~ 16 17 18 19 20 21 22 23 24
n
26 27 28 29 Birr Jan. 275 299 393 348 163 210 337 319 231 181 38~ 34~ 177 3H 276In
207 126 247 163 89 338 430 241 188 40~1 ~o
322 144 Feb. 32~ 2~3 284 263 206 259 102 337 364 489 HI n7 ~44 476 719 472 80~ 783 146 408 331 389 290 981 490 7~2 466 462 Mar. 368 37~ 281 9B 634 342 1I70 7~3 ~70 1004 13~0 923 76~ 1I10 8~9 636 1130 318 244 411 681 H4 893 1013 1388 106~ 862 ~13 720 2 Daily Totals of Global Solar Radiation (J/cm )
Apr. 4~1 490 1440 ~97 1~87 1279 663 1327 138~ 1061 1438 790 843 1627 842 1013 1413 2076 1182 1673 8H 2007 I~n 2249 970 1362 167~ ~41 1032 May 89~ 1678 1661 876 ~61 944 2026 1342 1I66 2120 2017 2H6 1042 I ~92 ~03 1212 1973 1395 499 ~71 ~67 1819 112 ~ 14~9 686 1520 1~6~ 2311 2819 June 2811 26% 2334 1620 743
I n l
2051 1168 1732 1376 8~0 1673 1~47 2067 18~8 2219 1290 1911 1692 1316 967 ~45 2862 2048 2184 1349 116~ 1444 1686 July 1816 176~ 897 1247 1929 2474 1~69 1770 1410 107~ 636 1126 884 1686 682 1176 866 1919 2126 2166 1366 1417 862 15~6 1442 937
Dn
666 756 Aug. 884 1642 1776 595 1421 IHO 126~ 660 1609 1484 1180 1617 1738 685 363 119~ 1121 1477 1179 1139 787 1244 449 130~ 1I43 1082 991 126~ 374 Sep •. 932 1048 1129 735 1768 1176 767 937 993 IH7 n26 923 951 993 1217 314 1224 211 902 440 ~42 533 736 787 645 ~78 1026 1148 746 Oct. B7 897 854 833 644 674 761 319 380 382 761 957 208 668 ~47 192 353 199 317 394 54~ ~OO 521 781 196 300 331 287 1985 Nov. 622 726 621 310 H2 417 36~ 34~ 234 ~02 495 470 232 496 46~ 390 142 219 196 196 188 H3 365 422 343 367 292 421 284 Dec.In
~o 342 191 2~2 10~ 337 337 173 280 226 6~ 156 100 116 84 139 303 93 6~ 106 289 237 122 128 300 2~4 417 26330 248 913 1308 2431 16~3 ~72 1322 403 2~2 61 106
31 197 944 2664 1363 1214 213 146
---1---Total
1
7983 12494 23762 3672~ 4~799 ~0568 41973 36118 26849 11233 ~9~~---1---
Mean1
2~7.~446.2 766.~ 1224.2 1477.4 1686.3 13~4.0 116~.1 69~.0 374.4 192.1
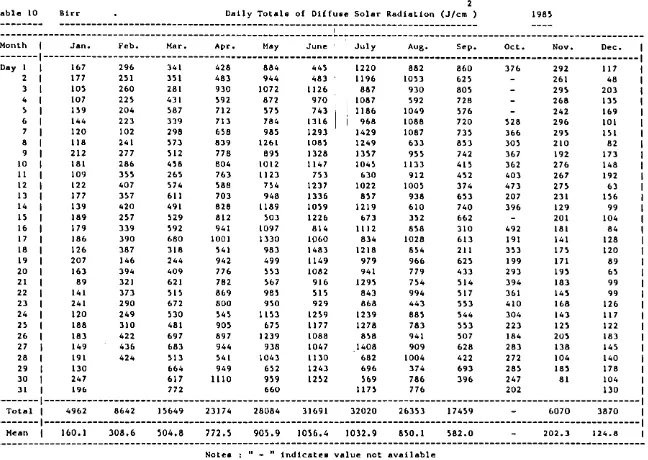
Table 10 Birr
2
Daily Totals of Diffuse Solar Radiation (J/cm ) I
198~
---1
Month Jan. Feb. Mar. Apr'. May June July Aug. Sep. Oct. Nov. Dec.---
---._---Day I
2 3 4 ~ 6 7 8 9 10 11 12 13 14 IS 16 17 18 19 20 21 22 23 24 H 26 27 28 29 30 31 167 177 10~ 107 1H 144 120 118 212 181 109 122 177 139 189 179 186 126 207 163 89 141 241 120 188 183 149 191 130 247 196 296 251 260 2H 204 223 102 241 277 286 35~ 407 357 420 257 339 390 387 146 394 321 373 290 249 310 422 436 424 341 351 281 431 587 339 298 573 H2 458 26~ 574 611 491 529 ~92 680 318 244 409 621 H~ 672 530 481 697 683 H3 664 617 772 428 483 930 592 712 713 658 839 778 804 763 ~88 703 828 812 941 1001 HI 942 776 782 869 800 ~45 905 897 944 HI 949 1110 884 944 1072 872 575 784 98~ 1261 89~ 1012 1123 754 948 1189 503 1097 1330 983 499 553 567 985 9~0 1153 675 1239 938 1043 652 9~9 660 445 483 1126 970 743 1316 1293 1085 1328 1147 753 1237 1336 1059 1226 814 1060 1483 1149 1082 916 ~15 929 1H9 1177 1088 1047 1130 1243 1H2 1220 1196 887 1087 1186 968 1429 1249 1357 1045 630 1022 857 1219 673 1112 834 1218 979 941 1295 843 868 1239 1278 858 1408 682 696 569 1175 882 1053 930 592 1049 1088 1087 633 955 1133 912 1005 938 610 3S2 8~8 1028 854 966 779 754 994 443 885 783 941 909 1004 374 786 776 860 625 80~ 728 576 720 735 853 742 415 4S2 374 653 740 662 310 613 211 6H 433 H4 517 553 544 553 ~07 628 422 693 396 376 ~28 366 305 367 362 403 473 207 396 492 191 353 199 293 394 361 410 304 223 184 283 272 28~ 247 202 292 261 295 268 242 291> 295 210 192 276 267 275 231 129 201 181 141 175 171 195 183 145 168 143 125 205 138 104 185 81 117 48 203 135 169 101 IH 82 173 148 192 63 1~6 99 104 84 128 120 89 65 99 99 126 117 122 183 145 140 178 104 130
Total 4962 8642 15649 23174 28084 31691 32020 26353 174~9 6070 3870
---1---Mean
I
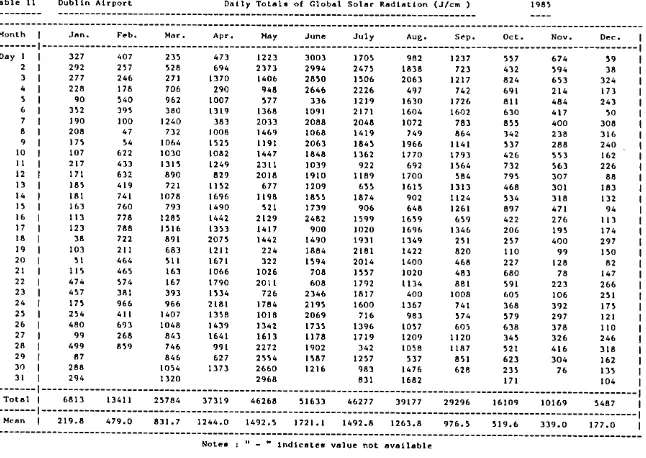
160.1 308.6 504.8 772.5 905.9 1056.4 1032.9 850.1 ~82.0 202.3 124.8 [image:18.834.126.774.89.549.2]Table II Dublin Airport
2
Daily Totala of Global Solar Radiation (J/cm )
---198~
---I
MonthDay 2 3 4 ~ 6 7 8 9 10 II 12 13 14
I ~
16 17 18 19 20 21 22 23 24 2~ 26 27 28 29 30 31
Feb. Mar. Apr. Hoy June July Aue· S~p. Oct. Nov. Dec.
---327 292 277 228 90 3n 190 208 I n 107 217 171 18~ 181 163 113 123 38 103 ~I
II
~474 4~7 17~ 2~4 480 99 499 87 288 294 407 2H 246 178 ~40 395 100 47 ~4 622 433 632 419 741 760 778 788 722 211 464 46~ ~74 361 966 411 693 268 8~9 235 ~28 271 706 962 380 1240 732 1064 1030 131 ~
890 721 1078 793 1285 1516 891 683 HI 163 167 393 966 1407 1048 843 746 846 1054 1320 473 694 1370 290 1007 1319 383 1008 1525 1082 1249 829
l i n
1696 1490 1442 1353 207~ 1211 1671 1066 1790
IH4
2181 1358 1439 1641 991 627 1373 1223 2373 1406 948 H7 1368 2033 1469 1191 1447 2311 2018 677 1198 ~21 2129 1417 1442 224 322 1026 2011 726 1784 1018 1342 1613 2272 25~4 2660 2968 3003 2994 28~0 2646 336 1091 2088 1068 2063 1848 1039 1910 1209 18~5 1739 2482 900 1490 18841H4
708 608 2346 2195 2069 1735 1178 1902 1~87 1216 1705 24n 1~06 2226 1219 2171 2048 1419 184~ 1362 922 1189 6~5 1874 906 1599 1020 1931 2181 2014nH
1792 1817 1600 716 1396 1719 342 1257 983 831 982 1838 2063 497 1630 1604 1072 749 1966 1770 692 1700 161~ 902 648 16~9 1696 1349 1422 1400 1020 1134 400 1367 983 10~7 1209 1058 H7 1476 1682 1237 723 1217 742 1726 1602 783 864 1141 1793 1~64 ~84 1313 1124 1261 659 1346 251 820 468 483 881 1008 741H4
605 1120 1187 851 628 ~57 432 824 691 811 630 8~5 342 537 426 732 79~ 468H4
897 422 206 257 110 227 680 HI 605 368 ~79 638 34~ ~21 623 235 171 674 ~94 653 214 484 417 400 238 288 5H ~63 307 301 318 471 276 19~ 400 99 128 78 223 106 392 297 378 326 416 304 76 H 38 324 173 243 50 308 316 240 162 226 88 183 132 94 113 174 297 150 82 147 266 251 17~ 121 110 246 318 162 135 104---
---Total 6813 13411 2~784 37319 46268 51633 46277 39177 29296 16109 10169 5487
1--- ---1
1
Hean 219.8 479.0 831.7 1244.0 1492.5 1721.1 1492.8 1263.8 976.5 ~19.6 339.0 177.01
[image:19.834.135.781.57.515.2]
Table 12 Dublin Airport Daily Total. of Diff~.e Solar Radiation (J/cm ) 2 198~
---
---
I ,---I
Month Jan. Feb. Mar. Apr. May June i I July Aug. Sep. Ocl. Nov. Dec.---
---._---Day
2 3
4
~
6 7 8 9 10
11
12
13 14
n
16 17
18
19 20 21 22
23
24
n
90 171 87 1B 90 93
no
190 173 104 180 141 166 160 126 111 120
3~
102
~O
108 122 137 164 233
295
2n
24~
178
272
269 99 47
~4
2S1 393 368 307 272 273 226 267 332 210 388 460 409 381 19S 401
234 424 245 346 487 368 259 Sal 422
33S
267 H8 6lS 433 Sl9 482
3n
706 654 452 161 166 385 649 461
467 64S 850 286
7S7
730 376 6S2 694 906 671 603 766 646 981 1001
7S5
628 908
771 777
811 972 H2
9n
1020
5S1
854 937 573 1047
1112 118S
896 1104 835 1023 607 986 520 \147 1050 980 219 320 1003 1213
722
990 937
418 434
775
81S 336 958 1027 1022 IlS5 1283 1007 1072 1038 IlS4 1344 90S 748 1112 1018 \123 707 603 1144 114S 1100
1317 958 1249 13\3 1021 1093 1290 1264 1458 IlS4
9n
1068 650 1062 884 1203 883 1190 865 808 1198 932 1240 1202 716
952 902 767 496 912 \116 907 627 887 820 582 733 818
778
634 823 804 740 9\3 798 865 943 384 769 840
802 444
772
740 572 622 745 783 868 302 502 3S8 568 648 607 624 547 2S1 658 46S 455
681
H5 600 S49
418 381 400 4S0 Sl6 S\3 307 341 503 4\1 3S9 374 437 418 364
398
206 2S7 110 226
372
3H 414 332 296
165 200
161
176 26) 280 287 196 187 \30 131 290 281 186 145
170
195 184 99 128
77 172
105
1H 191
54 38 122 150 132 SO 99 72 1H 138
n4
88 1 S4 \31 94 97 140 87 \3882
127 76 104 140 11 3 26 162 )39 688 968 1130 1336 752 9S0 513 408 101 110 27 99 268 536 889 1270 1113 1207 946 517 316 130 109
28 158 478 707 917 86) 1009 342 921 393 395 10) 70
29 82 715 608 698 1183 809 536 651 274 167 141
30 26S 620 1113 871 1040 8S0 878 S06 23S 76 131
31 219 672 434 773 691 170 101