Psychology Dissertations Department of Psychology
8-7-2018
Tool Use in Pan: Two Modalities, Two Species
Lindsay M. MahovetzFollow this and additional works at:https://scholarworks.gsu.edu/psych_diss
This Dissertation is brought to you for free and open access by the Department of Psychology at ScholarWorks @ Georgia State University. It has been accepted for inclusion in Psychology Dissertations by an authorized administrator of ScholarWorks @ Georgia State University. For more information, please [email protected].
Recommended Citation
TOOL USE IN PAN: TWO MODALITIES, TWO SPECIES
by
LINDSAY MAHOVETZ
Under the Direction of William D. Hopkins, PhD
ABSTRACT
A notable difference between the two Pan species is their tool using ability. Though
many studies on physical tool use exist, few investigate social tool use and, to my knowledge,
none focus on their potential relationship or cognitive foundations. While captive and wild
chimpanzees are recognized as proficient tool users, captive bonobos exhibit some tool using
skills but evidence in wild bonobos is rare. An important similarity, however, is their flexible
and intentional use of communicative signals. Captive bonobos and chimpanzees are known to
use their communicative behaviors to manipulate humans to obtain an unreachable food, a form
of social tool use. With growing interest in social tool use, an emerging central question is to
what extent different species utilize these two tool strategies. Thus, 27 bonobos and 29
distances such that the physical tool no longer solved the problem while a human who could be
solicited was present. Although both species successfully retrieved rewards with the physical
tool and solicited the human, chimpanzees showed greater proficiency and flexibility by making
fewer attempts to retrieve rewards, retrieving rewards faster, and making more solicitations.
For both species, solicitation behavior was prevalent at further distances where the reward was
unable to be retrieved, supporting previous research showing these species intentionally produce
attention-getting/directing behaviors to indicate toward desired out-of-reach items. In this
study, bonobos and chimpanzees exhibited cognitive flexibility by switching tool strategies
from using a physical tool at closer distances to using a social tool (a human) at further
distances. Regardless of species, physical and social tool performance was related to
performance on previous physical and social cognition tasks, including the Primate Cognition
Test Battery. The results of this study support the idea that physical and social cognition may
not be two separate cognitive domains, as they are so often treated. Rather, cognition may be a
single entity in which certain behaviors and processes are elicited by physical and/or social
contexts, allowing the transition between physical and social tool modalities.
INDEX WORDS: Tool use, Bonobos, Chimpanzee, Physical cognition, Social cognition,
TOOL USE IN PAN: TWO MODALITIES, TWO SPECIES
by
LINDSAY M. MAHOVETZ
A Dissertation Submitted in Partial Fulfillment of the Requirements for the Degree of
Doctor of Philosophy
in the College of Arts and Sciences
Georgia State University
Copyright by Lindsay Marie Mahovetz
TOOL USE IN PAN: TWO MODALITIES, TWO SPECIES
by
LINDSAY M. MAHOVETZ
Committee Chair: William Hopkins
Committee: Michael Beran
Sarah Brosnan
Jill Pruetz
David Washburn
Electronic Version Approved:
Office of Graduate Studies
College of Arts and Sciences
Georgia State University
DEDICATION
I dedicate this work to my family and friends who have been there by my side through
the many ups and downs. It is without them that I would not have had the courage to follow my
dreams. I also dedicate this work to all of my bonobo and chimpanzee subjects who taught me
ACKNOWLEDGEMENTS
I would like to thank my advisor and dissertation committee chair Dr. William Hopkins,
and committee members Drs. Mike Beran, Sarah Brosnan, Jill Pruetz, and David Washburn for
their guidance and support throughout the entire dissertation process. I especially would like to
extend my deepest gratitude to Dr. William Hopkins for providing me with the opportunity to
join his research team and providing me with research, funding, academic, and moral support
throughout my graduate career. Additionally, I would like to thank all of the bonobo caretakers
at ACCI, Jacksonville Zoo and Gardens, and Milwaukee County Zoo, and the chimpanzee
caretakers at Maryland Zoo and Yerkes National Primate Research Center for their flexibility
and assistance with making my project possible. Lastly, I would like to thank all of my subjects
TABLE OF CONTENTS
ACKNOWLEDGEMENTS ... V
LIST OF TABLES ... IX
LIST OF FIGURES ... X
LIST OF ABBREVIATIONS ... XI
1 INTRODUCTION ... 1
1.1 Pan Tool Use ... 1
1.1.1 Explanations for Tool Using Differences ... 2
1.1.2 Object Manipulation and Motivations for Tool Use ... 8
1.2 Social Behavior & Communication ... 10
1.3 Social Tool Use ... 12
2 AIMS, QUESTIONS, AND HYPOTHESES ... 15
2.1 Species Differences ... 18
2.2 Distance Differences ... 18
2.3 Individual Differences ... 18
3 METHODS ... 19
3.1 Subjects ... 19
3.2 Attention-Getting Assessment ... 20
3.3 Solicit for Tool ... 23
3.5 Data Analyses ... 25
4 RESULTS ... 25
4.1 Descriptive Statistics and Normality Tests ... 25
4.2 Condition Differences ... 26
4.3 Species Differences ... 28
4.3.1 Retrieval Attempts ... 28
4.3.2 Retrieval Latency ... 30
4.3.3 Number of Solicitations ... 32
4.3.4 Solicitation Latency ... 33
4.4 Distance Differences ... 34
4.4.1 Retrieval Attempts ... 34
4.4.2 Retrieval Latency ... 35
4.4.3 Number of Solicitations ... 36
4.4.4 Solicitation Latency ... 38
4.4.5 Time at Table ... 39
4.5 Individual Differences ... 40
4.5.1 PCTB ... 40
4.5.2 Attention-Getting Assessment ... 50
4.5.3 Solicit for Tool ... 50
5 DISCUSSION ... 51
5.1 Evolution of Hominin Tool Use ... 52
5.2 Cognition Dichotomy ... 56
5.3 Behavioral/Cognitive Flexibility ... 58
5.4 Summary ... 60
LIST OF TABLES
Table 3.1 Subject demographic information ... 21
Table 3.2 Ethogram of attention-getting signals ... 22
Table 4.1 Descriptive statistics and normality test results ... 26
Table 4.2 PCTB partial correlation analyses summary ... 41
LIST OF FIGURES
Figure 1.1 African ape geographic distribution ... 3
Figure 3.1 Experimental set-up and retrieval example ... 24
Figure 4.1 Overall trials solicited on during EA and EP conditions ... 27
Figure 4.2 Number of trials solicited for each distance during EA and EP conditions ... 28
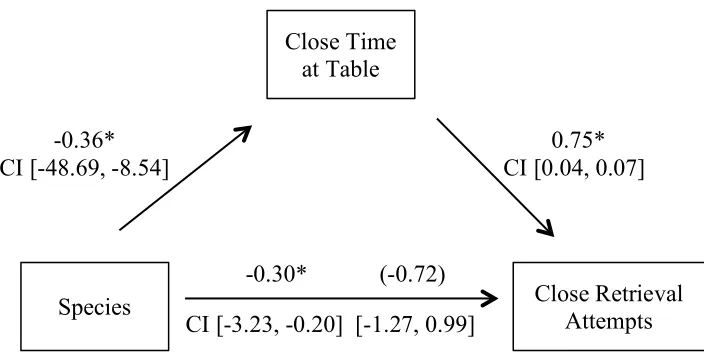
Figure 4.3 Mediation of Close retrieval attempts by time at table ... 29
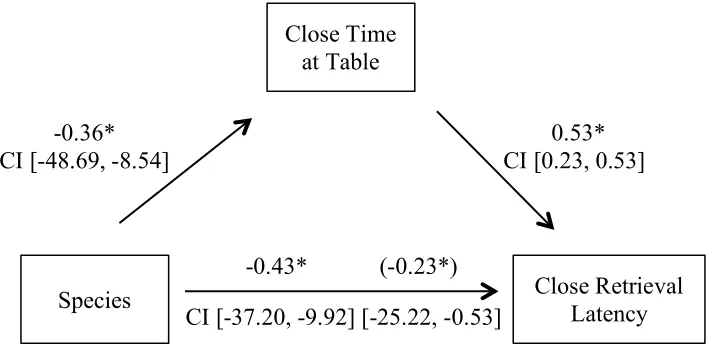
Figure 4.4 Mediation of Close retrieval latency by time at table ... 31
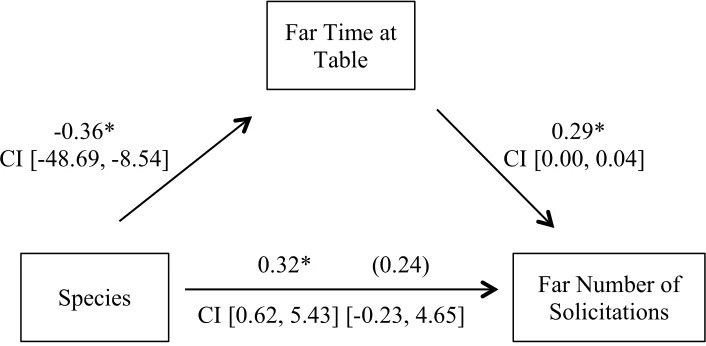
Figure 4.5 Mediation of Far number of solicitations by time at table ... 33
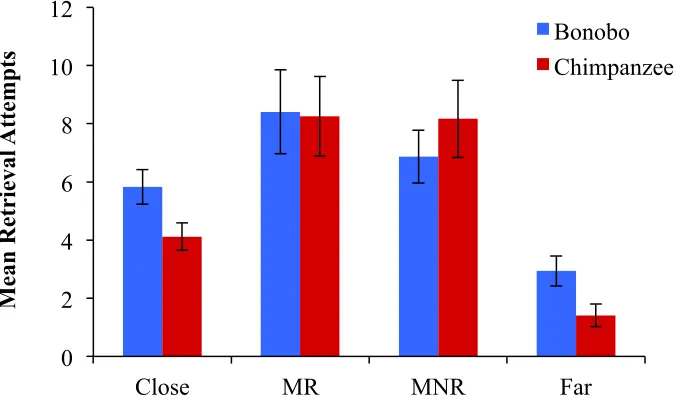
Figure 4.6 Mean retrieval attempts by species ... 35
Figure 4.7 Mean retrieval latency by species ... 36
Figure 4.8 Mean number of solicitations by species ... 37
Figure 4.9 Mean number of retrieval attempts and solicitations ... 38
Figure 4.10 Mean solicitation latency by species ... 39
Figure 4.11 Mean time spent at table by species ... 40
Figure 4.12 PCTB performance and retrieval performance ... 43
Figure 4.13 PCTB performance and solicitation behaviors ... 44
Figure 4.14 Physical PCTB performance and retrieval performance ... 46
Figure 4.15 Tool PCTB performance and retrieval performance ... 47
Figure 4.16 Social PCTB performance and solicitation behaviors ... 49
Figure 4.17 Return to tool frequency ... 51
LIST OF ABBREVIATIONS
ACCI Ape Cognition and Conservation Initiative
AG Attention-Getting
ASD Autism Spectrum Disorder
AUD Alcohol Use Disorder
JZG Jacksonville Zoo and Gardens
MCZ Milwaukee County Zoo
MDZ The Maryland Zoo in Baltimore
MR Medium Retrievable
MNR Medium Not Retrievable
PCTB Primate Cognition Test Battery
THV Terrestrial Herbaceous Vegetation
UWA Universal Weighted Average
UWA_g General Intelligence Score “g”
1 INTRODUCTION
Diverging from each other just one to two million years ago, chimpanzees (Pan troglodytes) and
bonobos (Pan paniscus) are very similar to one another behaviorally, physically, and genetically
(Herrmann, Hare, Call, & Tomasello, 2010; Kano, 1992). However, these species also have
notable differences pertaining to their social behavior and systems as well as their use of tools.
Some of the highlighted differences between bonobos and chimpanzees have been attributed to
the differing environments in which they live and the foods that are available. More specifically,
many important food sources are available year round in bonobo habitats while many preferred
or high protein foods are seasonally available in chimpanzee habitats. This has led some to
suggest that seasonality of high valued foods may have led to increased selection for advanced
extractive foraging techniques such as tool use (Gruber, Reynolds, & Zuberbühler, 2010;
Hohmann & Fruth, 2003).
1.1 Pan Tool Use
Chimpanzees are recognized for their tool using ability in various contexts (mostly during
foraging) both in the wild and in captivity. Wild chimpanzees have an extensive tool using
repertoire including probing, digging, and hunting using sticks, cracking nuts open using rocks or
other hammer-like objects, and sponging/wadging using leaves, just to name few. Similarly,
captive chimpanzees also show proficiency in many of these same activities, especially probing,
nut cracking, and sponging/wadging, and have been shown to use properties of weight (Schrauf,
Call, Fuwa, & Hirata, 2012), length (Mahovetz, 2015; Sabbatini, Truppa, Hribar, Gambetta, Call,
& Visalberghi, 2012), shape and rigidity (Mahovetz, 2015) to select effective tools. (For detailed
catalogues/reviews of tool use see: Beck, 1980; Goodall, 1986; Shumaker, Walkup, & Beck,
While some have reported tool use in captive bonobos (Gruber, Clay, & Zuberbühler,
2010; Jordan, 1982), evidence of material tool use in wild bonobos remains essentially
non-existent, and, if manifest, occurs during social and not foraging contexts (Koops, Furuichi, &
Hashimoto, 2015). This difference was originally proposed to result from food availability
differences limiting (or heightening) the need for tools. This hypothesis, called the “necessity
hypothesis,” proposes that tool use developed as a response to scarcity in resources by enabling
practitioners to exploit novel food sources (Fox, Sitompul, & van Schaik, 1999; Furuichi, Sanz,
Koops, Sakamaki, Ryu, Tokuyama, & Morgan, 2015; Sanz & Morgan, 2013).
1.1.1 Explanations for Tool Using Differences
A number of studies investigated differences in tool use across ape populations. One of
the earliest by Fox and colleagues (1999) focused on the orangutan populations at Suaq
Balimbing, in the Kluet Pleat swamps of Gunung Leuser National Park, Sumatra. It was
suggested that the large population created increased food competition, leading orangutans to
devise alternative foraging strategies to exploit novel resources. When it comes to differences in
the use of tools between bonobos and chimpanzees, resource scarcity is suggested to have led to
the innovation of tool strategies to supplement diets, within Pan troglodytes (Sanz & Morgan,
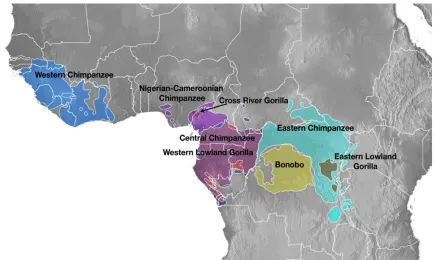
2013). For instance, chimpanzees inhabit 22 African countries, including areas north of the
Congo River and as far northwest as Senegal, ranging from rain forest habitats to savannas (see
Figure 1.1 for African ape geographic distribution). Bonobos, in contrast, live in a relatively
concentrated area in the equatorial forests of the Democratic Republic of Congo south of the
Figure 1.1 African ape geographic distribution
African ape distribution adapted by Peter Sudmant from Figure 1a from Prado-Martinez, Sudmant, Kidd, Li, Kelley, Lorente-Galdos, et al. (2013).
Though both species feed heavily on fruits and consume terrestrial herbaceous vegetation
(THV; Heilbronner, Rosati, Stevens, Hare, & Hauser, 2008; Wrangham & Peterson, 1996),
chimpanzees are reported to typically rely more on foods that are more variable in availability
(Gruber et al., 2010; Heilbronner et al., 2008; Wrangham & Peterson, 1996), and on extractive
foraging (Herrmann et al., 2010). Bonobos, living in a habitat characterized by high abundance
of large, dense food patches with low seasonality and high densities of THV (Gruber & Clay,
2016), may rely more on the herbaceous vegetation, a more consistent food source that may
buffer against seasonal shortages in fruit (Wrangham & Peterson, 1996). While at least 13
different types of tools have been found in Wamba, the longest running bonobo field site, there
are no observed accounts of their actual use in foraging by bonobos (Gruber & Clay, 2016).
profitability rather than to resource scarcity (Sanz & Morgan, 2013). Scientists have sought to
determine more specifically the factors corresponding with the emergence of complex tool use,
particularly within the hominin lineage (Sanz & Morgan, 2013). With increasing investigation,
ecological and social hypotheses have been used to account for variation in tool use among great
apes (Fox et al., 1999; Koops, McGrew, & Matsuzawa, 2013; Roffman, Savage-Rumbaugh,
Rubert-Pugh, Stadler, Ronen, & Nevo, 2015; Sanz & Morgan, 2013), though none alone seem
sufficient to explain the lack of tool foraging in bonobos (Furuichi et al., 2015; Roffman et al.,
2015).
1.1.1.1 Ecological Hypotheses
Three prominent ecological hypotheses offered to explain species differences in tool use
include the necessity hypothesis, the opportunity hypothesis, and the terrestrial herbaceous
vegetation (THV) hypothesis.
The necessity hypothesis posits that staple resource scarcity led to tool foraging
strategies to exploit otherwise unavailable food sources (Fox et al., 1999), allowing one to then
predict changes in frequency and/or variety of tool use based upon resource availability (Sanz &
Morgan, 2013). Seasonality may increase diversity in the types of foods consumed or create a
switch to other ‘keystone’ resources (Fox, van Schaik, Sitompul, & Wright, 2004; Terborgh,
1986; Yamakoshi, 1998) along with individual energetic needs. If insect-extraction developed as
a response to food scarcity, the necessity hypothesis would predict that insects are a fall back
food, a food only exploited when fruit is scarce and negatively correlated with availability of
preferred foods (Koops et al., 2013). Thus, according to the necessity hypothesis, bonobos
having a less variable food resource than chimpanzees would explain the differences in tool use
tool use (Furuichi et al., 2015). Previous reports suggest that chimpanzee tool use correlates with
fruit abundance at Bossou, Guinea (Furuichi et al., 2015; Sanz & Morgan, 2013; Yamakoshi,
1998). However, when directly comparing habitat characteristics and fluctuation of fruit
production between the bonobo habitat in Wamba and the chimpanzee habitat in Goualougo,
Furuichi and colleagues (2015) found comparable seasonal fluctuation patterns in ripe fruit
availability between the two sites. Therefore, while links between seasonal scarcity and tool use
have been suggested for some primate species, unequivocal evidence is lacking, warranting more
investigation (Koops, Visalberghi, & van Schaik, 2014). Perhaps insects are less of a fallback
food resultant of resource shortages, but rather provide the opportunities contributing to tool
derived insect extraction (Fox et al., 2004).
The opportunity hypothesis supposes that the invention of tool use is a function of
increased opportunities to use tools (Fox et al., 1999; Fox et al., 2004; Spagnoletti, Visalberghi,
Verderane, Ottoni, Izar, & Fragaszy, 2012). Specifically, exposure to both foods requiring
extraction (nuts, insects) and tools for extraction drive tool using behavior in populations; limited
or lack of exposure would explain absence of tool use in a given population (Koops et al., 2013).
At Taï, Koops et al. (2013) suggested that limited opportunities to find nuts, not of opportunities
to find tools, explained absence of nut cracking. If the opportunity hypothesis holds, then it
should also predict that differing populations would use tools to extract seeds of a particular tree
if the trees are present in both locations. However, Koops and colleagues (2013) point out that
for chimpanzees in Taï, it may not simply be the presence or absence of the nut trees or termite
mounds but rather the distribution and density that seems to coincide with opportunity and thus
invention of tool behaviors. Though the opportunity hypothesis has some support at various sites
The third ecological hypothesis is the terrestrial herb vegetation (THV) hypothesis, which
suggests that differences in bonobo and chimpanzee behavior are derived from the presence of
sufficient THV as fallback foods (Yamakoshi, 2004). While both species depend on highly
nutritious ripe fruits, they also feed on THV (Yamakoshi, 2004). This hypothesis assumes that
THV is a good alternative nutrient source sufficient to support higher group cohesion when ripe
fruit is scarce. It also assumes that bonobos may have greater access to and thus consume more
THV than chimpanzees who live sympatrically with gorillas (Yamakoshi, 2004) because THV
comprises the bulk of the gorilla diet (Wrangham, 1986; Wrangham, Chapman, Clark-Arcadi, &
Isabirye-Basuta, 1996). Evidence supporting the THV hypothesis stems from observations in the
Lomako Forest where bonobos eat more THV than chimpanzees in Kibale National Park
(Malenky & Wrangham, 1994; Wrangham et al., 1996) and that THV can be a fallback food
when competition for it is less (Wrangham et al., 1996).
Important to note is that chimpanzee populations differ too. While the THV hypothesis
may hold for East African chimpanzees, it may not for other populations that overlap in habitat
with other species that also consume THV. Further, the Kanyawara chimpanzees in Kibale
National Park in East Africa are not necessarily representative of other chimpanzee populations.
Additionally, some data shows that even when THV was abundant the Kanyawara chimpanzees
forage on figs instead of THV (Wrangham, 1986; Wrangham et al., 1996), contradicting the
THV hypothesis. Furthermore, most reported differences in behavior, particularly regarding tool
use and social behavior, are between bonobos and East African chimpanzees (Yamakoshi, 2004).
West African chimpanzees, on the other hand, show behavioral similarities to bonobos and
differences to East African chimpanzees (Yamakoshi, 2004). West African chimpanzees do not
similarities we see, particularly because East African chimpanzees may face competition with
gorillas (Yamakoshi, 2004). There are also contrasting effects of seasonal abundance/scarcity on
chimpanzees seen between Kibale (eastern) and Bossou (western) chimpanzees. Chimpanzees at
Kibale do not have access to good fallback foods other than THV while Bossou chimps have
palm pith and nuts (which require tools; Yamakoshi, 2004). However, for Taï (western)
chimpanzees, nuts are present when fruit abundance is high. Thus, nuts are not considered a
fallback food and may impede exploration of nut cracking in the Taï population (Koops et al.,
2013).
Taken as a whole it seems as though ecological conditions are not alone sufficient to
explain the differences in tool use between bonobos and chimpanzees as well as geographically
separated chimpanzees.
1.1.1.2 Social Hypothesis: Limited Invention Hypothesis
Strictly ecologically based ideas explaining the evolution of, and differences in, tool
using behaviors, such as those mentioned above, neglect to consider the cognitive and social
components of invention and maintenance of such behavior (Fox et al., 1999). The limited
invention hypothesis, however, suggests that the presence of tool use should be geographically
limited (Fox et al., 1999); not only must the invention of tool use occur, but the behavior must be
reliably transmitted and maintained across a population (Van Schaik & Knott, 2001). The
invention of tool using behaviors is infrequent, and so opportunities for social learning facilitate
the spread and maintenance of these behaviors such that they may become frequent within a
population. Thus, it has also been suggested that differences in tool using behaviors between
populations may be better explained by social transmission and the reliability of copying such
Rather than just one specific factor contributing to the emergence of tool use in some
species, ecology, sociality, and cognition might all be working together (Koops et al., 2014).
The environment provides opportunities through food abundance and density, which increase
encounter rates, which facilitate innovation of novel tool using behaviors. Living in social
groups, being tolerant of social partners, and leaving behind tool artifacts aid the transmission of
tool using behaviors via social learning once innovated.
1.1.2 Object Manipulation and Motivations for Tool Use
Predisposition for tool use is also an important factor to consider when investigating
differences both across and within species. These predispositions may be measured through
object manipulation and object play, which have been suggested as precursors of tool use
(Hayashi, Takeshita, & Matsuzawa, 2006) as observable proxies of tool use tendencies.
Numerous animals interact with and manipulate objects in their environment. These
manipulations help provide the foundation for developing both functional and conceptual
knowledge about the physical environment (Bennett, 1996; Piaget, 1974). As such, object
manipulation likely provides a pathway toward understanding related behaviors, particularly tool
using behaviors (Bennett, 1996). By manipulating objects, individuals are provided with
experiences that may promote tool use through object combination and other actions which may
increase the chances of a successful tool-dependent strategy (Bennett, 1996; Westergaard &
Fragaszy, 1987) or aid in ones understanding of causal relationships (Bennett, 1996).
Early evidence suggest that bonobos, not chimpanzees, exhibit greater object
manipulation tendencies (Bard & Vauclair, 1984; Vauclair & Bard, 1983). However, testing a
sample of seven captive bonobos and 42 captive chimpanzees, Bennett (1996) found no
bouts with social interaction as compared to bonobos. While individual differences were
apparent, so were group differences, such that age and species were more predictive of the type
of manipulation than sex (Bennett, 1996). Bennett’s study suggests that object manipulation is
useful “as a measure reflective of differences in behaviors linked to tool use” (p. 91, 1996).
More recently, Koops and colleagues (2015) investigated differences in tool use between
wild bonobos and chimpanzees, separating the motivations underlying tool use into extrinsic and
intrinsic motivations. Extrinsic motivations are described as the ecological and social
opportunities, measured by availability of resources requiring tools and opportunities for social
learning (as discussed above in section 1.1.3). Intrinsic motivations are described as the
predispositions for tool use that are not in response external stimuli, including object
manipulation and object play.
Koops and colleagues (2015) found that intrinsic predispositions explained the
differences in tool use between wild bonobos and chimpanzees. Specifically, chimpanzees
exhibited higher rates of object manipulation and object play than bonobos, leading to the
question of why bonobos seem less interested in objects. One possibility is that bonobos may
pay more attention to social cues while chimpanzees pay more attention to ‘action target
objects’, such as foods or toys, as shown by Kano, Hirata, and Call’s (2015) eye-tracking study.
Bonobos and chimpanzees were shown three sets of stimuli: 1) full faces of apes with eyes and
mouth, 2) full bodies of apes with action target objects (i.e., food, toys), and 3) full bodies of
apes with the ano-genital area visible. Though overall viewing time was comparable between
species, bonobos looked at the eyes in full-face stimuli and the face in full body stimuli
containing an action target object and ano-genital areas longer than chimpanzees. In contrast,
ano-genital areas in full body stimuli containing those features. In terms of fixation, bonobos
fixated on the eyes while chimpanzees fixated on the mouth. This greater attention toward eyes
and faces compared to action target items, which included tools, exhibited by bonobos suggests
that there may be a trade-off between motivation for using tools and that for social attention
(Koops et al., 2015).
1.2 Social Behavior & Communication
While these species differ in the dominance structure of their societies (bonobos are
matriarchal, chimpanzees are patriarchal), they both exhibit fission-fusion, females emigrate
from their natal group, and both flexibly use communicative signals (vocalizations and gestures
alone and in combination) with other group members as a major part of their daily lives. Both
species produce vocalizations that are context-specific in a variety of ecological, social and
behavioral situations (Crockford & Boesch, 2003; Hopkins, Taglialatela, & Leavens, 2007;
Notman & Rendall, 2005; Slocombe & Zuberbühler, 2005; Taglialatela, Savage-Rumbaugh, &
Baker, 2003). These communicative signals are not only context-specific but are also
intentional.
Captive chimpanzees are known to intentionally produce manual gestures (Call &
Tomasello, 1994; Hostetter, Cantero, & Hopkins, 2001; Krause & Fouts, 1997; Leavens,
Hostetter, Wesley, & Hopkins, 2004; Tomasello, Call, Nagell, Olguin, & Carpenter, 1994) that
include attention-directing gestures such as pointing (Leavens, Russell, & Hopkins, 2005),
attention-getting gestures such as clapping (Hostetter et al., 2001; Leavens et al., 2004), and
facial expressions that are considered iconic gestures and include the ‘juice me’ face (Leavens &
Hopkins, 1998). Like chimpanzees, captive bonobos have also been reported to intentionally
Zimmermann, Zemke, Call, & Gómez, 2009). These types of behaviors are typically produced
when food is located out of reach or when indicating hidden items to people (Zimmermann et al.,
2009). An important factor, though, is that these gestures are exhibited only when a human is
present and oriented toward the subject (Call & Tomasello, 1994; Hostetter et al., 2001;
Kaminski, Call, & Tomasello, 2004; Krause & Fouts, 1997; Leavens, Hopkins, & Bard, 1996;
Leavens et al., 2004; Poss, Kuhar, Stoinski, & Hopkins, 2006; Tomasello, Call, Nagell, Olguin,
& Carpenter, 1994), allowing for engagement in joint attention by alternating their gaze between
the food and the human while gesturing (Leavens & Hopkins, 1998). Chimpanzees also
intentionally produce sounds/vocalizations, including raspberries and extended grunts (Hopkins
et al., 2007). These sounds are also made more often when a human and food are present than
when either is presented alone, highlighting the context-specificity and intentionality of their
communication.
Both species have shown flexibility in their communication by altering or combining the
modalities of communication depending on the context and communicative demands of the
situation. For example, individuals produce more visual AG gestures to a human facing them
than one turned away (Hostetter et al., 2001; Hostetter, Russell, Freeman, & Hopkins, 2007;
Kaminski et al., 2004). Most importantly, they are able to repair their communication when it
has failed by persisting and elaborating their communicative behaviors (Leavens et al., 2005;
Savage-Rumbaugh, 1984; wild bonobos: Pika, Liebal, & Tomasello, 2005). Recently, Lurz and
colleagues (2018) found that chimpanzees produced more visual AG behaviors both when an
experimenter was facing them and when looking at them in a mirror with his/her back to the
chimpanzee, than when the experimenter had his/her back to the chimpanzee and was looking at
behaviors to engage in joint attention and manipulate a human to obtain food they are unable to
otherwise obtain. This is what some have defined as “social tool use.”
1.3 Social Tool Use
Social tool use can be defined as “the physical and psychological manipulations of
animate beings towards some goal” (p. 127, Völter, Rossano, & Call, 2015). Some of the earliest
accounts of social tool use are reported in studies by Crawford in the late 1930s and early 1940s.
Crawford investigated cooperative problem solving tactics in five juvenile chimpanzees on a
box-pulling task (1937, 1941). Crawford found that two of the juveniles employed solicitation
behaviors toward their partner. These behaviors typically occurred when the partner did not
attempt to pull, resulting in either bringing their partner to the grill or to motivate them to pull.
Such behaviors included begging gestures, whimpers, retrieving the partner, and touching the
partner. The solicitations varied in intensity, duration, and frequency depending on factors such
as how responsive the partner was, closeness of friendship, and motivation toward reward.
Crawford suggests that the “solicitation of another animal’s help can be regarded as the selection
of a tool or instrument…[implying] familiarity on the part of the solicitor with the use of other
animals as means or instruments” (p. 69,1937).
In the late 1980s Goméz investigated the problem solving strategies of a gorilla, the
manipulation of objects (physical environment) and of humans (social environment) via
communication. Goméz describes the development of a communicative strategy as starting from
manipulating humans as object tools to “intentional communicative behaviors requesting the
assistance of the human in the attainment of the goal” (p.178, 1986) and become concurrently
available strategies (Goméz, 1988). Thus, it appears that the manipulative (acting on the
suggestions that in human children tool use may be a prerequisite for intentional communication
(i.e., Bates, Benigni, Bretherton, Camaioni, & Violterra, 2014).
In Piaget’s stages of communication, infants show intention when they do something in
order to bring about something else, or in other words use a means to achieve a goal (Frye,
1981). It has been suggested by some that the first communicative gestures of an infant emerge
as a new means to achieve a goal, to direct an adult’s attention to a toy, for example. These
communicative gestures resemble the tool use in Piaget’s 5th stage of communication, where the
infant’s gestures are the tools (Bard, 1990; Frye, 1981). Communicative gestures indicate the
ability to recognize another as a causal agent that has the role of providing a means to an end
(Bard, 1990).
Tool use is typically described as using an object as an intermediate means to achieve a
goal. Communicative gestures can be used as an alternative for direct manipulation of an object
and can be considered a ‘social tool’ where social agents obtain the goal (Bard, 1990). Bard
(1990) has reported that young orangutans use communicative gestures to get their mothers to
give them food and to help them locomote and argues that Piaget’s idea of instrumentalization
(discovery and use of detached objects as a means) lends credence to the ideal of social tool use.
However, ‘social tool use’ can be problematic because what exactly is the tool? Is the
mother the tool because she is the causal agent that brings the goal to the infant? Is the gesture
the tool because it is used to influence the mother’s behavior to achieve the goal? Many would
suggest that the mother is the tool because it is her behavior that is being manipulated, however,
this provides a lack of distinction between the infant physically acting upon the mother and
indirectly acting upon the mother via communication. Here, the mother’s behavior is not under
the gesture is the tool because it is an intentional ‘act’ by the infant. Social tool use requires
understanding of the functional relations between objects and social agents.
Völter and colleagues (2015) break down social tool use, as defined above, into two,
non-mutually exclusive parts: motivational and instrumental. The motivational component involves
the motives underlying the manipulations of others toward a goal. These motives may be either
self- or other-regarding; for example, the ‘user’, or manipulator, must have motivation for
exploiting another to obtain a goal, whereas the ‘tool’, or the manipulated, must have motivation
for helping the ‘user’ (Völter et al., 2015). The instrumental component involves the actual
manipulations of others, ranging from direct physical manipulation/control of others as though
they are inanimate objects to indirect manipulation through the use of communication. An
example of the former would be a mother grabbing her infant’s arm and putting it through a
space too small for her own in order to retrieve a desired object on the other side, much like one
would use a stick (Völter et al., 2015). An example of the latter would be an individual
producing gestures to solicit cooperation/help from another (Crawford, 1937, 1941; Völter,
Rossano, & Call, 2016). Clearer-cut cases of social tool use involve direct physical
manipulations of others as though they are a tool. Some go on to argue that although
communicative behaviors may manipulate another’s behavior, it remains uncertain whether such
behavior is used intentionally to influence the other’s behaviors (Povinelli & O'Neill, 2000).
However, for direct manipulations to occur, there usually has to be a power difference between
partners; such power differences are often associated with low social tolerance (Völter et al.,
2015), making these types of social tool use experiments difficult to conduct and often limited to
It appears that the cognitive processes underlying physical tool use, especially those
related to executive functions such as attention control, response inhibition, causal
understanding, and planning, likely create the basis of social tool use, particularly in the cases
where users physically manipulate their social tool as they would inanimate tool-objects such as
sticks. Furthermore, there are several important features characterizing physical tool use that are
found in social tool use, including: sequential tool use, goal-directedness, and dissociation
between a tool and its functions (Völter et al., 2015). However, social tool use goes beyond
physical tool use in the sense that the users treat the social tool as self-propelled beings. Inherent
is the expectation for the social tool to execute the actions needed for bringing the goal to the
user. Thus, the biggest difference between physical and social tool use is that the tool user takes
into account, and even predicts, the actions of the social tool that they do not directly control
(Völter et al., 2015). Völter and colleagues (2016) suggest that “shared variance between
physical and social tool use might not only be found on the species level but also within species
at the individual level” (p. 16) and the possibility of whether skilled tool users exhibit more
sophisticated forms of social manipulations.
2 AIMS, QUESTIONS, AND HYPOTHESES
While many studies have investigated physical tool use and a small but increasing number on
social tool use, none thus far have explicitly compared physical and social tool use. Perhaps this
is a result of cognition traditionally being dichotomized into two separate components, physical
and social, as manifest by the Primate Cognition Test Battery (PCTB). Developed by Herrmann,
Call, Hernández-Lloreda, Hare, and Tomasello (2007) based on the “theoretical analysis of
primate cognition by Tomasello and Call (1997)” (p. 1361), the PCTB is includes a series of
primates use physical and social cognition together in the wild, they argue that these cognitive
domains are distinct because “physical cognition deals with inanimate objects and their
spatial-temporal-causal relations, whereas social cognition deals with other animate beings and their
intentional actions, perceptions, and knowledge” (p. 1361). Furthermore, they reason that
primate physical cognition abilities evolved mostly in foraging contexts: the ability to deal with
space to find food and the ability to understand causal relations for extracting foods (i.e., tool
use). On the other hand, social cognition evolved in relation to group living, particularly in
relation to cooperation and competition among members: the ability to communicate to
manipulate others’ behavior and the ability to understand others’ states (Theory of Mind) to
predict behavior (Herrmann et al., 2007).
Investigating the factor structure underlying PCTB performance, Herrmann and
colleagues (2010) found that a two-factor model explained chimpanzee performance, one factor
accounting for spatial task performance and the other accounting for physical and social task
performance. Though human children also exhibited a factor model with one factor accounting
for spatial task performance, they showed a three-factor model including two separate factors
accounting for physical and social task performance. While the PCTB is comprised of tasks
assessing both cognitive domains (physical and social), it treats them as separate despite being
used together in the natural world and despite chimpanzees exhibiting a factor model combining
physical (except for spatial tasks) and social task performance into a single factor.
Another explanation for the lack of comparison between physical and social tool use is
that tool use has generally been defined within the domain of physical cognition, though there is
now a growing interest in what is defined as social tool use. Like physical tool use, social tool
social (rather than physical) agent to obtain a desired object that cannot be obtained without
assistance. Though the user is often no longer the agent in social tool use, the goal is the same in
both circumstances (see Leavens et al., 2005 for discussion). Unfortunately, to what extent
similar cognitive processes may underlie physical and social tool use remains largely
uninvestigated from both a developmental and evolutionary perspective.
It seems reasonable that there would be a continuum where a transition between physical
and social modalities happens as one ceases use of the physical tool and solicits help from an
able other. Perhaps, then, cognition is one entity expressed in two ways, one in the physical
domain and one in the social; a consideration initially prompted by anecdotal evidence from
previous research conducted in our laboratory with captive chimpanzees where individuals will
engage in, or initiate, joint attention (pointing/gesturing toward an object and alternating gaze
between the object and whom the communication is directed; e.g., Carpenter, Nagell, Tomasello,
Butterworth, & Moore, 1998; Mundy, 1995; Mundy & Crowson, 1997) when a task is or
becomes too difficult for them.
Given the cognitive abilities of chimpanzees and bonobos, the two overarching aims of this
study were to determine whether there are species differences in tool use (both physical and
social) and whether a threshold exists between physical and social tool use. This study
investigated these aims by presenting subjects with a physical tool use task that increased in
difficulty such that it became a social tool use task. Individual differences were also compared
to previous scores on other tool and socio-communicative tasks, since performance would likely
depend on and change according to task difficulty, motivation, and individual abilities, among
2.1 Species Differences
Based upon what is known regarding the tool using, social, and communicative behaviors
of bonobos and chimpanzees, some hypotheses can be proposed about species differences in in
both physical and social tool use performance. Because chimpanzees are known for their tool
using abilities in the physical realm and bonobos are not, I hypothesized that chimpanzees would
make fewer retrieval attempts and retrieve rewards faster using a physical tool than bonobos at
closer or reachable distances. However, at further or out of reach distances, chimpanzees would
make more attempts before soliciting help from an experimenter than bonobos. Conversely, I
hypothesized that bonobos would make more solicitations and solicit sooner than chimpanzees.
2.2 Distance Differences
As a consequence of the reward being position at further distances, reward retrieval
becomes more difficult. Thus, I hypothesized there would be distance differences in reward
retrieval and solicitation behaviors. With the increase in distance, the task transfers from being a
physical task to a social task requiring subjects to switch strategies from a physical strategy
(using the tool) to a social one (solicit for help). Therefore, I hypothesized that there would be a
decrease in physical tool retrieval attempts and an increase in solicitation when rewards were out
of reach. More specifically, I hypothesized individuals would make fewer retrieval attempts,
make more solicitations, and solicit sooner at these distances. Data supporting these hypotheses
would suggest that there is a transfer between physical and social cognition modalities and that
they lie on a single cognitive continuum.
2.3 Individual Differences
As with any study, there are likely to be individual differences, regardless of species,
hypothesized that physical tool use performance measured by retrieval attempts and latency
would correlate with PCTB physical task performance, while social tool performance, measured
by number of solicitations and solicitation latency, would correlate with PCTB social task
performance and social performance measures on an AG assessment and solicit for tool task (see
methods for description of the two latter mentioned tasks). As mentioned earlier, the PCTB is
used to assess the social and physical cognition skills of nonhuman primates (Herrmann et al.,
2007). Regarding social cognition, the PCTB quantifies gaze following, initiating joint attention,
comprehension of declarative social cues (i.e., gaze and pointing), and elaboration and
persistence in initiating joint attention. Regarding physical cognition, the PCTB tests number
discrimination, tool use, problem solving, understanding causality, spatial discrimination, and
object permanence. Given my hypothesis, I predicted that those with higher scores on the
physical portions of the PCTB, especially those related to tool use, would make fewer attempts
before successfully retrieving the reward and retrieve the reward faster than those with lower
scores, particularly at retrievable distances. I also predicted that those with higher scores on the
social portions of the PCTB, especially those related to communication, would make more
solicitations and solicit sooner. I also expected there to be similar relationships between
solicitation behaviors in this study with AG assessment and solicit for tool performance.
3 METHODS
3.1 Subjects
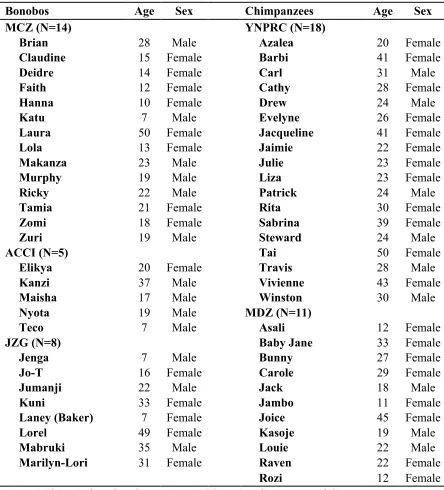
Subjects consisted of 29 chimpanzees including 18 from the Yerkes National Primate
Research Center, Atlanta and Lawrenceville, Georgia (YNPRC) and 11 from the Maryland Zoo
in Baltimore, Baltimore, Maryland (MDZ). There were also 27 bonobo subjects that were
Milwaukee County Zoo, Milwaukee, Wisconsin (MCZ, N = 14), and Jacksonville Zoo and
Gardens, Jacksonville, Florida (JZG, N = 8). Within both samples, 22 apes were male (13
bonobos, 9 chimpanzees) and 34 were female (14 bonobos, 20 chimpanzees), and they ranged in
age from 7 to 50 years (M = 24.43, SD = 11.19; see Table 3.1 for more detailed demographic
information). Subjects had ad libitum access to water and were not food deprived, as all food
rewards were supplemental to their normal daily diet. Testing spanned from November 2016 to
March 2018. This study was conducted in accordance with the American Society of
Primatologists Principles for the Ethical Treatment of Nonhuman Primates, the Committee on
the Care and Use of Laboratory Animal Resources (NRC, 2011), and was approved by the local
institutional animal care and use committee at each institution, including the Chimpanzee
Species Survival Plan for MDZ.
3.2 Attention-Getting Assessment
All subjects underwent an attention-getting assessment prior to testing on the tool use
task. The aim of this was to assess individual tendencies to get or direct attention, which may be
associated with performance on the tool task. During this assessment, the experimenter sat in
front of the subject with a container of food and engaged the subject in husbandry behaviors (i.e.,
body exam commands such as “hand”, “foot”, “belly”) for which they were rewarded with a
piece of food. Once the subject was engaged, the experimenter ceased interaction keeping the
container of food positioned in front of the subject. When an getting or
attention-directing vocalization or gesture, hereafter “AG” (see Table 3.2 for ethogram), was made toward
the experimenter or two minutes elapsed, the experimenter resumed husbandry behavior
interaction to begin the next trial. Subjects were not rewarded immediately following their
communicative signals and receiving food. Subjects received a total of 10 assessment trials.
The number of trials in which subjects made AG signals and the latency of each signal were
[image:35.612.72.516.188.678.2]recorded.
Table 3.1 Subject demographic information
Bonobos Age Sex Chimpanzees Age Sex
MCZ (N=14) YNPRC (N=18)
Brian 28 Male Azalea 20 Female
Claudine 15 Female Barbi 41 Female
Deidre 14 Female Carl 31 Male
Faith 12 Female Cathy 28 Female
Hanna 10 Female Drew 24 Male
Katu 7 Male Evelyne 26 Female
Laura 50 Female Jacqueline 41 Female
Lola 13 Female Jaimie 22 Female
Makanza 23 Male Julie 23 Female
Murphy 19 Male Liza 23 Female
Ricky 22 Male Patrick 24 Male
Tamia 21 Female Rita 30 Female
Zomi 18 Female Sabrina 39 Female
Zuri 19 Male Steward 24 Male
ACCI (N=5) Tai 50 Female
Elikya 20 Female Travis 28 Male
Kanzi 37 Male Vivienne 43 Female
Maisha 17 Male Winston 30 Male
Nyota 19 Male MDZ (N=11)
Teco 7 Male Asali 12 Female
JZG (N=8) Baby Jane 33 Female
Jenga 7 Male Bunny 27 Female
Jo-T 16 Female Carole 29 Female
Jumanji 22 Male Jack 18 Male
Kuni 33 Female Jambo 11 Female
Laney (Baker) 7 Female Joice 45 Female
Lorel 49 Female Kasoje 19 Male
Mabruki 35 Male Louie 22 Male
Marilyn-Lori 31 Female Raven 22 Female
Rozi 12 Female
Table 3.2 Ethogram of attention-getting signals
Attention-getting Auditory Signals
Cage Bang Subject hits mesh or other resonant surface in cage with
hand, foot or object with the intention of creating audible noise
Vocalizations Sounds directed at experimenter and appears under
voluntary control
Raspberries Sounds made by protruding the lips and blowing air out to
produce a splutter type sound
Kisses Sounds made by pursing the lips and sucking air in
Extended Grunts Low frequency sounds made with an open mouth while
expelling air from the lungs
Other Other vocal sounds not listed but have intention of creating
audible noise (i.e., directed panting)
Clap Subject hits hands together or hits hand on another body
part with the intention of creating audible noise
Stomp Subject hits foot on ground with the intention of creating
audible noise Attention-getting Visual Signals
Whole Hand Point Pointing with the whole hand with arm extended toward
food reward and fingers spread apart slightly and the palm either held vertically or facing down
Single Finger Pointing Only a single finger is extended while the other fingers curled in toward the palm
Food Beg Subject extends arms towards experimenter with palm
facing up and hand maintaining a cupping posture
Body Present Subject presents body part(s) towards experimenter
Trade/Barter Subject trades/barters items from cage by 'offering' item to
experimenter
Other Other visual not listed but are directed toward
experimenter (i.e., head bob, shake body part, etcetera)
3.3 Solicit for Tool
After completing the AG assessment, subjects underwent a task in which they were
unable to retrieve a reward unless they requested a tool from the experimenter. Criterion for the
task was 90% successful solicits for tool on two consecutive sessions of 10 trials. Latencies to
solicit for the tool and the number of sessions to reach criterion were recorded.
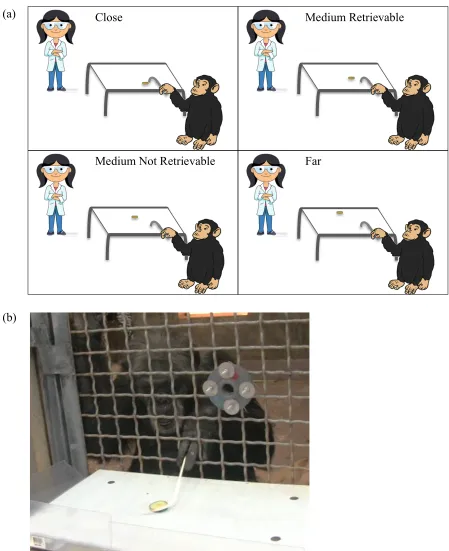
3.4 Physical versus Social Testing
After completing the solicit for tool trials, subjects underwent a tool task aimed to
investigate whether a threshold between physical and social tool use exists and whether species
and individual account for differences in this threshold (see Figure 3.1a for depiction of
experimental set-up). Subjects were presented with a tool task on which they had previously
been trained. Briefly, subjects had been trained to use a hook/J-shaped tool (paper lollipop stick
approximately 30.48 cm in total length) to retrieve a food item placed on a table in front of them
(Figure 3.1b). All subjects included in this study had reached a criterion of 90% successful
retrievals on two consecutive test sessions of at least 10 trials each. For testing, subjects
underwent two testing conditions, one in which an experimenter was absent (EA) and another
which an experimenter was present (EP). Within each condition there were four trials where a
food item was presented at increasing distances from the subject: 1) Close, 2) medium
retrievable with a tool (MR), 3) medium not retrievable with a tool (MNR), and 4) Far. Each
subject underwent two complete sessions of each condition-distance combination for a total of
16, 4-minute long trials in a counterbalanced fashion spread across four days. Subjects were
matched based on age, sex, species and rearing when possible, and sessions were
counterbalanced across subjects/matches such that approximately half received EA-EP-EP-EA
Close Medium Retrievable
Medium Not Retrievable Far
(a)
[image:38.612.70.519.66.617.2](b)
Figure 3.1 Experimental set-up and retrieval example
At the start of each trial, the experimenter placed a food item in the center of the table at a
predetermined distance (Close, MR, MNR, or Far). The hooked/J-shaped tool was handed to the
subject either on left or right side of the table, such that side was equally randomized across
trials. The experimenter then placed additional tools in an accessible location near the table for
the subject and left for the entire four-minute trial during EA trials or remained present during
EP trials. The number of retrieval attempts, latency of retrieval, number of solicitation
behaviors, and the duration of time before a solicitation behavior occurred were recorded. All
trials were recorded via video camera and coded for the measures mentioned above.
3.5 Data Analyses
As previously mentioned, subjects were matched based on age, sex, and rearing when
possible. Independent variables for analyses included species, distance, sex, and age (the latter
treated as a covariate whenever possible). Dependent variables included retrieval attempts,
retrieval latency, number of solicitations, solicitation latency, time at table, and return to tool.
Specifically for individual difference analyses both sex and age were controlled for.
Significance level was set at α = 0.05 for all analyses unless otherwise noted. When data
violated assumptions of parametric tests, non-parametric equivalents were used for analyses with
appropriate non-parametric post-hoc comparisons when needed.
4 RESULTS
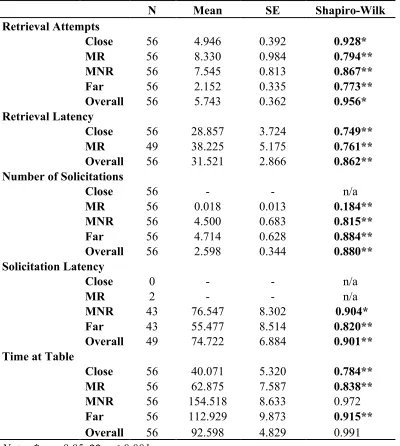
4.1 Descriptive Statistics and Normality Tests
All dependent variables violated normality for each distance except time at table for
MNR and overall distances (Table 4.1). Thus, non-parametric tests were used for analyses,
including Wilcoxon-Signed Ranks, Mann-Whitney U, Kruskal-Wallis, and Friedman tests, with
Table 4.1 Descriptive statistics and normality test results
N Mean SE Shapiro-Wilk
Retrieval Attempts
Close 56 4.946 0.392 0.928*
MR 56 8.330 0.984 0.794**
MNR 56 7.545 0.813 0.867**
Far 56 2.152 0.335 0.773**
Overall 56 5.743 0.362 0.956*
Retrieval Latency
Close 56 28.857 3.724 0.749**
MR 49 38.225 5.175 0.761**
Overall 56 31.521 2.866 0.862**
Number of Solicitations
Close 56 - - n/a
MR 56 0.018 0.013 0.184**
MNR 56 4.500 0.683 0.815**
Far 56 4.714 0.628 0.884**
Overall 56 2.598 0.344 0.880**
Solicitation Latency
Close 0 - - n/a
MR 2 - - n/a
MNR 43 76.547 8.302 0.904*
Far 43 55.477 8.514 0.820**
Overall 49 74.722 6.884 0.901**
Time at Table
Close 56 40.071 5.320 0.784**
MR 56 62.875 7.587 0.838**
MNR 56 154.518 8.633 0.972..
Far 56 112.929 9.873 0.915**
Overall 56 92.598 4.829 0.991..
Note. * p < 0.05, ** p ≤ 0.001
4.2 Condition Differences
The purpose of including an EA condition was to determine if there was an audience
effect on performance, specifically solicitation behavior. Thus, the variable of interest for this
analysis was solicitation during EA and EP trials. Individuals were scored a 0 if they did not
0 20 40 60 80 100
EA EP
N u mb er of T ri al s Condition * .
the EA condition, occurring on only 12 of 224 trials (~5%), compared to 88 (~39.3%) during the
EP condition (Figure 4.1). Chi-Square analyses showed this to be a significant difference (χ2(1)
= 72.41, p < 0.001). Within the EA condition, solicitation was rare for all distances (1 Close, 1
MR, 4 MNR, 6 Far, out of 56 total trials per distance). Solicitation was equally rare during the
EP condition on Close and MR trials (0 and 2 of 56 trials; Fisher’s Exact Test, p = 1.00). This
was expected since the reward was retrievable and solicitation was not necessary. Solicitation
had a significantly higher occurrence during the MNR and Far distances in the EP condition (43
trials or 76.3% each) than the EA condition (MNR: 4 or 7.2%, χ2(1) = 52.393, p < 0.001; Far: 6
or 10.8%, χ2(1) = 47.020, p < 0.001; Figure 4.2). Because the presence of a person significantly
altered solicitation behaviors, only data from the EP condition were used in all subsequent
analyses.
[image:41.612.169.442.382.562.2]
Figure 4.1 Overall trials solicited on during EA and EP conditions
Figure 4.2 Number of trials solicited for each distance during EA and EP conditions Number of trials in which individuals solicited across experimenter absent (EA) and experimenter present (EP) conditions according to distance. * p < 0.05
4.3 Species Differences
4.3.1 Retrieval Attempts
For this and all other species comparisons N = 56 (bonobo = 27, chimpanzee = 29) unless
otherwise noted. Kruskal-Wallis tests with species as the independent variable and retrieval
attempts as the dependent variable were used to determine whether species differences exist in
retrieval attempts for each distance. The tests revealed bonobos made more retrieval attempts
than chimpanzees at Close (mean rank bonobo = 33, chimpanzee = 24; χ2(1) = 4.53, p = 0.033)
and Far (mean rank bonobo = 35, chimpanzee = 22; χ2(1) = 8.83, p = 0.003) distances. There
were no species differences at the two intermediate distances (MR: χ2(1) = 0.190, p = 0.663;
MNR: χ2(1) = 0.097, p = 0.755).
However, because the total time spent at the table during trials varied, it was suspected
that this might influence effects related to reward retrieval. Thus, regression analyses were used
0 9 18 27 36 45
Close MR MNR Far
to investigate whether the relationship between species and retrieval attempts at Close and Far
distances was mediated by time at table. Results indicated that species was a significant
predictor of Close time at table (B = -28.613, SE = 10.014, p = 0.006) and Close time at table
was a significant predictor of Close retrieval attempts (B = 0.055, SE = 0.007, p < 0.001),
suggesting mediation. When controlling for Close time at table species was no longer a
significant predictor of Close retrieval attempts (B = -0.142, SE = 0.562, p = 0.802); thus, the
effect was completely mediated by time at table, which accounted for over 90% of the effect. A
Sobel test revealed this to be a significant mediation effect (Sobel Test = 5.469, p < 0.001).
Standardized regression coefficients and confidence intervals related to the mediation analysis
[image:43.612.116.468.357.534.2]are found in Figure 4.3.
Figure 4.3 Mediation of Close retrieval attempts by time at table
Standardized regression coefficients for the relationship between species and Close retrieval attempts as mediated by time at table. The standardized regression coefficient for the indirect effect between species and Close retrieval attempts is in parentheses. * p < 0.05
When comparing species on time at table, Mann-Whitney U tests showed that bonobos
stay longer at the table at Close distances than chimpanzees (mean rank bonobo = 35.39,
chimpanzee = 22.09; U = 205.5, p = 0.002). With regard to Far retrieval attempts, time at table
Species Close Retrieval
Attempts Close Time
at Table
-0.36* 0.75*
CI [-48.69, -8.54] CI [0.04, 0.07]
-0.30* (-0.72)
was not related to retrieval attempts (r(54)= 0.130, p = 0.339) and thus did not have a significant
mediating effect. However, Mann-Whitney U tests indicated that chimpanzees stayed longer at
the table at Far distances than bonobos (mean rank bonobo = 23.76, chimpanzee = 32.91; U =
519.5, p = 0.036). No species differences on MR and MNR retrieval attempts were evident, and
tests indicated no species differences on time at table for either MR (Mann-Whitney U: 337.5, p
= 0.294) or MNR (ANOVA: F(1,54) = 3.758, p = 0.058) distance.
Although no species differences on MR and MNR retrieval attempts were evident,
regression analyses were used to account for time at table, with species and sex included in the
model. The regression analyses revealed that the independent variables (IVs) explained 64% of
the variance in attempt differences at MR distances (F(3,52) = 30.682, p < 0.001; R2 = 0.639,
R2adjusted = 0.618) and 21% of the variance in attempt differences at MNR distances (F(3,52) =
4.491, p = 0.007; R2 = 0.206, R2adjusted = 0.160). Only time at table significantly added to the
model for MR (t = 9.462, p < 0.001) and MNR distance (time: t = 3.503, p = 0.001).
Additionally, there were no species differences on time at table for either MR (Mann-Whitney U:
337.5, p = 0.294) or MNR (ANOVA: F(1,54) = 3.758, p = 0.058) distance.
4.3.2 Retrieval Latency
Univariate ANOVAs with species and sex as independent variables, age as a covariate,
and retrieval latency as the dependent variable were used to determine whether there were
differences in retrieval latency between species at Close (N = 56) and MR (N = 49) distances.
However, the data violated the equality of error variance assumption (Levene’s Test F(3,52) =
8.866, p = .001) for Close distances, so a Mann-Whitney U test was run. The test revealed that
bonobos (mean rank 35.78) were slower at retrieving reward at Close distances than
differences in retrieval latency at MR distances (F(1,44) = 1.124, p = 0.295), but older individuals
were slower (F(1,44) = 6.850, p = 0.012, y = 11.6 + 1.06x).
As mentioned previously, it was suspected that total time spent at the table during trials,
which varied, might influence effects on reward retrieval. Thus, regression analyses were used
to investigate whether the relationship between species and retrieval latency at Close and MR
distances was mediated by time at table. With respect to Close distance, results indicated that
species was a significant predictor of time at table (B = -28.613, SE = 10.014, p = 0.006) and
time at table was a significant predictor of retrieval latency (B = 0.432, SE = 0.075, p < 0.001),
suggesting mediation. When controlling for time at table, species had a dampened effect on
retrieval latency (B = -12.876, SE = 6.156, p = 0.041), thus the effect was partially mediated by
time at table, accounting for approximately 45% of the effect. A Sobel test revealed this to be a
significant mediation (Sobel Test = 4.05, p < 0.001). Standardized regression coefficients and
confidence intervals related to the mediation analysis can be found in Figure 4.4. As reported
[image:45.612.116.469.471.643.2]earlier, bonobos stayed longer at the table at Close distances than chimpanzees.
Figure 4.4 Mediation of Close retrieval latency by time at table
Standardized regression coefficients for the relationship between species and Close retrieval latency as mediated by time at table. The standardized regression coefficient for the indirect effect between species and Close retrieval latency is in parentheses. * p< 0.05
Species Close Retrieval Latency
Close Time at Table
-0.36* 0.53*
CI [-48.69, -8.54] CI [0.23, 0.53]
-0.43* (-0.23*)
Although no species differences on MR retrieval latency were evident, an additional
Univariate ANOVA was run with time at table included as a covariate. Age was no longer
significant (F(1,43) = 0.255, p = 0.616), while time at table was with those spending more time at
table were slower at retrieving (F(1,43) = 26.074, p < 0.001, y = 10.2 + 0.6x).
4.3.3 Number of Solicitations
Kruskal-Wallis tests with species and sex as independent variables and number of
solicitations as the dependent variable were used to determine whether there were differences in
number of solicitations between species at each distance. With regard to the number of
solicitations, chimpanzees solicited a greater number of times than bonobos for MNR (mean rank
bonobos = 28.6, chimpanzees = 38.1; χ2(1) = 4.70, p = 0.029) and Far (mean rank bonobos =
22.8, chimpanzees = 33.8; χ2(1) = 6.34, p = 0.012) distances but not at the two closest distances
(Close: χ2(1) = 0.00, p = 1.00; MR: χ2(1) = 0.003, p = 0.959). This result is in opposition to what
was hypothesized. Since the total time spent at the table during trials might influence effects on
number of solicitations, regression analyses were run to investigate whether the relationship
between species and number of solicitations at MNR and Far distances was mediated by time at
table. With regard to MNR distance, time at table did not correlate with number of solicitations
(r(54) = 0.235, p = 0.081), suggesting no significant mediation. With respect to Far distance,
species was a significant predictor of time at table, as reported previously, and time at table was
a significant predictor of number of solicitations (B = 0.023, SE = 0.007, p = 0.006), suggesting
mediation. When controlling for time at table, species no longer had a significant effect on
retrieval attempts (B = 2.209, SE = 1.216, p = 0.075). Because the effect of species disappeared
when accounting for time at table, the effect completely mediated by time at table, which