ISSN 2250-3153
Performance Comparison of Conventional, Genetic
Algorithm and Particle Swarm Optimization for optimal
design of Transformer with respect to its Total Owning
Cost
Kokila R
*, Anagha C
**, Neethu P
** *Power Electronics and Drives, Karunya University, Coimbatore, India
**
Power Systems , Saintgits College of Engineering, Kottayam, India
**
Power Electronics and Drives, Govt. College Of Engineering, Kannur, India
Abstract- Evaluation of Transformer Owning Cost (TOC) plays an important role during the selection of a transformer by an industrial customer. The dependency and the relationship between the transformer design and the TOC is used to obtain a cost optimal design for the test case. The TOC evaluation by conventional method is compared with those of results obtained after optimizing design variables using Genetic Algorithm (GA) and Particle Swarm Optimization (PSO), out of which the latter has provided a much minimized solution than the other two methods. Thus a minimized total owning cost is obtained using design variables optimized by particle swarm optimization technique.
Index Terms- Optimisation,Genetic Algorithm(GA), Particle Swarm Optimisation(PSO), Total Owning Cost(TOC)
I. INTRODUCTION
he quality of transformers depends on good design. Generating plants, generating the bulk of AC power at high voltage are concentrated in few favorably situated stations. The power so generated is then transmitted at appreciably high voltage to reduce the amount of conducting material and to increase the transmission efficiency. However the distribution of power should be carried out at low voltage. Hence generated power is transformed twice, thrice or even four times before it is utilized. A transformer is a static device by means of which electric power in one circuit is transformed into electric power of the same frequency in another circuit. Building electrical equipment as economically as possible to meet the performance expectations of the intended application is of paramount importance for the manufacturers of electrical apparatus. The aim of design is to obtain completely the dimensions of all the parts of the machine to furnish data to manufacturers. While designing a transformer much emphasis should be placed on lowering its cost by saving the materials and reducing to a minimum labour consuming operation in its manufacture. The design should be satisfactory with respect to electrical strength, mechanical ruggedness, dynamic and thermal resistance of winding in the event of short circuit. Thus only the joint efforts of the designer and production engineer can develop new design of transformer
satisfying closely the technical requirements with good reliability in service and with minimum cost.
This paper presents the design for rectifier transformer coil using Genetic algorithm[2]. The optimization data show that the improved genetic algorithm which can produce performance improvements in execution time and accuracy for a given coil optimization design is effective for practical use. [4] minimized the cost of power transformer using Chaos genetic algorithm. [1] proposed optimal design of power transformer using particle swarm optimization and minimized ratio and phase displacement errors and construction cost. [3] proposed the idea of using Particle swarm optimization in design of Rectifier transformer.
[image:1.612.343.546.454.610.2]II. CONVENTIONAL DESIGN OF TRANSFORMERS
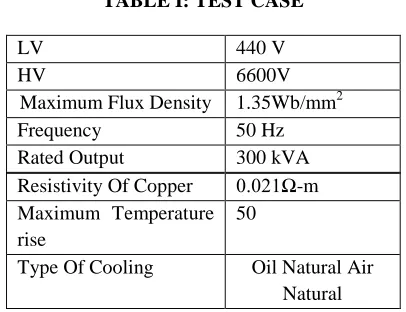
TABLE I: TEST CASE
A. IRON LOSS CALCULATION
When voltage is applied to the exciting or primary winding of the transformer, a magnetizing current flows in the primary winding. This current produces the flux in the core. The flow of flux in magnetic circuits is analogous to the flow of current in electrical circuits. When flux flows in the steel core, losses occur in the steel. This loss is constant throughout the operation of the transformer irrespective of its loading.
T
LV 440 VHV 6600V
Maximum Flux Density 1.35Wb/mm2
Frequency 50 Hz
Rated Output 300 kVA
Resistivity Of Copper 0.021Ω-m Maximum Temperature
rise
50
Volume of core = No. of limbsxCore areaxHeight of Core Weight of core = Volume of core X Specific weight of iron Volume of yoke = 2 X Area of yoke X Length of yoke Weight of yoke = Volume of yoke X Specific weight of iron Core loss = Weight of core X Specific loss in Core
Yoke loss = Weight of yoke X Specific loss in Yoke Total iron loss = Core loss + Yoke loss
B. COPPER LOSS CALCULATION
Copper weight calculation involves calculation of both HV and LV windings together.
LV side:
Volume of copper in LV = No. of limbs X Area of LV X LV Turns X mean length of LV turns
Weight of copper=Volume of copper in LV X specific gravity of copper
HV side:
Volume of copper in HV= No. of limbs X area of HV X HV turns X mean length of HV turns
Weight of copper= Volume of copper in HV X specific gravity of copper
HV copper loss =(Phase current in HV) 2 X Resistance of HV Winding
TOTAL COPPER LOSS =LV COPPER LOSS+ HV COPPER LOSS
LV copper loss= (Phase current in LV) 2 X Resistance of LV Winding
Weight of copper = Volume of copper in LV X Specific gravity of Copper
Total Owning Cost TOC = Cost of materials + Cost of No load loss + Cost of Load loss
Cost of Core loss = A X No load loss in Watts Cost of Load loss = B X Load loss in Watts Where,
A = Avg. power cost X Avg. no-load running time during life period
B = Avg. load rate during life period X Load running time during life period X Avg. power cost
C. LOAD PROFILE
[image:2.612.332.556.79.141.2]Fig I: Load profile
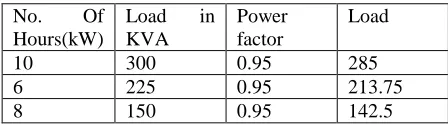
TABLE II. LOAD PROFILE
No. Of Hours(kW)
Load in KVA
Power factor
Load
10 300 0.95 285
6 225 0.95 213.75
8 150 0.95 142.5
Total Cu loss for a day ie, 24 hrs = (10* 3.6032) + (6* 2.0268) + (8* 0.9008) = 55.3986 kWhr
Cu loss at full load ie, 285 kW = 3.6032 kW Cu loss at 3/4th of load ie, 213.75 kW = 2.0268 kW Cu loss at 1/2th load ie, 142.5 kW = 0.9008 kW
CONVENTIONAL COST OF MATERIALS
TABLE III. COST OF MATERIALS
PART MATERIAL COST
CORE Hot rolled steel 31 Rs/kg
COIL Copper 445 Rs/kg
TANK Mild Steel 50 Rs/kg
OIL Refined
mineral oil
15 Rs/litre
TUBE Mild steel 50 Rs/kg
weight of core = 719.3606 kg weight of copper = 228.1570 kg weight of tank = 177.5301 kg total volume of oil = 571.6786 litres weight of tube = 246.7143 kg
Total Material Cost = (31*weight of core)+ (445*weight of copper)+ (total volume of oil*15)+ (weight of tank*50)+ (weight of tube*50) = (31*719.3606)+(445*228.1570)+ (571.6786*15)+ (177.5301*50)+(246.7143*50) = 1,53,595 Rs
CONVENTIONAL TOTAL COST AND EFFICIENCY Energy transformed:
300 kVA * 0.95 * 8,760 = 2,496.6 MWh / year Efficiency
= (kva*power factor)/((kva*powerfactor)+total losses))*100= (300*0.95)/((300*0.95)+5354.2)*100 = 98.156 % Lifetime cost:
Transformer: 1,53,595 Rs Iron loss: 8,05,330 Rs Copper loss: 10,61,575 Rs
Total 20,20,500 Rs
III. ESTIMATION OF TOC USING GENETIC ALGORITHM
ISSN 2250-3153
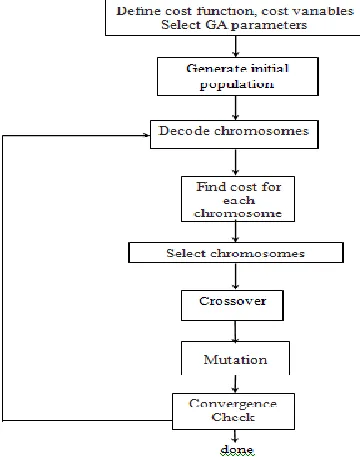
Fig II: Flowchart of Genetic algorithm
B. PROBLEM FORMULATION Step 1: Objective Function definition
Min{CFeXGFe + CCuXGCu + Ctu(Gtu+Gtk) + ColXGol+ce (hoXPo +
kXhr XPr )}
cFe , unit price of iron, (Rs/kg)
cCu, unit price of copper conductor, (Rs/kg)
ce , average power cost
ho , average no-load running time during life period
k , average load rate during life period
hr, load running time during life period
GFe, weight of iron
GCu, weight of copper conductor
Po, no-load running loss of transformer
Pr , rated load loss of transformer
Ctu , Cost of tube material (Rs/kg)
Gtu , Weight of tube
Gtk , Weight of tank
Col , Cost of oil (Rs/litre)
Gol , Volume of oil
Step 2: Basic design variables There are six design variables: 1.Maximum flux density, Bm 2.Current Density, δ in LV winding 3.Current Density , δ in HV winding 4.Window space factor, kw
5.Yoke area in terms of core area,% 6.K factor
Step 3: The Constraints considered are, Weight of the Iron <Conventional results Weight of the Copper <Conventional results No-Load loss in a transformer < Rated no load loss Load loss in a transformer < Rated load loss
Impedance percentage <Specified impedance percentage
Step 4: Set,
Population size = 100 Crossover probability = 0.8 Generations = 50
Stall generations = 50
Step 5: After 7 to 10 GA runs, the global optimum is reached for the problem.
Thus, the design variables are optimized in such a way that a minimized Total Owning Cost is obtained.
IV. ESTIMATION OF TOC USING PARTICLE SWARM OPTIMISATION(PSO)
Particle swarm optimization (PSO) is a population based stochastic optimization technique inspired by social behavior of bird flocking or fish schooling.PSO shares many similarities with evolutionary computation techniques such as Genetic Algorithms (GA). The system is initialized with a population of random solutions and searches for optima by updating generations. However, unlike GA, PSO has no evolution operators such as crossover and mutation. In PSO, the potential solutions, called particles, fly through the problem space by following the current optimum particles.Each particle keeps track of its coordinates in the problem space which are associated with the best solution (fitness) it has achieved so far. This value is called pbest. Another "best" value that is tracked by the particle swarm optimizer is the best value, obtained so far by any particle in the neighbors of the particle. This location is called lbest. When a particle takes all the population as its topological neighbors, the best value is a global best and is called gbest. After finding the two best values, the particle updates its velocity and positions with following equation (a) and(b).
v[]=[]+c1*rand()*(pbest[]-present[])+c2*rand()*(gbest[]-present[]) -- (a)present[]=present[]+v[] --(b)
v[] is the particle velocity present[] is the current particle (solution). pbest[] and gbest[] are defined as stated before. rand () is a random number between (0,1). c1, c2 are learning factors. usually c1 = c2 = 2.
The particle swarm optimization concept consists of, at each time step, changing the velocity of (accelerating) each particle toward its pbest and lbest locations (local version of PSO). Acceleration is weighted by a random term, with separate random numbers being generated for acceleration toward pbest and lbest locations.
A. PROBLEM FORMULATION
Fig III. Flowchart of PSO
[image:4.612.323.552.56.364.2]V. RESULT ANALYSIS
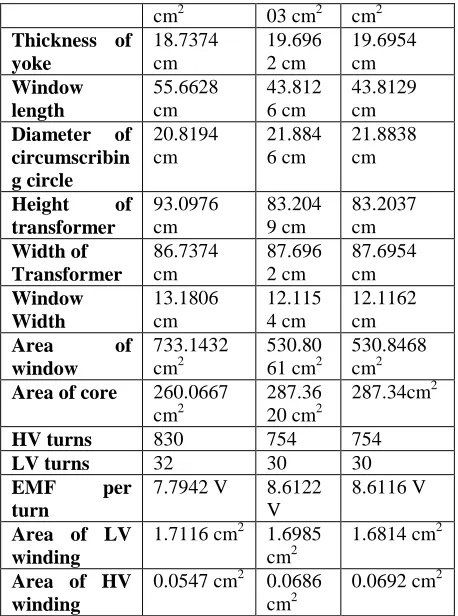
TABLE IV. RESULT ANALYSIS
PARAMETE RS
CONVEN TIONAL
GA PSO
Cost 20,20,500
Rs 18,32,3 54 Rs 18,32,294 Rs Maximum efficiency
98.2677% 98.441 9%
98.4420%
Efficiency 98.1560% 98.375
7%
98.3757%
No. of tubes 40 32 32
No load loss 1.7511 kW 1.6825
kW
1.6825 kW
Impedance % 2.06% 2.4434
%
2.4439%
Weight of
copper 228.1571 kg 249.98 99 kg 250 kg
Load loss 3.6032 kW 3.0230
kW
3.0231 kW
Width of tank 41.0093
cm
42.964 4 cm
42.9650 cm
Length of
tank 107.0093 cm 108.96 44 cm 108.9650 cm
Height of
tank 138.0976 cm 128.20 37 cm 128.2037 cm
Weight of
iron 719.3696 kg 703.69 16 cm 703.6907 kg
Area of yoke 299.0778 316.12 316.0740
cm2 03 cm2 cm2 Thickness of
yoke 18.7374 cm 19.696 2 cm 19.6954 cm Window length 55.6628 cm 43.812 6 cm 43.8129 cm
Diameter of
circumscribin g circle 20.8194 cm 21.884 6 cm 21.8838 cm
Height of
transformer 93.0976 cm 83.204 9 cm 83.2037 cm Width of Transformer 86.7374 cm 87.696 2 cm 87.6954 cm Window Width 13.1806 cm 12.115 4 cm 12.1162 cm
Area of
window
733.1432 cm2
530.80 61 cm2
530.8468 cm2
Area of core 260.0667
cm2
287.36 20 cm2
287.34cm2
HV turns 830 754 754
LV turns 32 30 30
EMF per
turn
7.7942 V 8.6122 V
8.6116 V
Area of LV winding
1.7116 cm2 1.6985 cm2
1.6814 cm2
Area of HV winding
0.0547 cm2 0.0686 cm2
[image:4.612.286.581.411.687.2]0.0692 cm2
TABLE V. COMPARISON OF GA AND PSO
Fig IV: Plot for GA
VALUE GA PSO
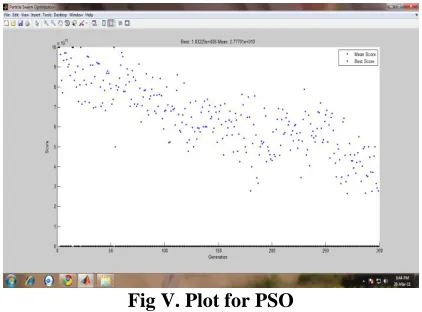
Minimum 18,32,354.2851 18,32,294.1086
Mean 18,32,624.6595 18,32,624.4115
[image:4.612.45.271.428.736.2]ISSN 2250-3153
Fig V. Plot for PSO
VI. CONCLUSION
In this paper, the Total owning cost of transformer is minimized using Genetic Algorithm and Particle Swarm Optimization. This objective was achieved through the above mentioned algorithms using Matlab. By using the above mentioned method, both iron losses and load losses have been minimized, thereby increasing the efficiency of the transformer. New enhanced transformer design variables were obtained subsequently which results in overall reduction of transformer owning cost for a period of 15 years and improvement in the efficiency of transformer. Hence it can be inferred that minimization using PSO shows better results when compared
with GA. The result shows that both PSO and GA works well and is helpful for optimal design of transformer.
REFERENCES
[1] Guowei wu, Herighen Bai, Jiang Du, Juhuan Shen, “Improved PSO Algorithm and its application in optimal design for Rectifier Transformer”, IEEE 2010, pp. 605-608
[2] Qinghe Hu, Shuang Zhang, Xing Weiwang, Zhiling Zhu, “Application of chaos genetic algorithm to transformer optimal design”, IEEE 2009, Interntional Workshop on Chaos-Fractals Theories and Applications, pp 108-111
[3] Amir Bagheri, Arash Shabani and Vahid Rashtehi, “Optimal design of Measurement type current transformer using PSO”, 2008 International Conference on Emerging Technologies, IEEE 2008
[4] Cui Duwu, Wang Zhurong, Yu Gang, Zhuohong Fang, “Optimization design of rectifier transformer coil based on Genetic Algorithm”, IEEE pp. 549-552
AUTHORS
First Author – Kokila R, pursuing M.Tech in Power Electronics and Drives, Karunya University, Coimbatore, TamilNadu , kokila,[email protected]
Second Author – Anagha C, pursuing M.Tech in Power Systems, Saintgits College Of engineering, Kottayam, Kerala, [email protected]
Third Author – Neethu P, pursuing M.Tech in Power