A Study of Brand Equity and Marketing Mix
Constructs Scale Invariance in UAE
Mohammad Shariq1
1
Visiting Faculty-Marketing, Delhi-NCR
DOI: 10.29322/IJSRP.8.4.2018.p7639
http://dx.doi.org/10.29322/IJSRP.8.4.2018.p7639
Abstract- The purpose of this research is to test measurement invariance, of previously developed scales, to evaluate brand equity and marketing mix constructs in the United Arab Emirates (UAE) consumer market. A total of 10 constructs are considered for the study. Five of which are brand equity constructs of Brand Awareness, Brand Loyalty, Perceived Quality and Brand Associations with Overall Brand Equity (OBE) and five marketing mix elements – Price, Distribution Intensity, Advertising, Price Promotions and Non-price promotions. Scales from previous studies are selected and a questionnaire developed to collect data. Data was collected for 359 consumers across age and gender among the English speaking expatriate population. Lisrel 8.8 and SPSS is used to test construct reliability. The findings of this research are that the scales developed in previous studies are invariant in the UAE. They show good reliability and validity.These scales can be used in brand equity studies involving English speaking consumers in the region.
Index Terms- Brand equity, Marketing Mix Elements, FMCG, UAE, Structural Equation Modeling, Brand Awareness, Brand Loyalty, Perceived Quality, Brand Associations
I. INTRODUCTION
rand equity (BE) is a key concept in brand management. Its definition and management is a subject of various books, articles and research. Its importance stems from providing valuation to a brand. The valuation of a brand can be done in financial terms and consumer perspective. The consumer based brand equity (CBBE) is reflected in the financial brand equity. The stronger the CBBE – the higher will be the financial value of the brand. Consumer based brand equity is a multidimensional concept comprising of various constructs – prominent among them being brand loyalty, perceived quality, brand awareness and brand association (Aaker 1991). The brand equity dimensions in turn are functions of marketing mix – product, price, promotions and placement. Brand equity models have been conceptualized by leading brand thinkers, prominent among them are Aaker’s brand equity model (1991). Conceptual models have to be operationalized so as to have practical use. Yoo (2000) first operationalized the model followed by verification studies in other cultures and categories with varying results.
Operationalization studies have been carried out in various countries and scales developed to measure the various constructs. The purpose of this study is to test the scales, which have been developed in previous studies and their invariance in measuring constructs in UAE. Previous researches have recommended that the scales be tested in various countries and categories for invariance. This study follows from that recommendation.
II. LITERATURE REVIEW
Brand equity measurement scales
Brand equity can be deconstructed into various dimensions which in turn are impacted by various marketing activities – these have been hypothesized in various brand equity development models (Aaker 1991, Keller 1993, Kapferer 1994). In a detailed literature review, a total of 11 key brand dimensions have been identified. They are perceived quality, Brand Associations, brand Loyalty, brand awareness, brand Image, brand personality, attitude, trust, satisfaction, esteem and attachment. Various models have been hypothesized with marketing mix elements being the independent variables, which impact the brand equity dimensions creating an overall brand equity. Some of the models have been operationalized and scales developed to measure the constructs (Yoo 1997, 2000, 2001, Pappu 2006, Buil 2008).
Aaker (1993) notes that “there is a need for brand equity measures that can be used to evaluate the brand-building activities of managers in different product markets” he goes on to say “The challenge for many brands is to develop credible and sensitive measures of brand strength that supplement financial measures with brand asset measures.
There are two basic approaches to measuring customer based brand equity. The "indirect" approach attempts to assess potential sources of customer-based brand equity by measuring brand knowledge (i.e., brand awareness and brand image). The "direct"
approach attempts to measure customer-based brand equity more directly by assessing the impact of brand knowledge on consumer response to different elements of the firm's marketing program. The indirect and direct approaches to measuring customer-based brand equity are complementary and should be used together (Keller, 1993).
Lassar et al (1993) were among the first to work on developing scales to measure brand equity. They operationalized brand equity as “the enhancement in the perceived utility and desirability a brand name confers on a product”. It is the consumers’ perception of the overall superiority of a product carrying that brand name when compared to other brands. The scales measured 5 constructs of performance, social image, value, trustworthiness and attachment. The scales were developed after four studies in which the initial scale of 83 items were narrowed to 17. The resulting scale was significantly correlated with an overall measure of brand equity. The scale was tested in two product categories where it was found that prices reflected the equity associated with the brand.
Yoo (1997, 2001) in a first of is kind study on brand equity explores the relationships between selected marketing mix elements and the creation of brand equity. They proposed a conceptual framework in which marketing elements are related to the dimensions of brand equity, that is, perceived quality, brand loyalty, and brand associations combined with brand awareness. These dimensions are then related to brand equity. The empirical tests using a structural equation model support the research hypotheses. The results show that frequent price promotions, such as price deals, are related to low brand equity, whereas high advertising spending, high price, good store image, and high distribution intensity are related to high brand equity. A 34 item measurement scale was developed, of which 4 items were to measure overall brand equity, 19 to measure the brand equity dimensions and 15 to measure the marketing mix constructs.
Washburn(2002) working on the scales proposed by Yoo & Donthu (1997, 2001) – tested a total of 7 constructs – MBE (4), OBE (1) and two constructs measuring attitude toward the brand and purchase intention slightly modified and in a different context to examine the robustness of the scale. The results of the ten-item, three-factor MBE model are most consistent with Yoo and Donthu’s (1997) findings. The researchers were able to improve the model using Yoo and Donthu’s (1997) same three-factor structure but by examining all 15 items rather than the ten item ultimately used by Yoo and Donthu (1997). The analysis also found acceptable fits, with acceptable composite reliability and variance extracted, for a four-factor MBE model, again starting with 15 items. In situations where a four-factor analysis is imperative, it is recommended that is be used with caution. This model should be used with even closer attention paid to fit and residuals. The results of this research provide some support for Yoo and Donthu’s (1997) OBE model and three-factor MBE models. Nonetheless, the support is inadequate to offer an unconditional endorsement of Yoo and Donthu’s (1997) brand equity measures.
Buil (2008), developed and tested a 6 construct model to study the measurement invariance of the consumer-based brand equity scale across two samples of UK and Spanish consumers. Their findings were that the brand equity scale was invariant across the two countries. The Results showed that the consumer-based brand equity scale has similar dimensionality and factor structure across countries. In addition, consumers responded to the items of brand equity in the same way, which allows meaningful comparison of scores.
Tong (2009) explored the effectiveness of eight selected marketing activities in creating brand equity in the Chinese clothing market. The results indicate the positive effects of store image, celebrity endorsement, event sponsorship, web advertising, and non-price promotions on brand equity in China as well as the detrimental impact of frequent price promotions. A 20 items scale was used to measure the constructs.
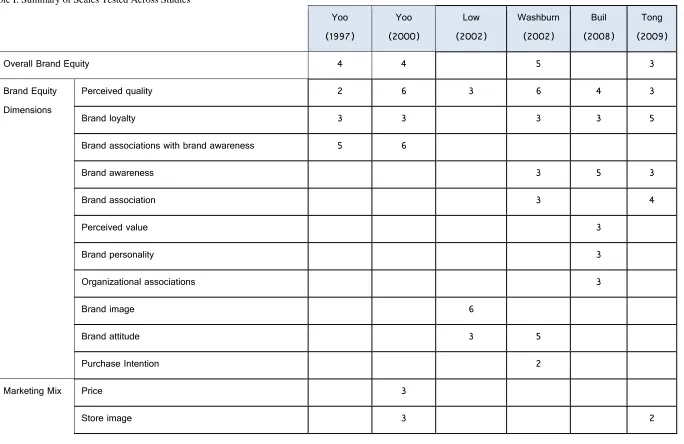
A total of 10 constructs were identified for this study – 5 endogenous being Brand Equity, Brand Awareness, Brand Loyalty, Perceived Quality and Brand Associations and 5 exogenous and independent constructs namely Price, Distribution Intensity, Advertising, Price Promotions and Non-Price Promotions that will be measured. A total of 33 measurement items were identified for the study. The scales used were initially developed by Yoo and Donthu (2000, 2001) and subsequently used in as is or adapted by Rajh (2005), Atilgan (2005), Pappu (2005), Yasin (2007), Buil (2008), Tong (2009). Refer to Table 1 for a summary.
Multi-Item Scale Evaluation
A multi-item scale needs to be evaluated for accuracy and applicability which is done through an assessment of reliability, validity, and dimensionality of the scale (Hair, 2006; Malhotra, 2007).
Reliability
Reliability is an assessment of the degree of consistency between multiple measurements of a variable (Hair, 2006). It refers to the extent to which a scale produces consistent results if repeated measurements are made. Reliability is assessed by determining the proportion of systematic variation in a scale which is done by determining the scores obtained from different administrations of the scale. If the association is high, the scale yields consistent results and is therefore reliable. Of the three approaches for assessing reliability (test-retest, alternative-forms and internal consistency methods) we will take the internal consistency approach. Internal consistency reliability is used to assess the reliability of a summated scale where several items are summed to form a total score. In a scale of this type, each item measures some aspect of the construct measured by the entire scale, and the items should be consistent in what they indicate about the characteristic. This measure focuses on the internal consistency of the set of items forming the scale. The coefficient alpha or Cronabach’s alpha will be used to test the internal consistency reliability (Malhotra, 2007).
Reliability coefficient with Cronbach’s Alpha – generally agreed lower limit is .70 although it may decrease to .60 in exploratory research. A value of 0.6 or less generally indicates unsatisfactory internal consistency reliability (Hair, 2006).
Validity
Validity is the extent to a scale or a set of measures accurately represents the concept of interest (Hair, 2006). The validity of a scale may be defined as the extent to which differences in observed scale scores reflect true differences among objects on the characteristic being measured, rather than systematic or random error (Malhotra, 2007). Content validity and construct validity are what will be assessed here.
Content validity is the assessment of the correspondence of the variables to be included in a summated scale and its conceptual definition. This form of validity, also known as face validity, subjectively assesses the correspondence between the individual items and the concept through ratings by expert judges, pretests with multiple sub-populations, or other means. The objective is to ensure that the selection of scale items extends past just empirical issues to also include theoretical and practical considerations (Hair 2006). It is a subjective but systematic evaluation of how well the content of a scale represents the measurement task at hand where the researcher or someone else examines whether the scale items adequately cover the domain of the construct being measured (Malhotra, 2007).
Scales selected for this study were adapted from previous studies, they were also run by marketing professionals and consumers for assessment.
Construct validity addresses the question of what construct or characteristic the scale is measuring where the researcher attempts to answer theoretical questions about why the scale works and what deductions can be made concerning the underlying theory which therefore requires a sound theory of the nature of constructs being measured and how it relates to other constructs (Malhotra, 2007).
Construct validity is the extent to which a set of measured items actually reflects the theoretical latent construct those items are designed to measure. Thus, it deals with the accuracy of measurement. Evidence of construct validity provides confidence that item measurers taken from a sample represent the actual true score that exists in the population (Hair, 2006).
A. Convergent validity
Table I: Summary of Scales Tested Across Studies
Yoo (1997)
Yoo (2000)
Low (2002)
Washburn (2002)
Buil (2008)
Tong (2009)
Overall Brand Equity 4 4 5 3
Brand Equity Dimensions
Perceived quality 2 6 3 6 4 3
Brand loyalty 3 3 3 3 5
Brand associations with brand awareness 5 6
Brand awareness 3 5 3
Brand association 3 4
Perceived value 3
Brand personality 3
Organizational associations 3
Brand image 6
Brand attitude 3 5
Purchase Intention 2
Marketing Mix Price 3
Distribution intensity 3
Advertising spending 3
CFA provides a range of information to evaluate convergent validity – Maximum likelihood factor loading estimates and their associated t-values to be evaluated. Loadings should be atleast .5 and preferably .7, variance-extracted measures should equal or exceed 50% while .70 is considered the threshold for reliability of a construct (Hair, 2006).
B. Discriminant validity
Discriminant validity is the degree to which two conceptually similar concepts are distinct. The empirical test is again the correlation among measures, but this time the summated scale is correlated with a similar, but conceptually distinct measure. Now the correlation should be low, demonstrating the summated scale is sufficiently different from other similar concept (Hair, 2006). Discriminant validity is the extent to which a measure does not correlate with other constructs from which it is supposed to differ which involves demonstrating a lack of correlation among differing constructs (Malhotra, 2007). The conservative approach for establishing discriminant validity compares the variance-extracted estimates for each factor with the squared interconstruct correlations associated with that factor which should be greater implying that are no problems with discriminant validity (Hair, 2006).
C. Nomological validity
Nomological validity refers to the degree that the summated scale makes accurate predictions of other concepts in a theoretically based model. The researcher must identify theoretically supported relationships from prior research and then assess whether the scale has corresponding relationships. (Hair 2006). Nomological validity assesses the relationship between theoretical constructs where it seeks to confirm significant correlations between the constructs as predicted by theory. (Malhotra, 2007). The correlation matrix in EFA to analyze the extent to which the constructs are related to one another.
Unidimensionality
Unidimensionality implies that all the items in a scale are strongly associated with each other and represent a single concept. Factor analysis plays a pivotal role in making an empirical assessment of the dimensionality of a set of items by determining the number of factors and the loadings of each variable on the factor(s). The test of unidimensionality is that each summated scale should consist of items loading highly on a single factor. All cross loadings are hypothesized to be 0 when unidimensional constructs exist. Covariance among error terms of two measured variables should also be evaluated. Significant between-construct error covariances suggest that the two items associated with these error terms are more highly related to each other than the original measurement model predicted implying significant cross-loading exist. Unidimensionality can be assessed by exploratory factor analysis or confirmatory factor analysis (Hair, 2006)
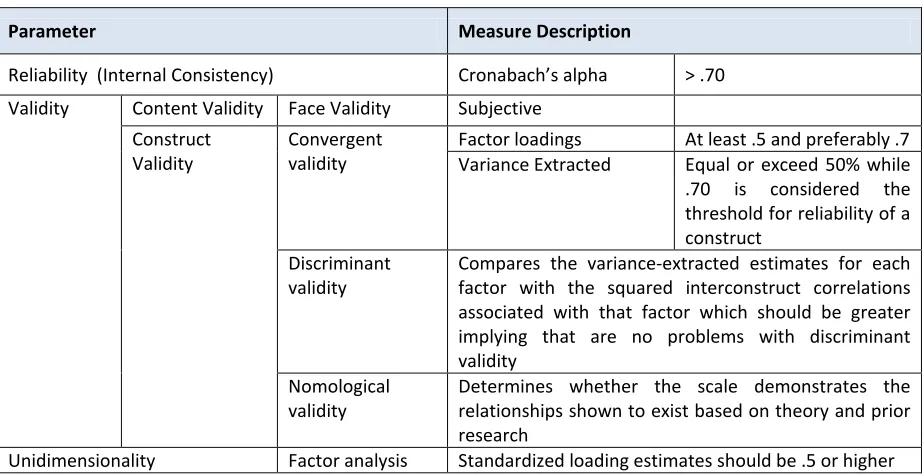
Factor analysis provides the researcher with an empirical assessment of the inter-relationships among variables, essential in forming the conceptual and empirical foundation of a summated scale assessment of content validity and scale dimensionality.
[image:6.612.32.494.495.733.2]Table II summarises the information.
Table II: Summary of Scales Tested Across Studies
Parameter Measure Description
Reliability (Internal Consistency) Cronabach’s alpha > .70
Validity Content Validity Face Validity Subjective
Construct
Validity Convergent validity Factor loadings Variance Extracted At least .5 and preferably .7 Equal or exceed 50% while .70 is considered the threshold for reliability of a construct
Discriminant
validity Compares the variance-extracted estimates for each factor with the squared interconstruct correlations associated with that factor which should be greater implying that are no problems with discriminant validity
Nomological
validity Determines whether the scale demonstrates the relationships shown to exist based on theory and prior research
III. METHODOLOGY
The methodology followed is summarized in the steps below: A. Finalizing the items for scale to measure each construct B. Questionnaire development and data collection
C. Consumer characteristics, sampling details and data collection D. Data analysis
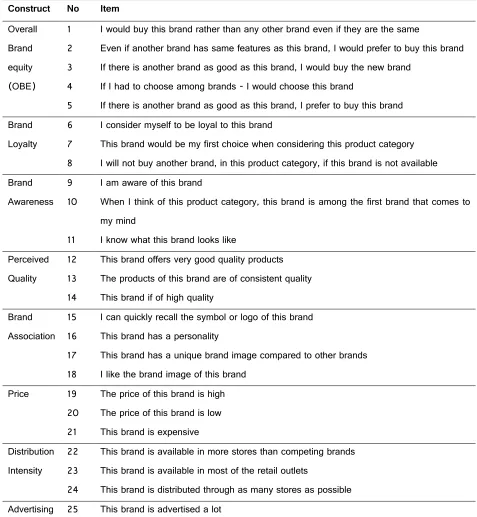
[image:7.612.67.544.213.730.2]A. Finalizing the items for scale to measure each construct Items were selected from previous studies.
Table III: Scale Items to measure constructs
Construct No Item
Overall Brand equity (OBE)
1 I would buy this brand rather than any other brand even if they are the same
2 Even if another brand has same features as this brand, I would prefer to buy this brand 3 If there is another brand as good as this brand, I would buy the new brand
4 If I had to choose among brands - I would choose this brand
5 If there is another brand as good as this brand, I prefer to buy this brand Brand
Loyalty
6 I consider myself to be loyal to this brand
7 This brand would be my first choice when considering this product category 8 I will not buy another brand, in this product category, if this brand is not available Brand
Awareness
9 I am aware of this brand
10 When I think of this product category, this brand is among the first brand that comes to my mind
11 I know what this brand looks like Perceived
Quality
12 This brand offers very good quality products 13 The products of this brand are of consistent quality 14 This brand if of high quality
Brand Association
15 I can quickly recall the symbol or logo of this brand 16 This brand has a personality
17 This brand has a unique brand image compared to other brands 18 I like the brand image of this brand
Price 19 The price of this brand is high 20 The price of this brand is low 21 This brand is expensive Distribution
Intensity
22 This brand is available in more stores than competing brands 23 This brand is available in most of the retail outlets
26 I like the advertisements for this brand
27 The ad campaigns for this brand are seen frequently Price
Promotion
28 Price offers/discounts are frequently offered on this brand 29 There are too many price offers/discounts on this brand 30 There are frequent price discounts on this brand
Non Price Promotions
31 Non-price promotions like premium or prize draws for are frequently offered on this brand
32 Many times non-price promotions like premium or prize draw for this brand are presented
33 Prizes such as trips, raffles, scratch cards and free gifts are frequently offered on this brand
B. Questionnaire development and data collection
Data was collected by the survey method using a questionnaire. A total of 10 constructs were to be measured. It is recommended that for each construct there should be atleast 3-4 items to measure (Hair 2006). To measure the 10 constructs a total of 33 items were identified. These items were taken from scales developed earlier in various studies.
The questionnaire itself had three parts. In section 1 – the consumer was asked to select a brand from a list of brands. This list had 15 brands. Strong and big brands (no1 or 2) in various food categories were selected across a range so as to appeal to the wider sampling target population. In section 2 the consumers had to answer questions on a 5 point Likert scale keeping the selected brand in mind. In section 3 personal data was collected.
C. Consumer characteristics, sampling details and data collection
The target sampling population was set as male or females in the age group of 18 to 60 living in Dubai and Sharjah and a member of the non-Arab expatriate community. The sample size was set at 400. This was decided on a couple of factors – one, was the rule of thumb approach of 10 responses per item giving a total number of 330. Secondly, it is recommended that the larger the sample the better it is for multivariate analysis. Finally it being convenience sampling it was decided to have a larger sample size.
Respondents were approached in key areas – residential areas, offices and colleges where they were handed the questionnaire, which was a self-filling questionnaire, for completion. Of the total 400 questionnaires sent out 318 were received back. Of the 381, 22 were rejected for reasons of being incomplete or having absurd data, leaving 359 questionnaires for analysis.
Sampling methodology followed was convenience based. Convenience sampling refers to selecting at your convenience those cases that are easiest to obtain and the selection process is continues until the required sample size has been reached and is recommended in cases where there is very little variation in the population (Saunders 2003). Sub-groups were approached in such a manner to cover the age gender and socio-economic levels. Key groups of the target population were identified in various locations such as offices, residential areas and colleges.
As the objective of the data collection was understand the marketing elements and how it drives brand equity within the FMCG food sector – a set of 15 brands were chosen in discussion with marketing professionals, market observations and discussions with consumers. The idea behind the brand is that with the brand in mind the respondents answers the questions. For brands to trigger answers they have to be strong and big brands in their categories. The criterion was that the brands should be no1 or 2 in their respective product category. The brands were selected within the Fast Moving Consumer Goods (FMCG) category focusing on food brands. As the target consumer is across age and socio-economic level the brands were also chosen in a manner that the each consumer sub-set can choose the most familiar brand. The 15 brands chosen as stimulus to generate the data were Lipton, Galaxy, Cadbury, Afia, London Dairy, Mountain Dew, Tang, Nescafe, Pepsi, Red Label, Vimto, Coca Cola, Lurpak, Kit Kat and Red Bull.
Confirmatory Factor Analysis using Structural Equation Modeling (SEM) software Lisrel will be used to analyze the data. Exploratory factors analysis, using SPSS, will be used to conduct factor analysis. Refer to Table II for specific parameters that will be analysed.
IV. RESULTS
Summary – Sample Characteristics:
As observed from the above analysis the total respondents of 359 within the non-Arab expatriate community is young, educated and has an average to above average household income. Both the genders are represented in almost equal measures at 53% male and 47% female. 91% of the respondents are below the age of 45 which is representative of the population, and is also indicative of the younger nature of the population.
Also, the brand selection was done across all the brands with sub-groups showing skews towards individual brands as per the brand objectives and consumer profiles.
In summary the sample is representative and very suitable for the brand study intended.
Reliability & Construct Validity
Cronbach’s Alpha was calculated for all the factors with 33 items, using SPSS 18. 1 item was dropped and 1 changed to improve the Cronbach’s Alpha of the scales. Construct Validity was analyzed using the factor loadings. Table 4 summarizes the findings.
[image:9.612.96.517.384.597.2]The constructs that produced the highest Cronbach’s Alpha were Non-Price Promotions (.85), Price Promotions (.82) and Brand Equity (.83). The other constructs above .7 were Price (.78), Advertising (.79) and Distribution was very near at .68. The rest of the constructs were less than .7 but over .6 – brand loyalty (.62), brand awareness (.62), perceived quality (.65) and brand associations (.61). These constructs were acceptable as they were close to the acceptable limit of .7.
Table IV:Scale Items to measure constructs
No Variable Item Description No of
Items
Cronbach’s Alpha (>.7)
VE (>.5)
CR
(>.7) Comment
1 Price 3 0.78 0.57 0.79 Acceptable
2 Distribution Intensity 3 0.68 0.45 0.71 Marginal
3 Advertising 3 0.79 0.56 0.79 Acceptable
4 Price Promotions 3 0.82 0.61 0.83 Acceptable
5 Non-Price Promotions 3 0.85 0.66 0.85 Acceptable
6 Brand Loyalty 3 0.62 0.37 0.63 Marginal
7 Brand Awareness 3 0.62 0.35 0.61 Marginal
8 Perceived Quality 3 0.65 0.40 0.66 Marginal
9 Brand Associations 4 0.61 0.91 0.62 Marginal
10 Overall Brand Equity 4 0.83 0.54 0.83 Acceptable
Unidimensionality
Factor analysis was run on SPSS. The factors were inline with the theoretical assumptions. Refer to table 5 for findings.
Table V: Factorisation
[image:9.612.74.535.678.736.2]Distribution Intensity
DI1 0.50
DI2 0.71
DI3 0.78
Advertising AD1 0.75
AD2 0.67
AD3 0.82
Price Promotions
PP1 0.79
PP2 0.75
PP3 0.81
Non-Price Promotions
NPP1 0.77
NPP2 0.81
NPP3 0.85
Brand Loyalty
LO1 0.71
LO2 0.64
OBE3 0.45
Brand Awareness
AW1 0.53
AW2 0.70
AW3 0.53
Perceived Quality
PQ1 0.50
PQ2 0.69
PQ3 0.68
Brand Associations
AS1 0.51
AS2 0.54
AS3 0.53
AS4 0.56
Overall Brand Equity
OBE1 0.70
OBE2 0.76
OBE4 0.75
OBE5 0.74
V. DISCUSSION
weaknesses of their brands and allocate effort and resources accordingly. Some of the scales can be made more robust by increasing the number of items or changing the scale item description.
REFERENCES [1] Aaker, D.A., 1991. Managing Brand Equity. New York, NY: The Free Press
[2] Aaker, David. A. 1996. Measuring brand equity across products and markets, California Management Review, Vol. 38 No. 3, pp. 102-20.
[3] Atilgan Eda, Safak Aksoy, Serkan Akinci. 2005. Determinants of the brand equity: A verification approach in the beverage industry in Turkey. Marketing Intelligence & Planning. 23, 2/3; ABI/INFORM Global pg. 237
[4] Buil, Isabel.,Chernatomy, Leslie de., Martinez, Eva., 2008. A cross-national validation of the consumer-based brand equity scale. Journal of Product & Brand Management, 17/6, pages 384-392
[5] Chattopadhyay, Tanmay. Shivani, Shradha. Krishnan, Mahesh. 2009. Determinants of brand equity – A blue print for building strong brand: A study of automobile segment in India. African Journal of Marketing Management, vol. 1(4). Pages 109-121
[6] Hair, J.F., Black, W.C., Babin, B.J., Anderson, R.E., Tatham, R.L., 2006. Multivariate Data Analysis. New Delhi, India: Pearson Prentice Hall [7] Kapferer, Jean-Noel, 1992. Strategic Brand Management, Kogan Page, London
[8] Keller, Kevin L., 1993. Conceptualizing, Measuring, Managing Customer-Based Brand Equity. Journal of Marketing. Jan93, Vol. 57 Issue 1, p1-22, 22p [9] Kelloway, E. K., 1998. Using Lisrel for Structural Equation Modeling. Thousand Oaks, CA: Sage
[10] Kocak, A. Abimbola, T. and Ozer, A. 2007. Consumer Brand Equity in a Cross-cultural Replication: An Evaluation of a Scale. Journal of Marketing Management.Vol 23. No. 1-2. pp.157-173.
[11] Lassar, Walfried. Mittal, Banwari. Sharma, Arun. 1995. Measuring customer-based brand equity. The Journal of Consumer Marketing. 12, 4; ABI/INFORM Global
[12] Malhotra, N.K., 2007. Marketing Research – An Applied Orientation. 5thed. New Delhi, India: Pearson Prentice Hall
[13] Pappu, R, Quester, P, and Cooksey, RW. 2005. Consumer-based brand equity: improving the measurement – empirical evidence. Journal of Product & Brand Management. 14/3, 143–154
[14] Rajh, Edo., 2005. The effects of marketing mix elements on brand equity. Economic Trends and Economic Policy. No. 102, 2005, pp. 30-59.
[15] Tong, X., Hawley, J.M. 2009. Measuring customer-based brand equity: Empirical evidence from the sportswear market in China. Journal of Product & Brand Management. 18(4). Pages 262-271
[16] Washburn, Judith H., Plank, Richard E. 2002. Measuring Brand Equity: An Evaluation of a Consumer-Based Brand Equity Scale. Journal of Marketing Theory and Practice, Winter 2002, pages 46-62
[17] Yoo, B. and Donthu, N. 2002. Testing cross-cultural invariance of the brand equity creation process. Journal of Product & Brand Management, Vol. 11 No. 6, pp. 380-98.
[18] Yoo, B., Donthu, N. and Lee, S., 2000. An examination of selected marketing mix elements and brand equity. Journal of the Academy of Marketing Science, Vol. 28 No. 2, pp. 195-211.
[19] Yoo, B. and Donthu, N. 2001, Developing and validating a multidimensional consumer-based brand equity scale. Journal of Business Research, Vol. 52, pp. 1-14.
AUTHORS
First Author – Mohammad Shariq, B.Pharm. MBA, Ph.D., Visiting Faculty-Marketing – Delhi-NCR, [email protected]