A NEW METHOD FOR SELECTING INTERESTING ASSOCIATION
RULES USING GENETIC ALGORITHM WITH
MULTIPLE CRITERIA
Azzeddine Dahbi, Youssef Balouki and Taoufiq Gadi
Faculty of Science and Technology, Hassan 1st University Settat, Laboratory Informatics, Imaging and Modelling of Complex Systems, Morocco
E-Mail: [email protected]
ABSTRACT
Association rules mining is an important topic in the domain of data mining and knowledge discovering, aiming to discover the interesting relation between variables in large datasets. One of the main problems related to the discovery of these associations (that a decision maker faces) is the huge number of association rules extracted. Hence in order to bypass this problem many interestingness measures have been proposed to evaluate the association rules. However, the abundance of these measures caused a new issue, which is the selection of measures that is best suited to the users and the heterogeneity of the evaluation results. To bypass this problem we propose an approach based on genetic algorithm and multi-criteria which permits to discover the interesting association rules without favoring or excluding any measures. The experiments performed on benchmark datasets show a wonderful performance of the proposed approach.
Keyword:data mining, association rules, interestingness measures, multi-criteria decision analysis, genetic algorithm.
1. INTRODUCTION
Data mining is an important research domain whose the main objectives are the knowledge discovery in databases and the extraction of interesting information from large datasets. One of the most important research topics in Data mining and knowledge discovery is to discover association rules and to find interesting relation or correlation among items in large transactional databases. It is firstly proposed by R. Agrawal [1] in 1993.An association rule is an implication expression formed as:
X
Y
, where A and B are disjoint itemsets .The interestingness of an association rule can be measured in terms of its support and confidence.The support of the rule
X
Y
is the percentage of transactions in the database D that include both X and Yitemsets. The confidence of a ruleX
Y
is the percentage of transaction in the database containing itemset X which also contain the itemset Y. In order to extract the interesting association rules, the support and the confidence of the rule should satisfy a user specified support threshold called minsup and a confidence threshold called minconf.The main obstacle of association rule mining process is that it yields a very large number of rules, making it hard for the user to identify the interesting ones. To bypass this problem many measures have been proposed in literature to determine the interestingness of the rule.
The interestingness measure is classified into two types [2] subjective measures and objective measures. The subjective measures rely on the goals, the knowledge, and the belief of the user. The objective measures are statistical indexes.
Nevertheless, with the large number of interestingness measures existing in the literature, how to select the suitable measures becomes a major challenge. To bypass this problem several approaches and techniques
were presented by describing many key properties one should examine in order to select the right measure for a given application domain [3] or by studying the similarity between the measures for clustering of similar stocks [4]. Vaillant et al. [5] proposes to extract a pre-order on twenty measures and identify the clusters of measures. On the other hand, our previous work classifies the Association Rules into clusters with a set of measures using a method based on k-means [6]. Other works [7] [8] propose an approach based on multi-criteria optimization “ELECTRE method” aiming to select the most interesting association rules and find a good compromise without excluding any measures.
In the same context and to perform the last said approach, our paper couples the notion of dominance or Pareto dominance and the benefit of genetic algorithm to select the most interesting association rules which evaluated with a set of interestingness measures.
The paper is structured as follows. In Section 2, we present the necessary scientific background and an overview of related works. Sections 3 describe the multi-objective optimization and the genetic algorithm. The Section 4 presents our approach based on notion of dominance and the benefit of genetic algorithm. The section 4 is dedicated to experiment study, which gives credibility to our approach. And the last section concludes our work and presents the future perspective.
2. THE ASSOCIATION RULE MINING PROCESS
2.1. Association rules
(frequent/closed/maximal) itemsets. An association rule is an implication expression of the form
,
,
X
Y X
I Y
I
where X and Y disjoint itemsetsX
Y
.X is called the antecedent and Y is called the consequent of the rule. The force of an association rule can be measured in terms of its support and confidence. The support of the ruleX
Y
is the percentage of transactions in database D that contain X∪Y and is represented as:( )
( ) ( , ) n X Y
Support X Y P X Y
n
The confidence of a rule X Y describes the percentage of transactions containing X which also contain Y and is represented as:
( , ) ( )
( )
( ) ( )
P X Y n X Y
Confidence X Y
P X n X
Where
n X
Y
is the number of transactions thatcontain items (i.e.
X
Y
) of the rule,n X
is the number of transactions containing itemset X and n is the total number of transactions.The process of mining association rules is to discover all association rules from the transactional database D that have support and confidence greater than threshold predefined by the user minsup and minconf.
Now, diverse algorithms for mining association rules are proposed. The most known, and without certainly the simplest one is the Apriori algorithm.
2.1. Interestingness measures
The trivial problem in mining association rules is that a large number of rules can be generated from a database, making it impossible for a human analyst to digest the result (to take a decision). To bypass this problem we use the interestingness measures to identify interesting rules.
Various interestingness measures have been proposed to check, the quality of obtained association rules in order to select a small set of the most interesting among them. Such interestingness measures are detached into objective measure-those that depend on the structure of a pattern (data-driven) and give the interestingness in terms of statistics or information theory, and the subjective measure e.g. (unexpectedness and actionability) (user driven) -those are based on comparing discovered rules with the previous knowledge or beliefs of the user or expectation of their particular problem domain.
Diverse objective measures used to select interesting rules but the most commonly are the Support and confidence. There are many other objective measures introduced by Tan et al. [3], such as cosine, Laplace, odds ratio, φ-coefficient, mutual information, Giniindex, conviction, interest and J-measure, kappa. Their research
shows that diverse measures have different basic properties and there is no measure that is better than others in all application, domains are
Liu et al. [9] examines the discovered association rules using the user's existing knowledge about the field and specifications to identify those potentially interesting ones for the user, and those really interesting ones. Then, the learned rules are ranked according to multiple interestingness criteria subjective.
Rezende et al. [10] offers a new strategy for joining data-driven (objective) and user-driven (subjective) evaluation measures to identify interesting rules. Their methodology is that, the objective measures are first used to filter the rule set and then subjective measures are used to help the user in examining the rules according to his intentions and knowledge. The combined use of objective and subjective measures exploits the advantages of each type, updating the description of interesting knowledge.
Razan Paul [11] utilizes a semantic interestingness measures for identifying association rules. Semantic interestingness measures bear in mind how data attributes are semantically associated. It makes use of the structure of the ontology that treats the corresponding items (e.g. generalization, specialization, etc.)
Interestingness measures represent a crucial function by decreasing the number of discovered rules and keeping only those with the best utility in a post-processing step. Various rule interestingness measures have several qualities or defects. There is no optimal measure and there is no measure that is better than others, and the way to resolve this challenge is to try to find a good compromise.
There exists no completely adequate best measure to estimate the interestingness of a pattern for any given application or database. Researchers are making efforts to propose a valid measure depending on the user and/or application requirements.
Table-1. Some interestingness measures.
Measures Formula
Lift
P XYLift X Y
P X P Y
Information
Gain
2
P XY GI X Y log
P X P Y
Example & Counter Example Rate
1 2 X Y X Y ECR conf Jaccard
P XY JRD X Y
P XY P Y
Cosinus
P XY COS X Y
P X P Y
Pearl PRLXYP X P Y/XP Y
Loevinger
1
Y
P P Y
X LVG X Y
P Y
Conviction
( )
P X P Y CNV
P XY
Zhang
Piatetsky
Shapiro PS
XY
P XY
P X
P Y( )
Sebag-Schoenauer
( )
P XY SBG X Y
P X Y
Interestingness measures are applied to define the most interesting rules, and they are intended for choosing and ordering patterns according to their potential benefit to the user.
3. THE MULTI-OBJECTIVE OPTIMIZATION AND GENETIC ALGORITHM
Multi-objective optimization includes optimizing more than objective function together; such states are expressed as multi-objective optimization problems, also identified as vector optimizations or multi-criteria problem. Multi-objective optimization problems occur in different scientific employment, such as engineering, manufacturing, logistics and economics, when optimal decisions want to be taken in the presence of compromise between two or more different objectives. And various experts have directed on improving methods to solve them.
3.1. Pareto dominance
In a generic decision-making context, a decision Pareto dominates another if it is strictly favored in at least one aspect of the decision and at least as good as the other in all other aspects [12]
The notion of Pareto optimality started in social welfare and economic theory, and the Pareto dominance relation is usually related in that area and many other related decision areas, such as collective decision and voting theory, decision making under uncertainty, and multi-criteria decision making and optimization. The Pareto dominance relation leads to a huge number of undominated (also called ‘Pareto optimal’) solutions because many connections between pairs of decisions do not result in dominance.
Let (P) be an optimization problem in the presence of multiple criteria that may be conflicting. The criteria to be optimized are explicit functions of decision variables,
Let 𝑝 be the number of criteria, 𝑥 the vector of
decision variables and
Z
k(.)
, the k-th criterion, with: k
Z X Rfork1, 2, 3... .p
Z
(.)
: The vector ofobjective functions, called vector criterion.
X
: The solution space that describe possible solutions.Z
: The space of criteria vectors.I
: The index set of criteria that isto say, I {1, 2, 3... }p
K
I
a set of indices of k criteriak
I
I
.We use the notation Z x( )Z y( )as an
abbreviation for
Z x
k( )
Z y
k( )
for allkI . Themulti-criteria optimization problem is formulated by:
( )P : MaximizeZ x( )( ( ),Z x Z x1 2( ), ...,Z xp( )) for
all
x
X
Let two criteria vectorsZ
1,Z
2we say thatZ
1 dominatesZ
2if and only if Z1Z2andZ1 Z2(I.e.1 2
k k
Z
Z
for allk
I
, andZ
1k
Z
k2, for at least one k) A solutionx is an effective solution of( )
P
if there is nox
X
asZ x
( )
dominatesZ x
( )
The term efficiency is also known as Pareto optimality.3.2. Genetic algorithm
Genetic Algorithms (GA) were introduced by Prof. John Holland and his students at the University of Michigan in the 1970s. Fundamentally, they are a method of "breeding" computer programs and results to optimization or research problems using invented evolution. When using a genetic algorithm, the user needs a solution to the problem as a chromosome (or genome). The genetic algorithm then produces a population of solutions and practices genetic operators such as mutation and crossover to develop the solutions to find the best one(s).
Genetic algorithms strive to obtain a good (or best) solution to problems by genetically producing a population of individuals over a set of generations. In a genetic algorithm, each individual in the population describes a candidate solution to the presented problem. The genetic algorithm changes a population (set) of individuals, each with a related fitness value, into a new generation of the population using reproduction, mutation, and crossover.
The algorithm is started with a set of solutions called population. Solutions from one population are chosen and used to create a new population. This is motivated by desire, that the new population will be useful than the old one. Solutions, which are chosen to form new solutions (offspring), are selected according to their fitness - the more proper they are the more opportunities they have to reproduce.
In addition to the fact that more than one objective is born in mind, the principal distinction between the single-objective GA and the multi-objective GA is the selection stage. In the multi-objective case, the notion of dominance is directly or indirectly included in that step.
4. OUR APPROACH
In this work, we use genetic algorithm and Pareto dominance for choosing the most interesting association rules which evaluated with a set of interestingness measures and not one, in this section we will discuss: dominance of rules, the representation of rules (encoding), and genetic operators as given below:
4.1. Dominance of rules
Let two association rulesR1,R2we say that an
association ruleR1dominates another association ruleR2if
only ifR1is more relevant thanR2for all measurements and
it is denoted asR1 R2.
We eliminate a ruleRof the end result, not because it is not interesting for one measure but because it is not relevant in a combination of a set of measures.
Table-2. Example of dominance.
Rules/Measures M1 M2 M3 M4
R1 0.9 0.8 0.8 0.6
R2 0.8 0.7 0.3 0 .4
R3 0.8 0.9 0.4 0.8
R4 0.3 0.3 0.1 0.3
R5 0.5 0.5 0.8 0.8
R6 0.4 0.4 0.5 0.7
1
2
4
R
R
R
If the ruleR1dominatesR2, thenR1is equivalent
or better thanR2for all the selected measures. The rules
dominated by other (at least) are not relevant and are eliminated, and they remain as the set of rules that are not dominated by any other, following all the measures M.
4.2. Genetic operators and representation of rule To apply GA, initially an accepted encoding needs to be chosen to represent candidate solution to the given problem. Representation of rules plays a significant role in GAs; mainly there are two approaches of how rules are encoded in the population of individuals. One such technique is Michigan approach [14], in which each rule is encoded into an individual. Second technique is referred to as Pittsburg approach [14], where a set of rules are encoded into an individual. In this paper, we opted as Pittsburg ‟s approach i.e. each individual is encoded into a set of rules. The structure of an individual is made up of genes and is represented as:
R1 R2 R3 R4 R5 R6 R7 R8 R9 R10
In our case, the algorithm is divided on the following stages:
Determine the population, which we want to analyze: it is the space criteria vectors. i.e. The set of association rules with corresponding measures.
Initialization
Generation of the initial population is necessary because this generation is the starting point of the algorithm and its choice influences the speed and the optimality of the final solution, we select N individuals representing the initial population.
Figure-1. Coding and initialization step of genetic algorithm.
Crossover step:
Figure-2. Crossover example.
At the end of the crossing, we get the same number of segment in the initialization step then Applying the selection by the dominance of Pareto to the new set after the crossover.
Mutation step: With a probabilities p-mutation we choose a set of rules and we apply mutation operator (Adding a specific number of rules in the old set), then we apply the selection by the dominance of Pareto to the new set after the mutation. This is repeated until the number of rules in the main set is less than a specific number of additions.
Evaluation and Selection: assessing each individual by the objective functions for the rules to be dominant in each set using R* calculated before, and defining the individuals of P generation that will be duplicated in the new population. In every generation, there are two selection operators: the selection of reproduction or simply selection, which determines individuals, will breed for a generation and selection for replacement or simply replacing that determines which individuals will disappear from the population.
Based on that, in this present work, many significant measures of the rules cited in the previous section are considered, such that, Support (SUP), Confidence (CONF), Lift, Information Gain (IG), Example &Counter Example Rate(ECR), Piatetsky Shapiro (PS), Cosinus (COS) and Jacard (JRD). Applying these measures, some previously unknown, clearly right and compact rules can be generated. So, Association Rule Mining problems can be considered of as a Multi-objective problem. Then we apply the dominance of Pareto to obtain the Pareto optimal or undominated rules.
We propose to seek ideal point; it is the point in objective space at which each objective in a multi-objective optimization problem takes its optimal value when optimized individually. It provides a useful point of reference to measure the goodness of any solution against. In our problem it is a fictitious association rule
R
I which dominates all the rules. This answers the problem of comparing all the rules together.For example the
R
Irule which dominates all other rules in the example above is:0.9, 0.9, 0.8, 0.8
I
R
. This rule remains a fictitious rule and it may not exist in the solution space that is why we seek to the nearest rule of this rule, which exists in the space of solution and namedR
*.After mining association rules from a transactional database D, let’s
R
{ 1, 2,....
R R
Rn
}
be a set of association rules generated by Apriori and
1, 2, ..
S
M m m m a set of measures to evaluate the rules.
We denote by
R m
[ ]
j the value of the measure j for the ruleR. We set a set of measures as attributes and the set of rules as objects. Given two rulesR1,R2
R, the degree ofsimilarity betweenR1andR2with respect to M is defined as follows:
1 2
1
1 2
deg ( , ) | |
S
j j j
R m R m
sim R R with S M
S
After the rule
R
*is determined all the rules dominated by it are removed.4.3. Algorithmic structure
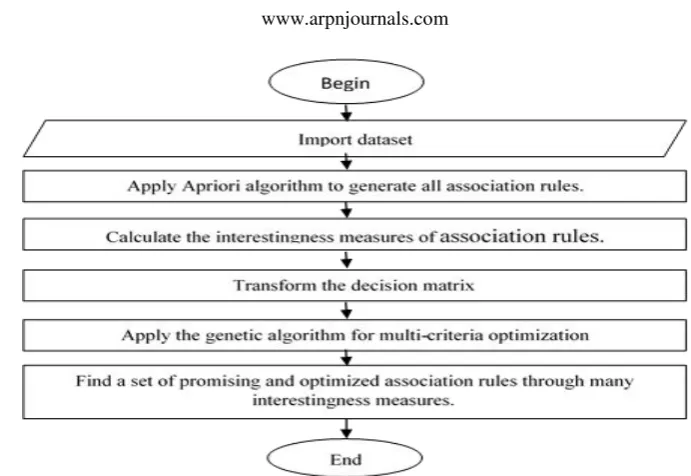
In this section, we are presenting the structure of the proposed algorithm. Firstly, we import a transactional dataset. Then, we apply Apriori algorithm to find the frequent itemsets and generate all association rules. The next step is to calculate the interestingness measures to evaluate the set of rules, and finally, The GA is applied with the dominance of Pareto to obtain the Pareto optimal undominated rules using a set of multi-criteria.
The procedure of the proposed algorithm for generating optimized association rules through many interestingness measures using GA and dominance of Pareto is as follows:
a) Star.
b) Import a dataset.
c) Apply Apriori Algorithm to find the frequent itemsets, and generate all association rules.
d) Compute measure value: calculate the interestingness measures of association rules.
e) Apply the genetic algorithm for multi-criteria optimization to find the optimized association rules through many interestingness measures.
f) Stop.
Figure-3. The flow chart of the proposed algorithm.
5. EXPERIMENT STUDY
In this section, we will investigate and illustrate the benefits of the proposed approach. We examine our approach combining the genetic algorithm and multi-criteria optimization Pareto by generating firstly the association rules using APRIORI[1] from a set of well-known dataset got from UCI Machine Learning Repository a (mushroom, flare1, flare2, monks1, monks2, monks3, Zoo). Table-3 summarizes the characteristics of the used datasets.
Table-4 shows the minimum support taken for each dataset chosen and the number of rules extracted from the different datasets using Apriori algorithm.
As explained in the previous section, to evaluate association rules, we use a set of interestingness measures. The measures used for the performed test are: Support (SUP), Confidence(CONF), Lift, Information Gain (IG), Example & Counter Example Rate(ECR), Piatetsky Shapiro (PS), Cosinus (COS) and Jacard (JRD). These measures are calculated using the formulas cited in Table-1.
Accordingly, we examined our method 10 times over each dataset and then the average values of such executions are presented. The population size is set to 100, the crossover probability to 0.8 and the mutation probability to 0.1.
We provide the results of the experimental evaluation, which its objectives are multiple. First, we show through experiments that our approach can significantly reduce the huge number of rules generated from the data sets. To validate our approach we compare it with another approach of ELECTRE.
These experiments have the advantage to quantify the reduction of the rules introduced by our approach. Therefore, we compare the number of non-dominated rules of our approach to the number of non-dominated rules of ELECTRE and the total number of association rules (denoted A-R).
For all measurements, Table-5 compares the size of non-dominated rules of our approach with the rules of ELECTRE and with all the association rules. Also giving the corresponding histograms Figure-4 to illustrate the results. The goal is to illustrate the problem of a large number of association rules; even the algorithm based on a threshold makes it difficult to find only the interesting rules. In contrast, the number of non-dominated rules of our approach is always small which can facilitate the interpretation and to see the most interesting ones.
Table 3. Characteristics of the used datasets.
Data set items transactions
Mushroom 22 8124
Flare1 32 323
Flare2 32 1066
Monks1 19 432
Monks2 19 432
Monks3 19 432
[image:6.595.309.546.640.779.2]Zoo 28 101
Table-4. Number of AR generated for each dataset.
Data set Minsup Number of rules generated
Mushroom 40 2654
Flare1 20 3468
Flare2 20 3342
Zoo 20 3564
Monks1 5 2422
Monks2 5 2516
Table-5. The obtained results for different datasets.
Mushroom flare1 flare2 Monks1 Monks2 Monks3 Zoo
A.R 2654 3468 3342 2422 2516 2554 3564
ELECTRE 318 90 77 1253 1072 332 1722
Our approach 314 18 71 13 99 26 489
In order to analyze the performance of our proposed algorithm, we have compared the average value of confidence and the average value of support in each dataset of our method to the ELECTRE method and to the closed algorithm.
The Table-6 and Table-7 show that the proposed method has found rules with high values of confidence and of support in the majority of the datasets.
Figure-4. The correspondent histogram of the results.
Table-6. The average of confidence for different datasets.
Mushroom flare1 flare2 Monks1 Monks2 Monks3 Zoo
A.R 0.74 0.61 0.65 0.32 0.31 0.33 0.77 ELECTRE 0.92 0.6 0.84 0..313 0.294 0.42 0.84
Our approach 0.97 0.87 0.89 0.58 0.48 0.7 0.89
Table-7. The average of support for different datasets.
Mushroom flare1 flare2 Monks1 Monks2 Monks3 Zoo
A.R 0.47 0.27 0.31 0.07 0.07 0.07 0.26 ELECTRE 0.528 0.216 0.35 0.062 0.064 0.071 0.263
Our approach 0.55 0.2 0.24 0.1 0.15 0.16 0.29
Figure-5. The histogram of the average of confidence and support.
0 500 1000 1500 2000
Mushroom flare1 flare2 Monks1 Monks2 Monks3 Zoo
ELECTRE ourapproch
0 0.1 0.2 0.3 0.4 0.5
0.6 Av sup
ELECTRE ourapproch
0 0.2 0.4 0.6 0.8 1
1.2 Av conf
6. CONCLUSIONS
In this paper, we proposed an approach used Multi-objective feature of GA for discovering the interesting association rules. The main advantage of the proposed method is that it is not hindered by the abundance of measures and it evaluates the association rules using a set of criteria not only one. When proposed algorithm is applied to different datasets, we get results containing desired rules with maximum interestingness. The numbers of rules generated by proposed algorithm are significantly less as compared to ELECTRE Algorithm. Hence, we can say our algorithm optimize the association rule efficiently and effectively. As future works, we plan to ameliorate our approach to be able to rank the association rules.
REFERENCES
[1] R. Agrawal and R. Srikant. 1994. Fast algorithms for mining association rules. Proceeding VLDB ’94 Proc. 20th Int. Conf. Very Large Data Bases. 1215: 487-499.
[2] A. Silberschatz and A. 1996. Tuzhilin. What Makes Pattens Interesting in Knowledge Discovery Systems. IEEE Trans. Knowl. Data Eng. 8(6): 970-974.
[3] P.-N. Tan, V. Kumar and J. Srivastava. 2002. Selecting the Right Interestingness Measure for Association Patterns. Proc. eighth ACM SIGKDD Int. Conf. Knowl. Discov. Data Min. - KDD ’02. 2: 32-41.
[4] M. Gavrilov, D. Anguelov, P. Indyk and R. Motwani. 2000. Mining the Stock Market: Which Measure Is Best ? AcmSigkdd. pp. 487-496.
[5] B. Vaillant P., Lenca and S. Lallich. 2004. A clustering of interestingness measures. Discov. Sci. Proc. 3245: 290-297.
[6] A. Dahbi, M. Mouhir, Y. Balouki, T. Gadi. 2016. Classification of association rules based on K-means algorithm, in: 2016 4th IEEE International Colloquium on Information Science and Technology (CiSt), IEEE. pp. 300-305. doi:10.1109/CIST.2016.7805061.
[7] D. H. Choi, B. S. Ahn, S. H. Kim. 2005. Prioritization of association rules in data mining: Multiple criteria decision approach. Expert Systems with Applications. 29(4): 867-878.
[8] A. Dahbi, S. Jabri, Y. Balouki, T. Gadi. 2016. International conference on computing, wireless and communication systems.
[9] B. Liu, W. Hsu, S. Chen and Y. Ma. 2000. Analyzing the subjective interestigness of association rules. IEEE Intell. Syst. 15(5): 47-55.
[10]S. O. Rezende, E. A. Melanda, M. L. Fujimoto, R. A. Sinoara and V. O. de Carvalho. 2009. Combining data-driven and user-data-driven evaluation measures to identify interesting rules. pp. 38-55.
[11]R. Paul, T. Groza, J. Hunter and A. Zankl. 2014. Semantic interestingness measures for discovering association rules in the skeletal dysplasia domain. J. Biomed. Semantics. 5(1): 8.
[12]O’mahony C. & Wilson N. 2013. Sorted-Pareto Dominance and Qualitative Notions of Optimality. In: GAAG, L. (ed.) Symbolic and Quantitative Approaches to Reasoning with Uncertainty. Utrecht, the Netherlands, 7-10 July. Berlin Heidelberg: Springer. pp 449-460.
[13]Davis L. (Ed.). 1991. Handbook of genetic algorithm. New York: Van Nostrand Reinhold.