Age Classification based on Corner Pixel Grey Level
Co-Occurrences Matrix (CP-GLCM) of TN-LBP
Pullela S V V S R Kumar
Research Scholar, AcharyaNagarjuna University, Associate Professor, V.S. Lakshmi Engineering College
for Women, Matlapalem, Kakinada- 533461, India
J V R Murthy,
Ph.DProfessor of CSE, University College of Engineering,
Jawaharlal Nehru Technological University Kakinada, Kakinada- 533003,
India
V V Sahiti Srinidhi
B.Tech. III Year I Semester CSE, SRM University, ChennaiABSTRACT
The present paper proposes a novel scheme based on third order neighbourhood LBP (TN-LBP). The present paper observed and noted that the TN-LBP forms two types of corner pixels i.e. top corner and bottom corner pixels. The present paper derived Grey Level Co-occurrence Matrix (GLCM) based on LBP values of Top Corner Pixels (TCP) of TN-LBP and Bottom Corner Pixels (BCP) of TN-LBP. On this GLCM features are derived. Based on these features human age is classified in to child (0 to 12 years) young adult (13 to 30 years), middle age (31 to 50 years) and senior age (above 60 years).
General Terms
Classification, Image Processing et. al.
Keywords
Age Classification, Local Binary Pattern (LBP). Third Order Neighborhood, Corner Pixel Grey Level Co-occurrence Matrix (CP-GLCM)
1.
INTRODUCTION
A human face comprises of lot of information, and they can used in various applications like face recognition [3], age group classification [2]. Lot of research is undergoing in the area of human facial image processing and it is still active and interesting. The other research areas include predicting feature faces [4], reconstructing faces from some prescribed features [5], classifying gender, races, and expressions from facial images [6], and so on. On age group classification/estimation much less work has been done, but several applications such as enforcement of law in usage of certain types of drug and entertainment scenarios, targeted advertisements etc require require age group classification/estimation. Several applications are under development in the area of human communication to achieve automatic identification of individuals using computers.
Wen-Bing Horng, Cheng-Ping Lee and Chun-Wen Chen et.al [2] considered four age groups for classification, including babies, young adults, middle-aged adults, and old adults. This is implemented based on the symmetry of human faces and the variation of gray levels, the positions of eyes, noses, and mouths are located by applying the Sobel edge operator and region labeling in the above methods. Kwon et. al. [7] implemented age classification on facial images is based on cranio-facial development theory and skin wrinkle analysis in which only three age-groups babies, young adults, and senior adults.
Various age group classification method are implemented to classify facial images into various age groups i.e. babies and adults [8], two age groups 20-39 and 40-49 [9]. In addition to this classification of facial images based on sex [9, 10] are also implemented. Sasikiran et.al. [11] implemented age classification by reducing the image dimensionality and classified the human age into five categories. The above method is extended based on the topological texture features of the facial skin for an effective age classification that classified the human age into five groups [12]. Various age classification methods based on LBP are also proposed [14, 15] and a pattern based dimensionality reduction model for age classification is also proposed recently and classified age groups effectively into four groups [13].. The present paper attempted to classify the age groups into four categories based on Corner Pixel Grey Level Co-occurrence Matrix (CP-GLCM) features extracted on TN-LBP on the facial image.
2.
DERIVATION OF CORNER PIXEL
GREY LEVEL CO-OCCURRENCES
MATRIX (CP-GLCM) OF TN-LBP
The proposed method evaluated GLCM features on TCP (Top Corner pixels) and BCP (Bottom Corner Pixels) of TN-LBP. The proposed method based T-TN-LBP consists of 9 steps as described below.
Step 1: Take facial image as Input Image (Img).
Step 2: Convert the RGB image into Grey scale Image by using HSV color model.
Step 3: Crop the grey scale image.
Step 4: The present research evaluated TN-LBP on each 5 x 5 sub image. The TN contains only 13 pixels of 25 pixels of 5x5 neighborhoods as shown in Fig.1. The TN-LBP grey level sub image is converted into binary sub image by comparing the each pixel of TN grey level sub image with the mean value of TN grey sub image. The following Eqn.1 is used for grey level to binary conversion.
TN-Pi=
0 if Pi< V0
Fig. 1: Third Order Neighborhood for a central pixel.
Step 5: The interesting thing in TN-LBP is it will have two corner pixel patterns. The present research named them as TCP and BCP. Both TCP and BCP will have four pixels only. TCP of LBP is indicated by green color and BCP of TN-LBP are indicated by sky blue color in the Fig.2. The Pixels P1, P5, P13 and P9 form TCP of TN-LBP and the pixels P3, P6, P8 and P11 forms BCP of TN-LBP.
P1
P2 P3 P4
P5 P6 P7 P8 P9
P10 P11 P12
P13
Fig. 2: Considered diamond patterns.
Step 6: LBP code is evaluated on the TCP and BCP of TN-LBP. To achieve rotational invariance the minimum code is taken. The LBP code ranges from 0 to 15.
Step 7: The Corner Pixel Grey Level Co-occurrence Matrix (CP-GLCM) of TN-LBP is generated by representing the TCP- pattern values on X- axis and BCP-pattern values on Y-axis. This method has the elements of relative frequencies in both patterns, since the LBP code values of these patterns i.e. TCP and BCP ranges from 0 to 15. That is the reason the CP-GLCM of TN-LBP have a fixed size of 16×16 because of number of distinct values in this method is 16.
Step 8: Extract the contrast, correlation, homogeneity and energy features on CP-GLCM of TN-LBP.
Energy = −ln(Pij)2 (2) N−1
i,j=0
Contrast = Pij N−1
i,j=0
i − j 2 (3)
Homogenity = Pij
1+ i−j 2 (4)
N−1 i,j=0
Correlation = Pij N−1
i,j=0
i −μ (j −μ)
σ2 (5)
Step 9: Based on four feature values facial image is classified as one of the category (Child Age(0-12), Young Age(13-30), Middle Age(31-50) and Senior Age (51 -70).
3.
RESULTS AND DISCUSSIONS
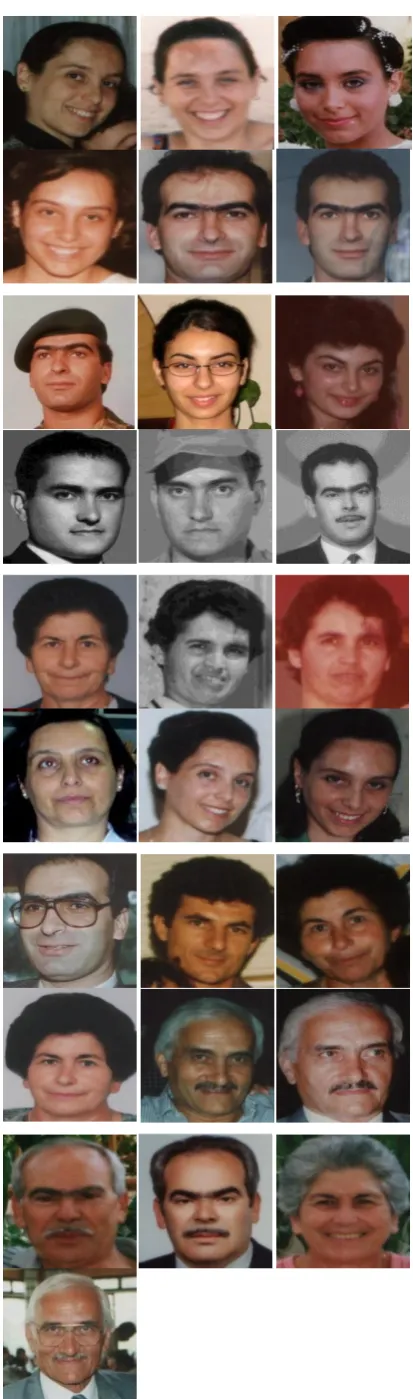
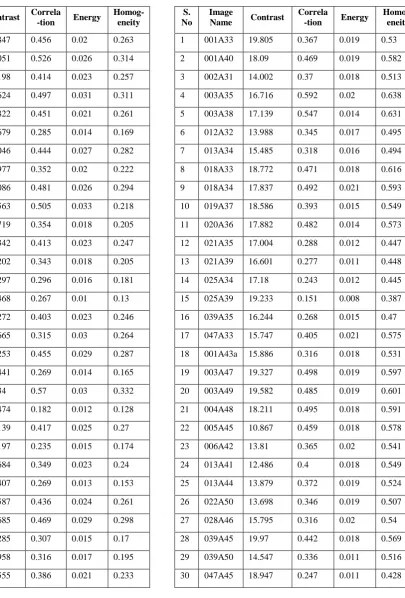
In implementing this a database is established by collecting 1002 facial images from FG-NET database, 500 images from Google database and other 600 images from the scanned photograph which results in a total of 2102 sample facial images. In the proposed method the sample images are grouped into four age groups of Child age(0-12), Young Age(13-30), Middle Age(31-50) and Senior Age (51 -70). A few of them are shown in Fig.3. The statistical features are extracted from CP-GLCM of TN-LBP for different facial images and the results are stored in the feature database. Feature set leads to representation of the training set. The statistical features of four age groups of facial images are shown in tables 1, 2, 3, and 4 respectively. Based on the derived features on CP-GLCM of TN-LBP an algorithm is derived by the present research to classify the facial image into one of the category of Child age(0-12), Young Age(13-30), Middle Age(31-50) and Senior Age (51 -70).
[image:2.595.57.275.554.680.2]
Figure 3: FGNET aging database: 011A07, 011A05, 010A10, 010A09, 010A07b, 001A14, 019A07, 009A14,
009A13, 009A11, 008A16, 008A13, 010A05, 010A04, 010A01, 009A09, 009A05, 004A21, 002A29, 002A26, 002A23, 002A21, 001A29, 001A28, 001A22, 009A22a,
[image:3.595.312.551.192.591.2]008A21, 004A28, 004A26, 006A36, 005A40, 011A40, 001A43b, 002A31, 001A33 007A37, 005A52, 005A49, 004A53, 004A51, 048A54 , 006A61, 005A61, 004A63.
Table 1: Feature set values of Child Age images.
S. No
Image
Name Contrast
Correla-tion Energy
Homog- eneity
1 001A02 17.551 0.838 0.034 0.62953
2 001A05 15.478 0.859 0.042 0.66238
3 001A08 20.72 0.81 0.021 0.57649
4 001A10 24.445 0.613 0.023 0.53384
5 002A03 20.61 0.742 0.032 0.59142
6 002A04 23.384 0.652 0.03 0.56721
7 002A07 30.176 0.511 0.01 0.42063
8 008A06 21.905 0.752 0.02 0.5537
9 009A00 19.417 0.789 0.032 0.60454
10 010A01 19.347 0.746 0.029 0.57398
11 010A09 22.9 0.709 0.023 0.55456
12 024A05 27.495 0.539 0.013 0.45444
13 024A10 22.704 0.695 0.019 0.52015
14 025A00 12.626 0.967 0.05 0.70013
15 025A03 25.133 0.59 0.018 0.49319
16 025A07 26.681 0.558 0.016 0.48478
17 002A12 19.234 0.756 0.036 0.60803
18 009A11 16.487 0.9 0.03 0.64593
19 025A12 21.091 0.706 0.029 0.56771
Table 2 :Feature set values of Young Age images.
S. No
Image
Name Contrast
Correla
-tion Energy
Homog- eneity
1 001A22 22.847 0.456 0.02 0.263
2 001A28 29.051 0.526 0.026 0.314
3 001A29 22.198 0.414 0.023 0.257
4 003A23 28.624 0.497 0.031 0.311
5 003A25 21.822 0.451 0.021 0.261
6 012A21 25.679 0.285 0.014 0.169
7 012A23 21.046 0.444 0.027 0.282
8 012A24 22.977 0.352 0.02 0.222
9 012A26 20.086 0.481 0.026 0.294
10 012A27 28.563 0.505 0.033 0.218
11 012A30 23.719 0.354 0.018 0.205
12 024A23 22.342 0.413 0.023 0.247
13 024A25 25.202 0.343 0.018 0.205
14 027A22 25.297 0.296 0.016 0.181
15 027A25 27.468 0.267 0.01 0.13
16 027A30 22.272 0.403 0.023 0.246
17 047A23 23.665 0.315 0.03 0.264
18 047A27 29.253 0.455 0.029 0.287
19 048A30 27.441 0.269 0.014 0.165
20 001A14 27.34 0.57 0.03 0.332
21 001A16 32.474 0.182 0.012 0.128
22 001A18 22.139 0.417 0.025 0.27
23 001A19 28.197 0.235 0.015 0.174
24 002A15 23.684 0.349 0.023 0.24
25 009A13 27.407 0.269 0.013 0.153
26 011A17 21.587 0.436 0.024 0.261
27 011A20 29.685 0.469 0.029 0.298
28 025A15 26.285 0.307 0.015 0.17
29 025A18 24.958 0.316 0.017 0.195
30 025A19 23.555 0.386 0.021 0.233
Table 3: Feature set values of Middle Age images.
S. No
Image
Name Contrast
Correla
-tion Energy
Homog- eneity
1 001A33 19.805 0.367 0.019 0.53
2 001A40 18.09 0.469 0.019 0.582
3 002A31 14.002 0.37 0.018 0.513
4 003A35 16.716 0.592 0.02 0.638
5 003A38 17.139 0.547 0.014 0.631
6 012A32 13.988 0.345 0.017 0.495
7 013A34 15.485 0.318 0.016 0.494
8 018A33 18.772 0.471 0.018 0.616
9 018A34 17.837 0.492 0.021 0.593
10 019A37 18.586 0.393 0.015 0.549
11 020A36 17.882 0.482 0.014 0.573
12 021A35 17.004 0.288 0.012 0.447
13 021A39 16.601 0.277 0.011 0.448
14 025A34 17.18 0.243 0.012 0.445
15 025A39 19.233 0.151 0.008 0.387
16 039A35 16.244 0.268 0.015 0.47
17 047A33 15.747 0.405 0.021 0.575
18 001A43a 15.886 0.316 0.018 0.531
19 003A47 19.327 0.498 0.019 0.597
20 003A49 19.582 0.485 0.019 0.601
21 004A48 18.211 0.495 0.018 0.591
22 005A45 10.867 0.459 0.018 0.578
23 006A42 13.81 0.365 0.02 0.541
24 013A41 12.486 0.4 0.018 0.549
25 013A44 13.879 0.372 0.019 0.524
26 022A50 13.698 0.346 0.019 0.507
27 028A46 15.795 0.316 0.02 0.54
28 039A45 19.97 0.442 0.018 0.569
29 039A50 14.547 0.336 0.011 0.516
[image:4.595.51.283.119.706.2]Table 4: Feature set values of Senior Age images.
S. No
Image Name
Contras t
Corre-lation Energy
Homog eneity
1 003A51 22.901 0.4314 0.0207 0.5557
2 003A57 21.446 0.4721 0.0359 0.6277
3 003A58 21.446 0.4317 0.0393 0.6212
4 003A59 20.446 0.4993 0.037 0.6807
5 003A60 24.376 0.3824 0.0186 0.5219
6 004A53 20.855 0.4928 0.0277 0.5978
7 006A54 23.698 0.4002 0.0194 0.5317
8 006A55 23.698 0.4002 0.0194 0.5317
9 006A56 23.698 0.4002 0.0194 0.5317
10 039A52 24.426 0.3321 0.0182 0.5005
11 047A55 23.694 0.3840 0.0214 0.5346
12 004A62 22.667 0.4134 0.0213 0.5486
13 004A63 20.642 0.4964 0.0265 0.607
14 006A61 22.381 0.3727 0.0263 0.5651
15 006A67 21.31 0.4640 0.0331 0.6038
16 006A69 24.803 0.3712 0.018 0.5221
17 045A64 21.326 0.4285 0.0266 0.5596
18 045A65 20.667 0.4000 0.0327 0.5879
19 045A66 20.297 0.4421 0.0345 0.6012
20 069A52 22.426 0.3321 0.0172 0.5005 From the above tables derive an algorithm to classify the facial image into one of the category of Child age(0-12), Young Age(1330), Middle Age(3150) and Senior Age (51 -70).
Algorithm 1: Age group classification based on features derived from CP-GLCM of TN-LBP
START
if Contrast > 20 and Homogeneity > 0.5
print(“ Facial image is Senior Age (51-70)”) else if Contrast < 20 and energy < 0.022
print(“ Facial image is Middle Age (31-50)”) else if Contrast > 20 and Homogeneity < 0.5
print(“ Facial image is Young Age (13-30)”) else if Correlation > 0.5
print(“ Facial image is child Age (0-12)”) else
print(“ Facial image is unknown age group”) END
4.
COMPARISON OF THE PROPOSED
METHOD WITH OTHER EXISTING
METHODS
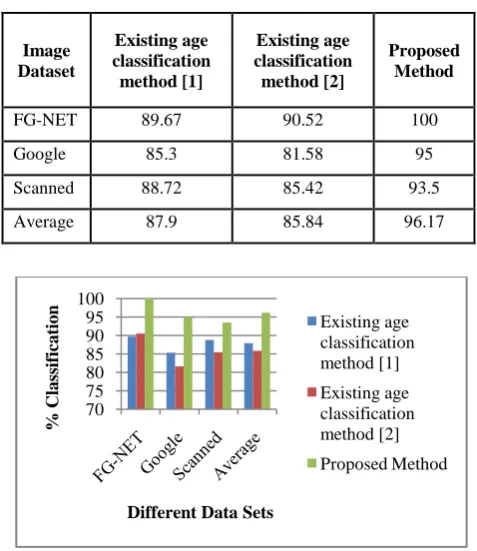
[image:5.595.309.548.254.530.2]The proposed method of age classification is compared with the existing methods [1, 2]. The method proposed by M. Yazdi et.al [1] classified age group using RBF Neural Network Classifier. The age group classification method proposed by Wen-Bing Horng is based on two geometric features and three wrinkle features of facial image. The percentage of classification of proposed method and other existing methods are listed in table 6. The graphical representation of the percentage mean classification rate for the proposed method and other existing methods are shown in Fig. 4.
Table 6: Classification rate of the proposed method with other existing methods.
Image Dataset
Existing age classification method [1]
Existing age classification method [2]
Proposed Method
FG-NET 89.67 90.52 100
Google 85.3 81.58 95
Scanned 88.72 85.42 93.5
Average 87.9 85.84 96.17
Figure 4: Classification chart of proposed method and other existing methods.
5.
CONCLUSIONS
The proposed method estimated the relationship between the Top (outer) and Bottom (inner) corner pixels of TN-LBP. The bottom or inner corner pixels are connected and the top or outer corner pixels of TN-LBP are not connected. The proposed method present in this paper successively utilized the TN-LBP by reducing the complexity in establishing the LBP code for 13 pixels i.e. ranges from 0 to 213-1. The proposed CP-GLCM of TN-LBP achieved a good classification rate when compared to the existing method.
70 75 80 85 90 95 100
%
Cla
ss
ifi
ca
tio
n
Different Data Sets
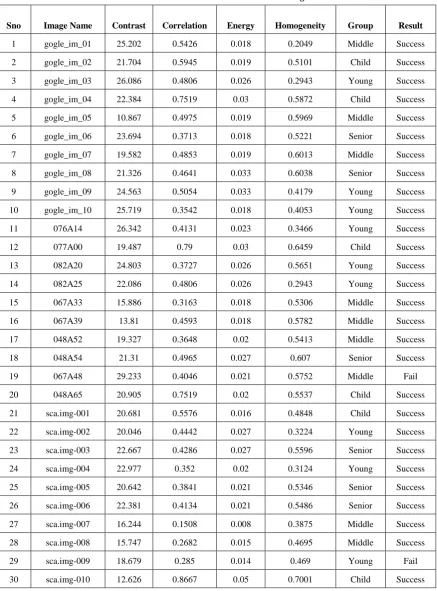
Table 5. Test set results of different dataset images.
Sno Image Name Contrast Correlation Energy Homogeneity Group Result
1 gogle_im_01 25.202 0.5426 0.018 0.2049 Middle Success
2 gogle_im_02 21.704 0.5945 0.019 0.5101 Child Success
3 gogle_im_03 26.086 0.4806 0.026 0.2943 Young Success
4 gogle_im_04 22.384 0.7519 0.03 0.5872 Child Success
5 gogle_im_05 10.867 0.4975 0.019 0.5969 Middle Success
6 gogle_im_06 23.694 0.3713 0.018 0.5221 Senior Success
7 gogle_im_07 19.582 0.4853 0.019 0.6013 Middle Success
8 gogle_im_08 21.326 0.4641 0.033 0.6038 Senior Success
9 gogle_im_09 24.563 0.5054 0.033 0.4179 Young Success
10 gogle_im_10 25.719 0.3542 0.018 0.4053 Young Success
11 076A14 26.342 0.4131 0.023 0.3466 Young Success
12 077A00 19.487 0.79 0.03 0.6459 Child Success
13 082A20 24.803 0.3727 0.026 0.5651 Young Success
14 082A25 22.086 0.4806 0.026 0.2943 Young Success
15 067A33 15.886 0.3163 0.018 0.5306 Middle Success
16 067A39 13.81 0.4593 0.018 0.5782 Middle Success
17 048A52 19.327 0.3648 0.02 0.5413 Middle Success
18 048A54 21.31 0.4965 0.027 0.607 Senior Success
19 067A48 29.233 0.4046 0.021 0.5752 Middle Fail
20 048A65 20.905 0.7519 0.02 0.5537 Child Success
21 sca.img-001 20.681 0.5576 0.016 0.4848 Child Success
22 sca.img-002 20.046 0.4442 0.027 0.3224 Young Success
23 sca.img-003 22.667 0.4286 0.027 0.5596 Senior Success
24 sca.img-004 22.977 0.352 0.02 0.3124 Young Success
25 sca.img-005 20.642 0.3841 0.021 0.5346 Senior Success
26 sca.img-006 22.381 0.4134 0.021 0.5486 Senior Success
27 sca.img-007 16.244 0.1508 0.008 0.3875 Middle Success
28 sca.img-008 15.747 0.2682 0.015 0.4695 Middle Success
29 sca.img-009 18.679 0.285 0.014 0.469 Young Fail
6.
REFERENCES
[1] M. Yazdi, S. Mardani-Samani, M. Bordbar, and R. Mobaraki “Age Classification based on RBF Neural Network” , Canadian Journal on Image Processing and Computer Vision Vol. 3 No. 2, pages: 38-42, June 2012. [2] Wen-Bing Horng, Cheng-Ping Lee and Chun-Wen Chen
“Classification of Age Groups Based on Facial Features”, Tamkang Journal of Science and Engineering, Vol. 4, No. 3, pp. 183-192 Year: 2001.
[3] Ahonen T., Hadid A. and Pietikainen M., “Face Recognition with Local Binary Patterns,” Computer Vision, ECCV Proceedings, pp. 469-481, 2004.
[4] Ahonen T., Hadid A., Pietikainen M., “Face description with local binary patterns: application to face recognition”, IEEE Transactions on Pattern Analysis and Machine Intelligence, vol.28(12), pp.2037–2041, 2006. [5] Chandra Mohan, VijayaKumar V., Damodaram A.,
"Adulthood classification based on geometrical facial features", ICGST-GVIP Journal, Volume 10, Issue 2, pp.39-44, June 2010.
[6] Atkinson, P. M. and Lewis, P. "Geostatistical classification for remote sensing: An introduction", Comput. Geosci., Vol. 26, pp. 361–371, 2000
[7] Young H. Kwon and Niels da Vitoria Loboy, “Age Classification from Facial Images”, Computer Vision and Image Understanding, Vol. 74, No. 1, pp. 1–21, April 1999.
[8] Sirovich L. and Kirby M. “Low-dimensional procedure for the characterization of human face,” J. Opt. Am. A, vol.7, no.3, pp. 519–524, 1987.
[9] Hasegawa H. and Simizu E. “Discrimination of facial age generation using neural networks,” T.IEE Japan, vol.117-C, no.12, pp.1897–1898, 1997.
[10]Kosugi M. “Human-face recognition using mosaic pattern and neural networks,” IEICE Trans., vol.J76-D-II, no.6, pp.1132–1139, June 1993.
[11]Jangala. Sasi Kiran, V. Vijaya Kumar and B. Eswara Reddy. “Age classifications based on second order image compressed and fuzzy reduced grey level (SICFRG) model,” International Journal on Computer Science and Engineering (IJCSE), Vol. 5 No. 06, pp.481–492, Jun 2013.
[12]J Sasi Kiran, Dr. V. Vijaya Kumar and V V Harichandana, “An Effective Age Classification Using Topological Features Based on Compressed and Reduced Grey Level Model of the Facial Skin,” I.J. Image,
Graphics and Signal Processing, Vol. 6, No. 1, pp. 9-17 , November 2013.
[13]Dr. V. Vijaya Kumar, J. Sasi Kiran and Gorti Satyanarayana Murty, “Pattern based Dimensionality Reduction Model for Age Classification,” International Journal of Computer Applications (IJCA), FCS Publishers, USA, Volume 79, No 13, pp. 14-20, October 2013.
[14]Gorti Satyanarayana Murty, J Sasi Kiran and Dr. V. Vijaya Kumar, “ Facial Expression Recognition based on Features Derived from the Distinct LBP and GLCM,” International Journal of Image, Graphics and Signal Processing(IJIGSP), MECS Publisher, Hong Kong, Vol. 6, No. 2, pp. 68-77, January 2014.
[15]Gorti Satyanarayana Murty, Dr. V. Vijaya Kumar and A. Obulesu, “Age classification based on simple LBP transitions,” International Journal on Computer Science and Engineering (IJCSE), Vol. 5 No. 10, pp. 885-893, October 2013.
7.
AUTHOR’S PROFILE
Pullela S V V S R Kumar is working as Associate Professor of CSE at V.S.Lakshmi Engineering College for Women. He received MCA Degree from Andhra University in 1998 and M.Tech (IT) from Punjabi University, Patiala in 2003. He is having more than 14 years of experience and published 8 research papers in various International Journals and Conferences. His research interests include Data Mining, Pattern Recognition and Image Processing. He is currently pursuing his Ph.D. from Acharya Nagarjuna University, Andhra Pradesh.
Dr. J V R Murthy is working as a Professor of CSE & Director, Institute Industry Interaction Placement & Training at University College of Engineering, Jawaharlal Nehru Technological University Kakinada, Kakinada. He received his B.Tech(EEE) from JNTU College of Engineering Kakinada. He received his M.Tech (CSE) for IIT, Karaghpur. He has completed his Ph.D from JNTU, Hydearbad in the year 2004. He worked as a senior consultant for KEYSPAN ENERGY, New York and AXA-Corporation, New York. His research interests include Data Mining, Cloud Computing and Information Retrieval Systems. He has produced 4 Ph.D.’s and produced more than 30 research papers in various National & International Journals & Conferences. He is a life member of ISTE.